
Fully managed, hosted Postgres on AWS, GCP, and Azure.
Joined August 2013
- Tweets 3,572
- Following 2,060
- Followers 7,560
- Likes 1,104
711 Photos and videos


Crunchy Data retweeted

One of those things that seems simple but is way more complicated and annoying in reality is dealing with timestamps.
Here we have a fun deep dive on timestamps with Postgres and how British Columbia in particular highlights an interesting wrinkle.
crunchydata.com/blog/british…
2
4
12
1,117

Jun 11
The first example of pagination developers see is usually OFFSET because it is simple to understand and implement. But OFFSET is a trap. OFFSET gets slower the deeper you paginate. Rarely do end users paginate all the way through 100 pages, but every bot hitting your page will follow all the pagination links. A poor query pattern served to bots ... wasted time and money.
Use a keyset cursor pagination instead. Keyset cursor pagination is similar effort for implementation in the database, but takes more time to get correct with the front end, and prevents jumping to pages without knowing the prior value. The good news is that it is much faster and more efficient for the database.
The URL for offset pagination will look like this: `/events?page=10001`
The URL for keyset cursor pagination will look like this: `/events?cursor=1781195018.9577&cursor_id=12345`
A keyset cursor is a WHERE clause that tells the database where to start. It is a pointer to a specific row in the index. The query starts at that position and returns the next N rows. The cursor is just the value of the last row from the previous page, and the cursor_id is the id value of the last row from the previous page. The where clause is something like `WHERE published_at < :cursor AND id < :cursor_id` (for descending order) or `WHERE published_at > :cursor AND id > :cursor_id` (for ascending order). You'll need a composite index on `(published_at, id)` to get benefit of this pattern.
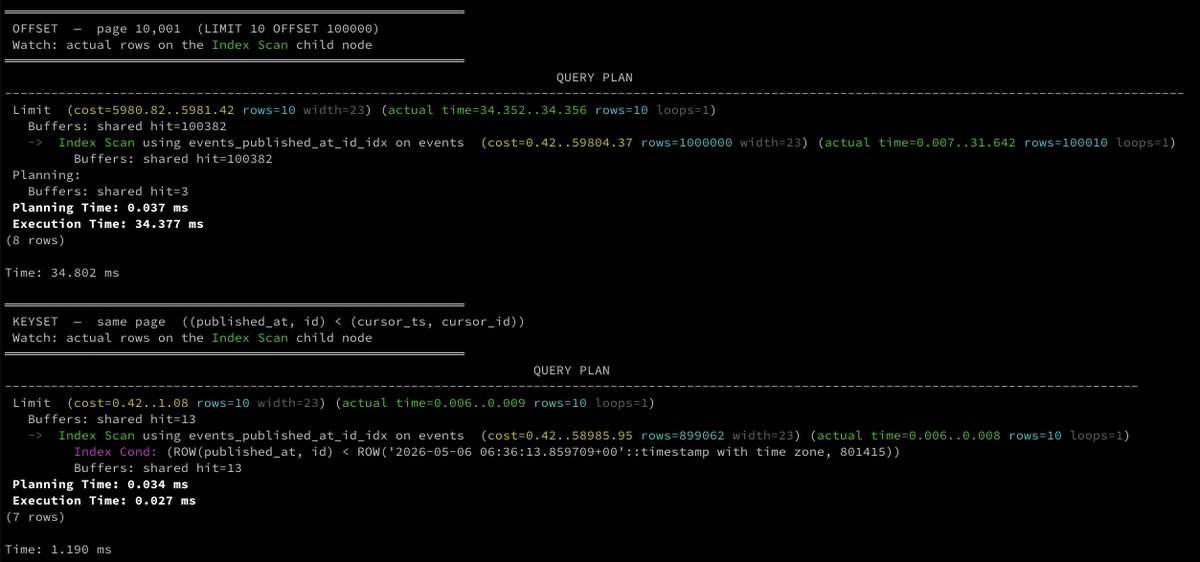
Below are two queries that return the same 10 rows from a 1,000,000-row events table. The OFFSET query walks through 100,000 rows to find the starting position, while the keyset cursor query jumps directly to the starting position and returns 10 rows. The keyset cursor is 1,800x faster for page 10,001.
OFFSET
```sql
SELECT id, event_type, published_at
FROM events
ORDER BY published_at DESC
LIMIT 10 OFFSET 100000;
```
Execution Time: 31.187 ms. If you look at the explain in the posted image, you'll see the index walked 100,000 entries to discard them, then returned 10.
Keyset cursor
```sql
-- :cursor = published_at of the last row returned on the previous page
SELECT id, event_type, published_at
FROM events
WHERE published_at < to_timestamp(:cursor)
AND id < :cursor_id
ORDER BY published_at DESC
LIMIT 10;
```
Execution Time: 0.017 ms. The index started at the cursor position and stopped after 10 rows.
```
Limit (cost=0.42..1.08 rows=10 width=23) (actual time=0.006..0.009 rows=10 loops=1)
Buffers: shared hit=13
-> Index Scan using events_published_at_id_idx on events (cost=0.42..58985.95 rows=899062 width=23) (actual time=0.006..0.008 rows=10 loops=1)
Index Cond: (ROW(published_at, id) < ROW('2026-05-06 06:36:13.859709 00'::timestamp with time zone, 801415))
Buffers: shared hit=13
```
`rows=10`. The index started at the cursor position and stopped after 10 rows.
The Difference
OFFSET has no way to skip, so the index must scan N entries to find the starting position. `WHERE published_at < :cursor AND id < :cursor_id` tells the index exactly where to start. It reads only what it returns.
The cursor is just the `published_at` value of the last row from the previous page. Store it in the response, pass it back on the next request:
OFFSET works when the table is small, but for anything user facing, keyset pagination is the way to go. It is faster, more efficient, and scales to any page depth with logrithmic cost.
5
23
786
Jun 9
Postgres protects hot data from eviction during large sequential scans using a Sequential Scan Ring Buffer.
In this tweet, we are going to see how many times we can use the term "shared_buffers" ... let's go ...
Without the Sequential Scan Ring Buffer, a single `SELECT * FROM large_table` would read every page of a large table into shared_buffers, evicting whatever was already there. One cold analytical query could trash the working set for every other session.
What is a "ring buffer"?
When Postgres detects a large sequential scan, it switches to a ring buffer strategy: a temporary circular window carved out of shared_buffers. Pages cycle through it as the scan progresses and are immediately evictable afterwards which isolates the main cache.
The ring buffer sizes adapt to the operation:
○ Large sequential scans: starts at a 32-page (256KB) baseline, but scales a bit in Postgres 17 for asynchronous I/O
○ VACUUM: 256 pages (2MB) by default since Postgres 16 and tunable via vacuum_buffer_usage_limit
○ COPY and other Bulk Writes: 2048 pages (16MB)
Kicks in at 25% of the shared_buffer
The threshold is `shared_buffers / 4`. If the table being scanned is larger than a quarter of shared_buffers, the ring buffer strategy is used.
However, maintenance operations follow their own specific rules. The ring buffer for vacuum is set explicitly by the vacuum_buffer_usage_limit setting, but automatically caps this maintenance ring buffer at 1/8 the size of shared_buffers.
What this means in practice
○ Application data is protected from eviction by large scans. If your working set fits in shared_buffers, it will stay there even if you run a big sequential scan.
○ Sequential scans on tables larger than shared_buffers won't be retained in the Postgres cache, though subsequent reads can still hit the OS page cache rather than paying a physical disk I/O penalty.
○ Parallel workers performing sequential scans will each use their own ring buffer, thus increasing throughput for large scans while still protecting the main buffer pool.
○ Tables just under the 25% shared_buffers threshold can still cause cache evictions.
4
31
1,148
Jun 8
But the query was fast in development and staging!?!
What are the signs to look for that you've created a query that is fast locally, but needs performance considerations in production?
There are two inflection points where a simple query gets meaningfully slower:
1) When the sort spills out of memory
2) When the table scan moves to disk
The examples below are in resource constrained environments, but the pattern of behavior and output is similar to what you'd see even in larger environments, only with much, much larger numbers of rows.
A simple query
```sql
SELECT user_id, event_type, created_at
FROM events
WHERE user_id = 1
ORDER BY created_at DESC
```
Without an index, Postgres must scan the entire table to find the user's events even if there are only a few rows (Narrator: if there are zero rows for a user, Postgres may choose not to scan any rows due to table and column statistics, which we talked about a while back).
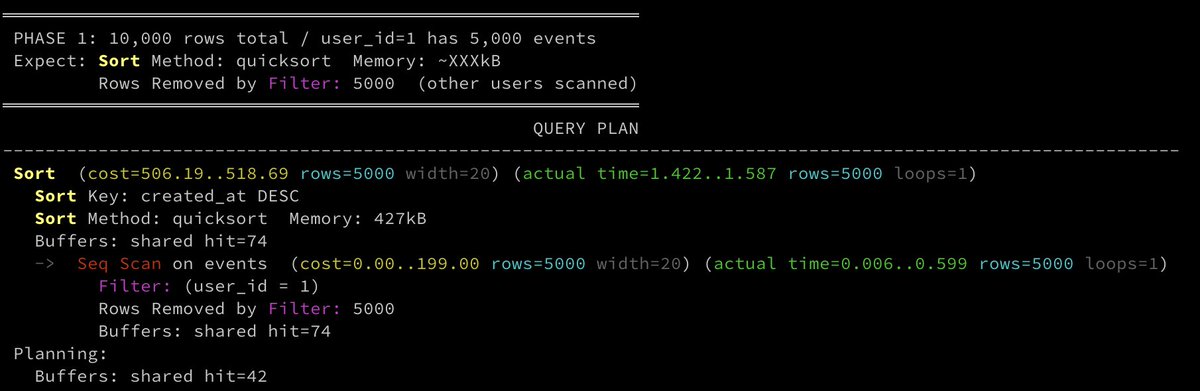
Phase 1) everything fits in memory
With 10,000 rows, and user_id=1 has 5,000 events, and `work_mem = 1MB`:
```
Sort (cost=506.19..518.69 rows=5000 width=20) (actual time=1.422..1.587 rows=5000 loops=1)
Sort Key: created_at DESC
Sort Method: quicksort Memory: 427kB
Buffers: shared hit=74
-> Seq Scan on events (cost=0.00..199.00 rows=5000 width=20) (actual time=0.006..0.599 rows=5000 loops=1)
Filter: (user_id = 1)
Rows Removed by Filter: 5000
Buffers: shared hit=74
```
• `Sort Method: quicksort Memory: 427kB`: the 5,000 rows are sorted in RAM
• `Rows Removed by Filter: 5000`: the other 5,000 rows were scanned and discarded
• `Buffers: shared hit=74`: all 74 table pages were in shared_buffers
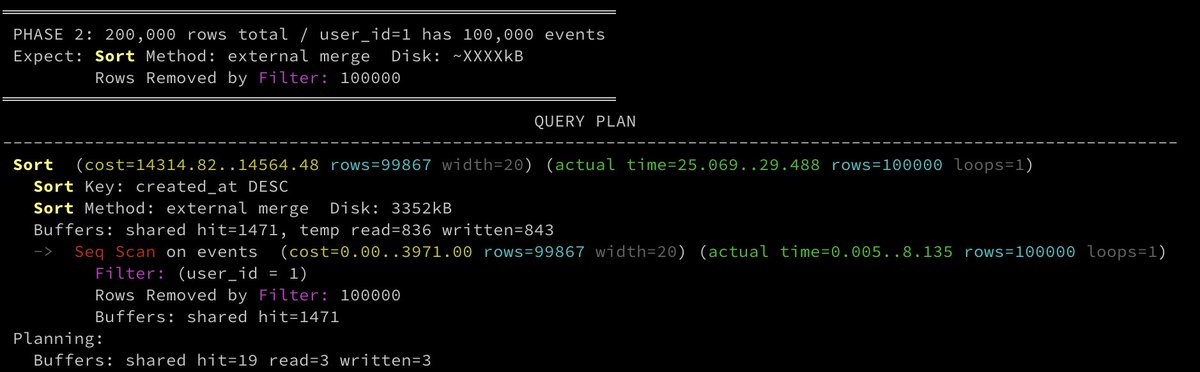
Phase 2) sort spills to disk
With 200,000 rows. and user_id=1 now has 100,000 events, and `work_mem = 1MB`, the sort keys for 100k rows no longer fit in memory:
```
Sort (cost=14314.82..14564.48 rows=99867 width=20) (actual time=25.069..29.488 rows=100000 loops=1)
Sort Key: created_at DESC
Sort Method: external merge Disk: 3352kB
Buffers: shared hit=1471, temp read=836 written=843
-> Seq Scan on events (cost=0.00..3971.00 rows=99867 width=20) (actual time=0.005..8.135 rows=100000 loops=1)
Filter: (user_id = 1)
Rows Removed by Filter: 100000
Buffers: shared hit=1471
```
• `Sort Method: external merge Disk: 3352kB`: 3.3MB spilled because 100k rows × ~20 bytes > 1MB `work_mem`
• `temp read=836 written=843`: 843 temp pages written to disk and read back during the merge
• `Rows Removed by Filter: 100000`, but scanned prior to sort
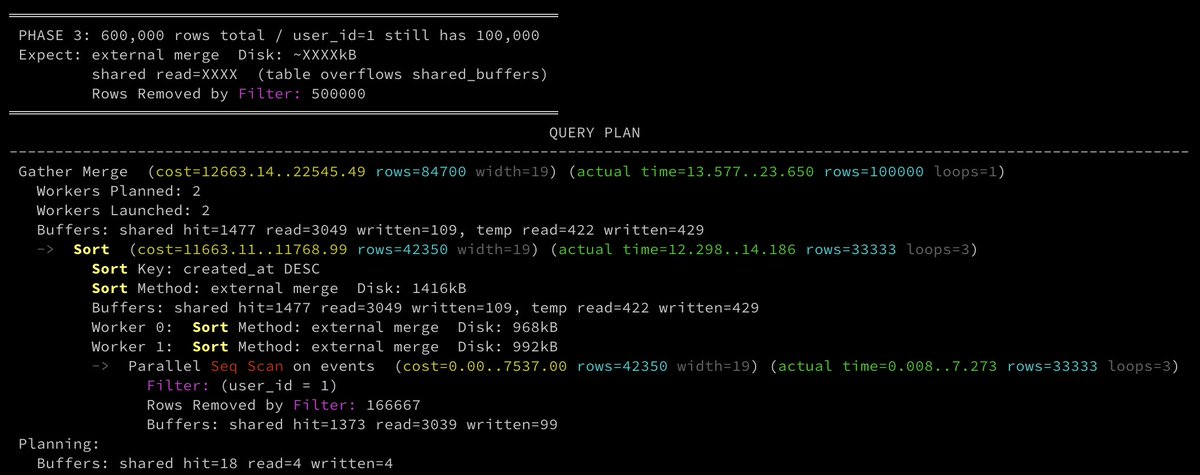
Phase 3) table scan moves to disk
600,000 rows total. user_id=1 still has 100,000 events. The other 500,000 rows belong to other users and Postgres scans all of them anyway. The table now overflows shared_buffers (16MB = 2,048 pages; table is ~4,412 pages).
```
Gather Merge (cost=12663.14..22545.49 rows=84700 width=19) (actual time=13.577..23.650 rows=100000 loops=1)
Workers Planned: 2
Workers Launched: 2
Buffers: shared hit=1477 read=3049 written=109, temp read=422 written=429
-> Sort (cost=11663.11..11768.99 rows=42350 width=19) (actual time=12.298..14.186 rows=33333 loops=3)
Sort Key: created_at DESC
Sort Method: external merge Disk: 1416kB
Buffers: shared hit=1477 read=3049 written=109, temp read=422 written=429
Worker 0: Sort Method: external merge Disk: 968kB
Worker 1: Sort Method: external merge Disk: 992kB
-> Parallel Seq Scan on events (cost=0.00..7537.00 rows=42350 width=19) (actual time=0.008..7.273 rows=33333 loops=3)
Filter: (user_id = 1)
Rows Removed by Filter: 166667
Buffers: shared hit=1373 read=3039 written=99
```
The planner launched 2 parallel workers which means it ran faster by splitting the seq scan and sort across 3 processes. Each worker sorted ~33k rows instead of 100k, so each spill was smaller.
The things to be concerned about here are:
• `shared read=3049`: the table overflowed shared_buffers; 3,049 pages were read from disk
• `Rows Removed by Filter: 166,667 × 3 workers = 500,001`: 500k rows scanned and discarded
• All three sort operations still spilled: parallel didn't eliminate the sort, just distributed it
Solution
The solution to this problem should be driven by the needs of the application it serves. In most simplistic terms, an index on events (user_id, created_at DESC) would reduce sort load. However, solutions may also include application-level caching, a materialized view, or table partitioning.
4
12
644
Jun 5
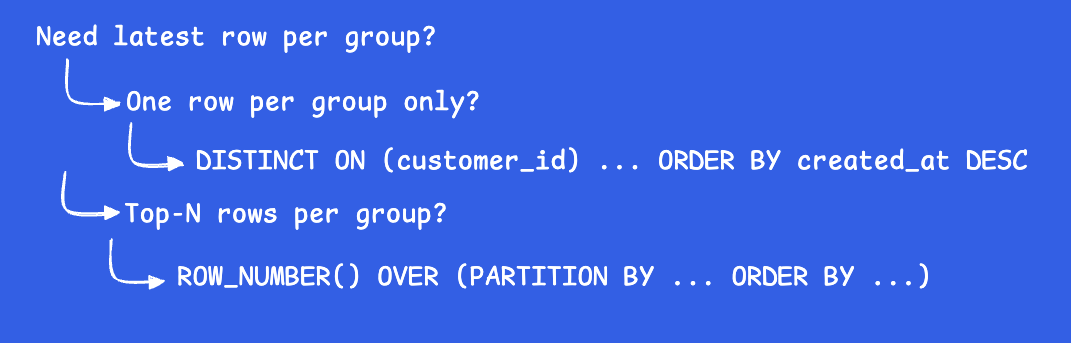
What is your go-to SQL pattern to return the latest row per group in Postgres? The first pattern to reach for is DISTINCT ON.
In a totally unscientific test on a table with 100,000 rows and 20,000 customer_ids, we compared 3 different query patterns running 20 times each, each pre-warmed with noise queries between runs to shuffle the buffer cache. The median execution times were:
No index:
- 32.92ms: Self-join with MAX
- 34.75ms: DISTINCT ON
- 38.68ms: Window function with ROW_NUMBER()
Index on `(customer_id, created_at DESC)`:
- 38.01ms: Self-join with MAX
- 15.99ms: DISTINCT ON
- 25.36ms: Window function with ROW_NUMBER()
Without an index, why are the results similar when I am recommending DISTINCT ON? For this small, unscientific example, the self-join uses a hash aggregate that fits entirely in memory, while `DISTINCT ON` and `ROW_NUMBER()` both require an external sort that spills to disk. Those patterns do less total work conceptually, but they pay a sort cost the self-join avoids. With an index, `DISTINCT ON` eliminates the sort entirely, and it drops from 35ms to 16ms while the self-join is unchanged (it actually ends up slower after an index due to buffer cache pressure from index pages loaded by the other queries in the shuffled run).
For examples below, imagine something as simple as the following orders table:
```
CREATE TABLE orders (
id bigint PRIMARY KEY,
customer_id int,
status text,
created_at timestamptz
);
```
Self-join with MAX
This is the pattern I was taught 20 years ago when I first learned SQL on a not-Postgres database. It's still common in ORMs that generate SQL for multiple databases, but it's not ideal for Postgres.
```
SELECT o.*
FROM orders o
INNER JOIN (
SELECT customer_id, MAX(created_at) AS latest
FROM orders
GROUP BY customer_id
) AS latest ON o.customer_id = latest.customer_id
AND o.created_at = latest.latest
```
This scans `orders` twice: once to find MAX per group, once to join back and fetch the full row. The join on customer_id and created_at is also fragile because two orders for the same customer can share the exact same timestamp. So, you'll want to add a tie-breaker.
In this small example, without an index self-join is the fastest of the three because the hash aggregate fits in memory. With an index it becomes the slowest because the other two queries load index pages into shared_buffers, displacing the heap pages.
DISTINCT ON
This is the Postgres-specific pattern to use. Why Postgres-specific? Because "DISTINCT ON" is not in the SQL Standard.
```sql
SELECT DISTINCT ON (customer_id)
customer_id, status, created_at
FROM orders
ORDER BY customer_id, created_at DESC
```
Returns exactly one row per customer without a join. The `DISTINCT ON (customer_id)` keeps the first row per group after the `ORDER BY` is applied.
```
Unique (cost=12091.82..12591.82 rows=19998 width=20) (actual time=20.538..28.124 rows=20000 loops=1)
Buffers: shared hit=742, temp read=417 written=418
-> Sort (cost=12091.82..12341.82 rows=100000 width=20) (actual time=20.537..24.219 rows=100000 loops=1)
Sort Key: customer_id, created_at DESC
Sort Method: external merge Disk: 3336kB
Buffers: shared hit=742, temp read=417 written=418
-> Seq Scan on orders (cost=0.00..1736.00 rows=100000 width=20) (actual time=0.005..4.951 rows=100000 loops=1)
Buffers: shared hit=736
```
In this example, the sort spills 3336kB to disk because `work_mem` is too small to hold the sort in memory.
Using indexes with DISTINCT ON
Eliminate the sort with a composite index:
```sql
CREATE INDEX ON orders (customer_id, created_at DESC);
```
The EXPLAIN:
```
Result (cost=0.42..5006.10 rows=20155 width=20) (actual time=0.029..11.558 rows=20000 loops=1)
Buffers: shared hit=1930 read=386
-> Unique (cost=0.42..5006.10 rows=20155 width=20) (actual time=0.027..10.411 rows=20000 loops=1)
Buffers: shared hit=1930 read=386
-> Index Scan using orders_customer_id_created_at_idx on orders (cost=0.42..4756.10 rows=100000 width=20) (actual time=0.026..6.576 rows=100000 loops=1)
Buffers: shared hit=1930 read=386
```
The sort is gone entirely because the index is already sorted. Postgres walks the index in `(customer_id, created_at DESC)` order, and `DISTINCT ON` keeps the first row per `customer_id`. Median execution time drops from 35ms to 16ms.
Window function with ROW_NUMBER()
For more flexibly in the number of rows returned per group, use window functions:
```sql
SELECT customer_id, status, created_at
FROM (
SELECT
*,
ROW_NUMBER() OVER (PARTITION BY customer_id ORDER BY created_at DESC) AS rn
FROM orders
) ranked
WHERE rn = 1
```
This reads every row, assigns row numbers, then filters. Generally similar cost to the sort-based `DISTINCT ON` but slightly more overhead in tracking the window frame. But, you can retrieve more than one row per group.
3
17
1,087
May 29
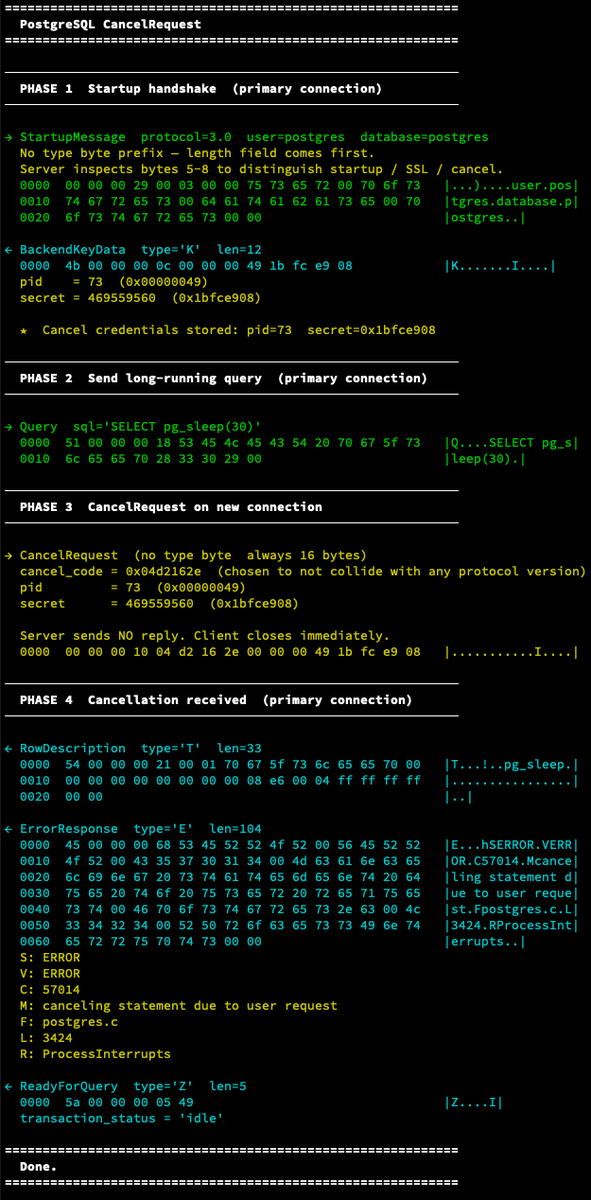
When a query is running in psql, and you press Ctrl c, it sends a cancel request to the server. But how does that work?
The server can't use the existing connection because it is busy processing the current query. So Postgres uses a second, ephemeral connection performing like a fire-and-forget SIGINT. It is simple by design, because cancel has to work even when everything else is stuck.
All drivers, clients, and tools that support cancel use the same mechanism.
A pid, a secret, and a cancel request code
During connection initialization, after authentication completes, the server responds with `BackendKeyData` message that contains:
• pid : the process ID of the backend handling your connection
• secret : a random 32-bit integer generated at session start
The agreed upon cancel request code is the fixed value: (`0x04d2162e`) or `PG_PROTOCOL(1234,5678)` in Postgres source code.
To cancel a query, the client opens a new connection to the Postgres port and sends a cancel request message containing the PID, secret, and cancel request code.
What the server does:
1. Recognizes message as a `CancelRequest`, not a startup message
2. Looks up the backend process with the matching PID
3. Verifies the secret key matches
4. Sends `SIGINT` to that backend process
5. Closes the cancel connection without responding
The backend receives `SIGINT`, which triggers Postgres's interrupt handling. It then throws the following error to the original connection:
```
ErrorResponse: ERROR: canceling statement due to user request
ReadyForQuery
```
What happens when the query receives a SIGINT? That's a bit longer of a read than can be handled on a Friday afternoon. We'll cover that on like a early-morning Tuesday post.
1
5
55
3,795
May 27
The solution to some of the most common database performance issues don't require a change to the database. The database is just a single component of a much larger system. That system includes human behavior, UX design, changing code, and changing use cases.
Below are some of the issues we've seen that look like database performance problems that aren't actually database problems.
Users hammering refresh
When users think a page isn't loading, they've been trained to look for a reload. Every reload triggers the same queries. We've seen this with long-running reports. The reports are instant when application usage was low, but with more customers, more data, and more complexity, reports require more query time and more formatting time at the application level. If the "run report" button doesn't give feedback that it is running, users have been trained to click it again or hit refresh.
Signs:
• `calls` in `pg_stat_statements` spikes without an associated traffic spike
• query spike tied to specific page loads
• users report the page is "broken" or "loading forever"
Fix: loading states that disable buttons, optimistic UI, generate reports asynchronously, or even just a spinner that makes it obvious the page is working. No database can outrun a front-end that enables DDOSing it.
N 1 queries from an ORM
You load a list of 100 orders. Your ORM then fires 100 individual queries to fetch the customer for each order. Then, your dashboard shows the total number of orders for each customer, which is another 100 queries. Your dashboard shows 201 queries per page load instead of 1.
Each query is 2ms. But 201 × 2ms = 404ms of serial database round trips on every single request. At 500 requests/minute, a single page sends thousands of extra queries per minute that shouldn't exist.
Fix: Reduce to a single query using `JOIN` and aggregation. Some ORMs have this functionality, and others you may need to write the SQL.
Aggressive polling loops that exceed data change rate
A developer adds `setInterval(() => fetchStatus(), 1000)` to check an order status. It ships to production. 50,000 active sessions polling once per second = 50,000 queries per second against a table that changes once per minute.
Fix: WebSockets, server-sent events, or a much longer polling interval.
A query that is slow for it's new use case
A report query takes 800ms. It runs once a day for the finance team at 9am. Then someone adds it to a dashboard widget that auto-refreshes every 30 seconds. Every person with the dashboard open is now running an 800ms query 120 times per hour.
The query didn't get slower. The access pattern changed.
Fix: cache the report with a materialized view, move it to a background job, or remove the auto-refresh.
Sometimes, it's a system design problem, not a database problem
More than once, a screen recording of a user producing the error helped me understand faster than digging through any logs.
1
17
1,184
May 26
"Because we don't necessarily know at this point"
- commit from 2004 that still exists in Postgres today.
The below screenshot is from the `analyze.c` file in the Postgres source code. The number 300 is a hardcoded value inside of Postgres's ANALYZE code. The rationale is based on a paper entitled "Random sampling for histogram construction: how much is enough?" written in 1998 when data sizes were much smaller and hardware was much slower. The question the paper answers is: to build statistics enabling optimization of queries of unindexed data, how many rows does ANALYZE need to sample to build accurate enough statistics?
The answer is 300-ish samples for each bin you want in your equi-height histogram. Why? The paper shows that required sample size grows linearly with the number of bins but only logarithmically with table size for most cases, so you see diminishing returns beyond a few hundred samples per bin.
For instance, the default `statistics_target` is 100. That means Postgres aims to sample 300 x 100 values to build an equi-height histogram with 100 bins and while also storing the 100 most common values.
(Check out the previous post for deets on how Postgres uses equi-height histogram and most common values)
Why all this work for unindexed data?
Because in 1998, indexes were extraordinarily costly to build and maintain. Indexes took up valuable disk space, used the limited IOPs during writes and builds. Additionally table scans were slow and blocking. In 1998, hard drive performance was measured in RPMs, so talking IOPs was variable because random page seeks required waiting for the disk to rotate, and location on disk was unknown. The tests for this paper ran on Pentium 200MHz with 64MB of RAM, and a 7.2k RPM SCSI drive.
Postgres users continue to benefit from this work during the era of constrained resources. Indexes aren't free today, and you can have too many indexes, but they aren't as costly as they were. Also, unindexed data isn't as costly as it was.
The paper also acknowledges the problem is "provably difficult by establishing a limit on the achievable accuracy of estimation in the worst-case." Thus, "we devise a simple estimator which we believe is optimal." This number is a tradeoff between accuracy and performance. A smaller multiplier would lead to less accurate statistics, which could cause the planner to make bad decisions. A larger multiplier would lead to more accurate statistics, but it would also make ANALYZE slower. And remember, ANALYZE was much, much slower back then.
What does statistics_target control?
The statistics target controls the number of values stored for Most Common Values and the Equi-height Histogram. The following is true:
```
statistics_target = 100 → 30,000 samples, 100 MCVs, 100 buckets
statistics_target = 500 → 150,000 samples, 500 MCVs, 500 buckets
statistics_target = 1000 → 300,000 samples, 1000 MCVs, 1000 buckets
```
This value is set by default at the database level, and can be overridden at the column level.
```
-- Per-column override:
ALTER TABLE requests ALTER COLUMN status_code SET STATISTICS 500;
ANALYZE requests;
```
For larger databases, there is usually at least one column where a per column setting may be the right approach. Don't raise the global default just because one column needs more granularity. Given the performance gains of the underlying hardware, the performance gains from changing column statistics aren't as significant as they once were.
2
17
184
25,789
May 21
Postgres 19 is expected to include a new contrib extension called `pg_plan_advice` that enables user-directed hints. How has Postgres run without hints while other databases rely on it? Statistics. Since 1998, Postgres has used column level statistics to generate query plans. The algorithm has seen many improvements through the years, and is a well vetted system for choosing query plans using statistics. The statistics generated using `ANALYZE` are the backbone of the query planner.
When you run `ANALYZE`, Postgres builds two structures for each column. These are the primary structures the query planner looks at when deciding how many rows your `WHERE` clause will return.
Below, examples are from table storing HTTP requests. That gives few different data types that are easy to conceptualize.
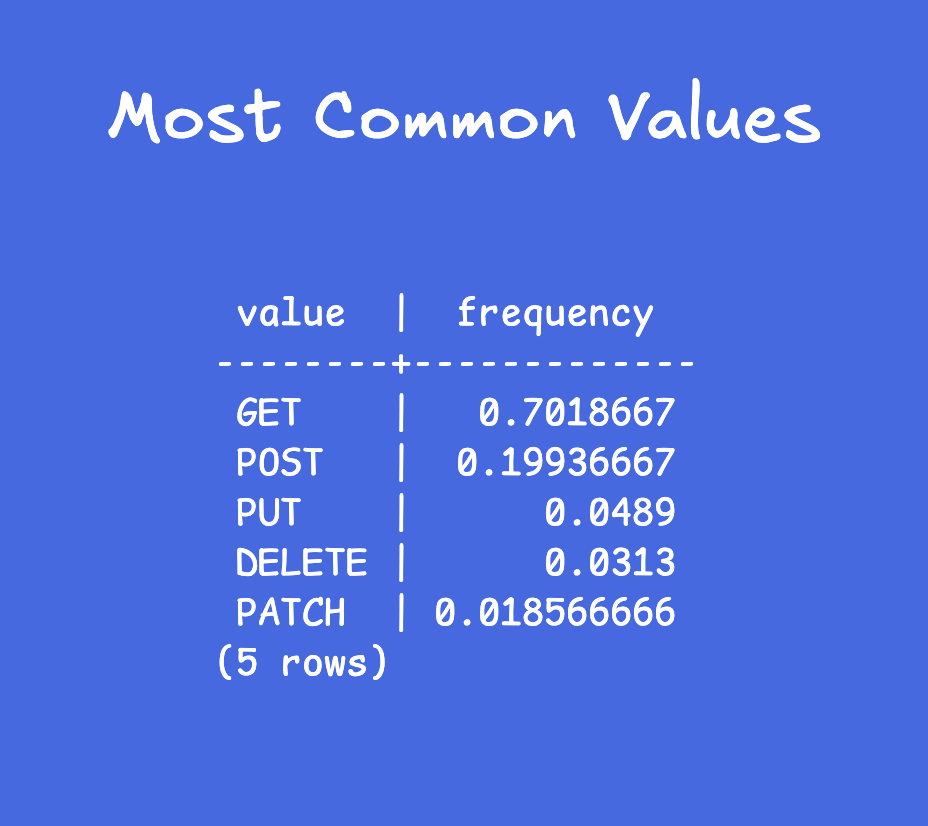
Most Common Values (MCV) list
If the hardest thing in computer science is caching and naming, the most common values list should be in the computer science hall of fame for nailing a name.
It is a column's most frequent values and their exact frequencies:
```
most_common_vals = {GET, POST, PUT, DELETE, PATCH}
most_common_freqs = {0.70, 0.20, 0.05, 0.03, 0.02}
```
These are the HTTP methods, so the values are limited by the spec.
For `WHERE method = 'GET'`, the planner reads `0.70` directly from this list. 70% of 200,000 rows = estimated 140,000 rows.
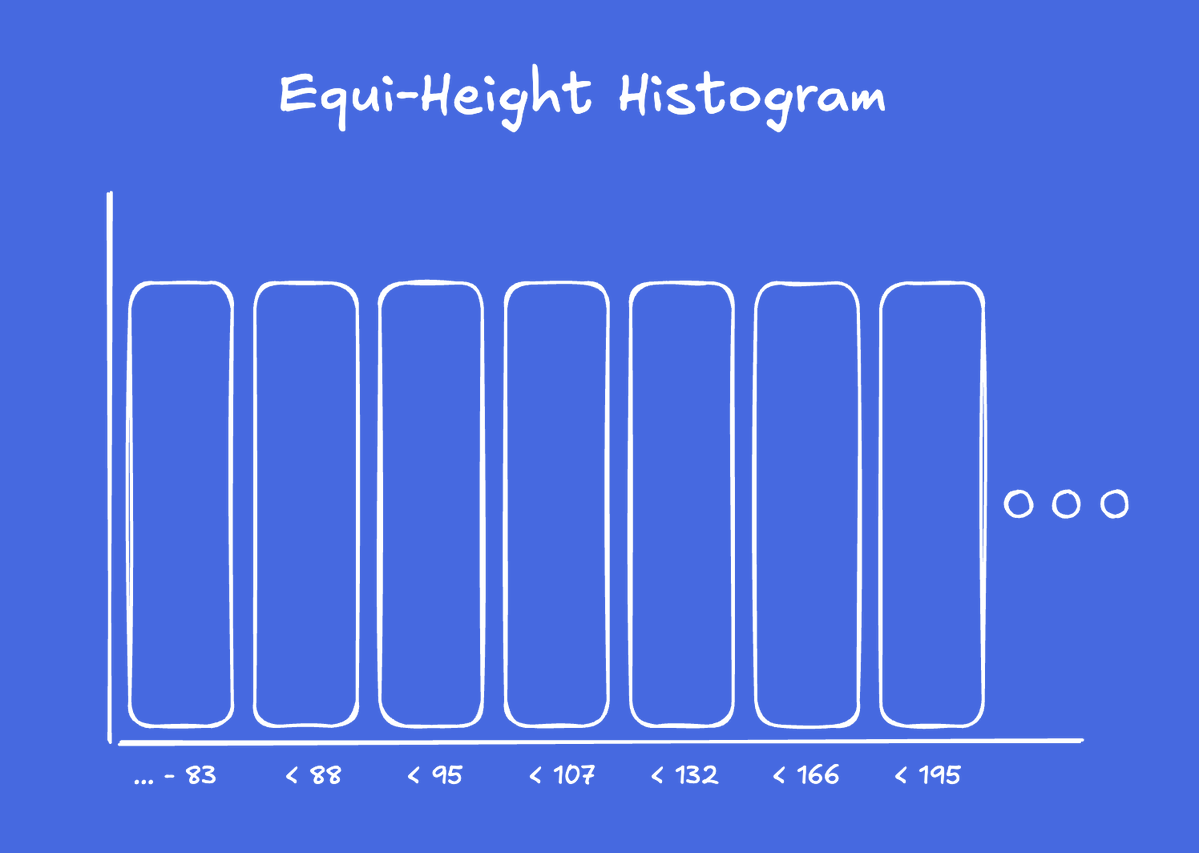
Histogram with equi-height buckets
For values NOT in the MCV list, Postgres builds equi-height buckets. Below, imagine a histogram for a column with the values of a response times in milliseconds:
```
histogram_bounds = {83, 88, 95, 107, 132, 166, 195, 245, 362, 554, 965, 2622164}
```
Each bucket contains roughly the same number of rows. The bucket `[245, 362]` has about the same row count as `[83, 88]`.
By fixing the row count, you get a variable range count. This simplifies row count estimation.
NULL Histograms
When all distinct values fit in the MCV list. The `method` column has only 5 values. All 5 are in the MCV list, so `histogram_bounds` is NULL.
Why two structures?
MCVs give exact frequencies for common values, and histogram handles the long tail (approximation for rare/continuous values). Together they cover the full distribution without storing every value.
To see these stats for a table and column, run:
```sql
SELECT
most_common_vals,
most_common_freqs,
histogram_bounds
FROM pg_stats
WHERE tablename = 'requests'
AND attname = 'status_code';
```
11
66
2,708
May 20
Prepared statements and prepared transactions are completely different features in Postgres that happen to share a word. One is widely used and safe. The other is rarely used and can cause outages if mismanaged. Let's start with the safe one:
Prepared Statements (PREPARE / EXECUTE)
A commonly used query optimization feature. Parse a SQL statement once, then execute it many times with different parameter values. Saves parsing and potentially planning overhead:
```
PREPARE find_user (text) AS
SELECT * FROM users WHERE email = $1;
EXECUTE find_user('alice@example.com');
EXECUTE find_user('bob@example.com');
DEALLOCATE find_user;
```
• Exists for duration of the session
• In-memory, no persistence
• Harmless if forgotten
• Visible with `SELECT * FROM pg_prepared_statements`
• Most frameworks / orms / libraries use this for optimization
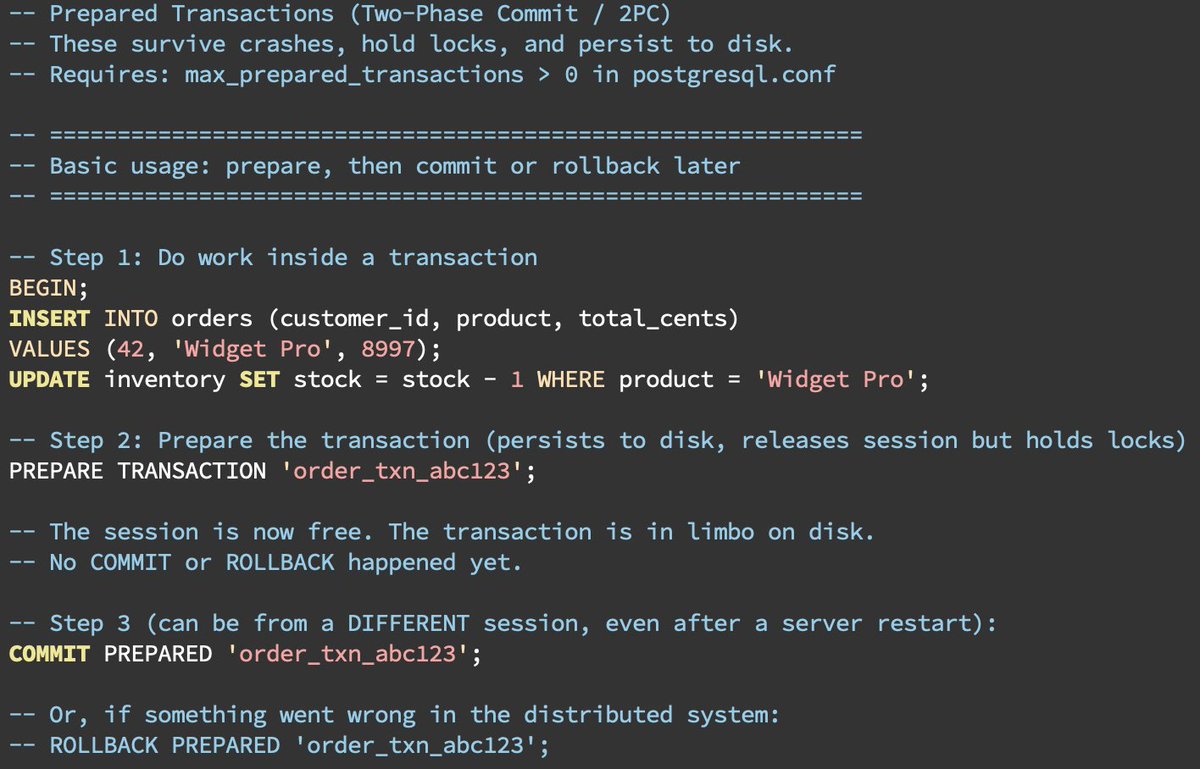
Prepared Transactions (PREPARE TRANSACTION / COMMIT PREPARED)
Most applications do not need this feature.
This is Postgres’ implementation of two-phase commit (2PC / XA transactions). Prepare a transaction to commit, persist the ready state to disk, and resolve it later from a different session:
```
BEGIN;
INSERT INTO orders VALUES (1, 'widget', 99);
PREPARE TRANSACTION 'order_txn_abc123';
-- Later
COMMIT PREPARED 'order_txn_abc123';
-- or: ROLLBACK PREPARED 'order_txn_abc123';
```
• Survives crashes and restarts (written to `pg_twophase/` in the catalog)
• Holds a lock until resolved
• Holds XID, and blocks vacuum
• Blocks DDL on affected tables
• Requires max_prepared_transactions > 0 (default is 0, which is one of the better default settings)
5
39
1,714
May 19
Let's demystify Postgres logical replication with `pg_recvlogical`. It's a CLI tool shipped with Postgres that streams logical replication changes to stdout. It's an easy way to understand the data accessible via logical replication so you can build your own direct-from-Postgres pipelines.
A bit of disclaimer: this is for demonstration purposes only. In production, you'll want a more robust CDC tool that handles retries, durability, schema evolution, etc. But `pg_recvlogical` is a great way to see the core mechanism in action. Also, we are about to run, some commands that will modify your database. Make sure you have a test database and not a production one, or use Docker to spin up a disposable Postgres instance.
Now, let's code:
To start a Docker Postgres ready for logical replication do the following:
1. Start Postgres in a Docker container with the wal_level set to logical:
```bash
docker run --name pg-test -e POSTGRES_PASSWORD=secret -d -p 5432:5432 postgres:latest -c wal_level=logical
```
2. Connect to the database (password is "secret") and create the database, the table, and the replication slots:
```bash
docker exec -it pg-test createdb -U postgres mydb
docker exec -it pg-test psql -U postgres mydb
```
```sql
CREATE TABLE orders (
id SERIAL PRIMARY KEY,
product TEXT,
quantity INTEGER
);
SELECT pg_create_logical_replication_slot('my_slot', 'test_decoding');
```
3. In a different terminal, run run `pg_recvlogical` to stream changes:
```bash
docker exec -it pg-test pg_recvlogical -U postgres -d mydb --slot=my_slot --start -f -
```
4. In your terminal still connected to mydb, insert and update data. Copy and paste each of these commands below individually, and watch the stream of data from pg_recvlogical:
```sql
INSERT INTO orders (id, product, quantity) VALUES (1, 'Widget', 3);
UPDATE orders SET quantity = 4 WHERE id = 1;
DELETE FROM orders WHERE id = 1;
```
And you'll see the changes stream in real-time:
```BEGIN 742
table public.orders: INSERT: id[integer]:1 product[text]:'Widget' quantity[integer]:3
table public.orders: UPDATE: id[integer]:1 product[text]:'Widget' quantity[integer]:4
table public.orders: DELETE: id[integer]:1
COMMIT 742
```
This is basically how every CDC tool works under the hood: it connects to a logical replication slot and decodes WAL changes into a stream of events. Of course, it takes a bit more to build production-ready pipelines (error handling, retries, durability, schema evolution, etc), but this is the core mechanism.
3
18
1,190
May 18
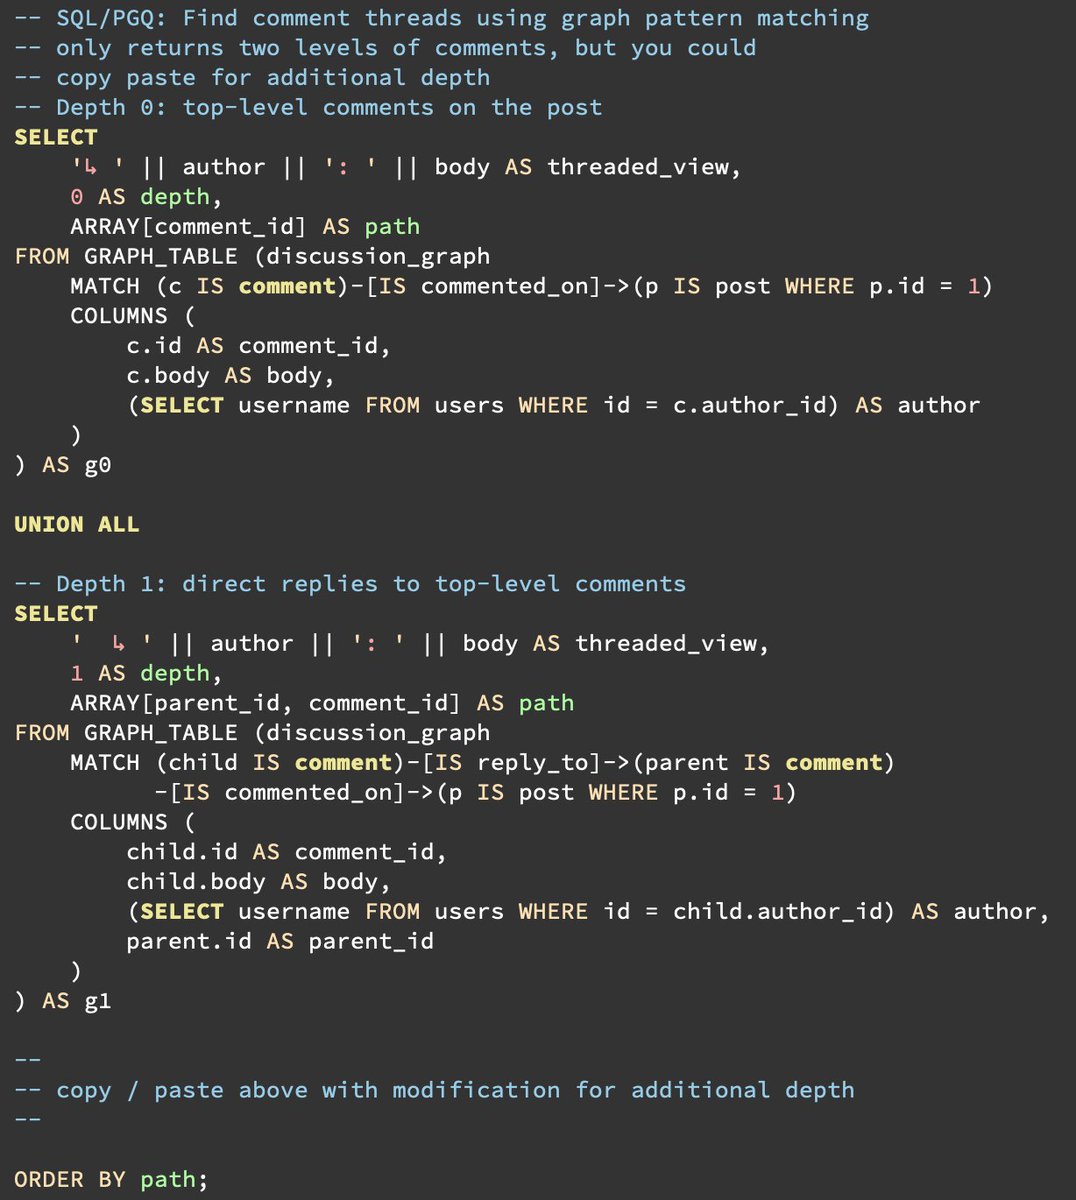
Graph queries in Postgres 19 are the start of a journey, not a destination.
Postgres takes a pragmatic, incremental approach to adding functionality. For instance, way back in 2012, Postgres added its first JSON support. @craigkerstiens declared "we cheated" because it was just a text field with JSON validation layered on top of it. Two years later, JSONB was launched. New releases continue to add additional indexing capabilities and operators. Now, both JSON and JSONB have their place.
We expect Postgres 19's SQL/PGQ implementation to be similar. The initial release probably won't replace much workflow. It is limited to fixed-depth queries, which is already quite easy with current SQL implementations.
But, you have to start somewhere!
What is implemented?
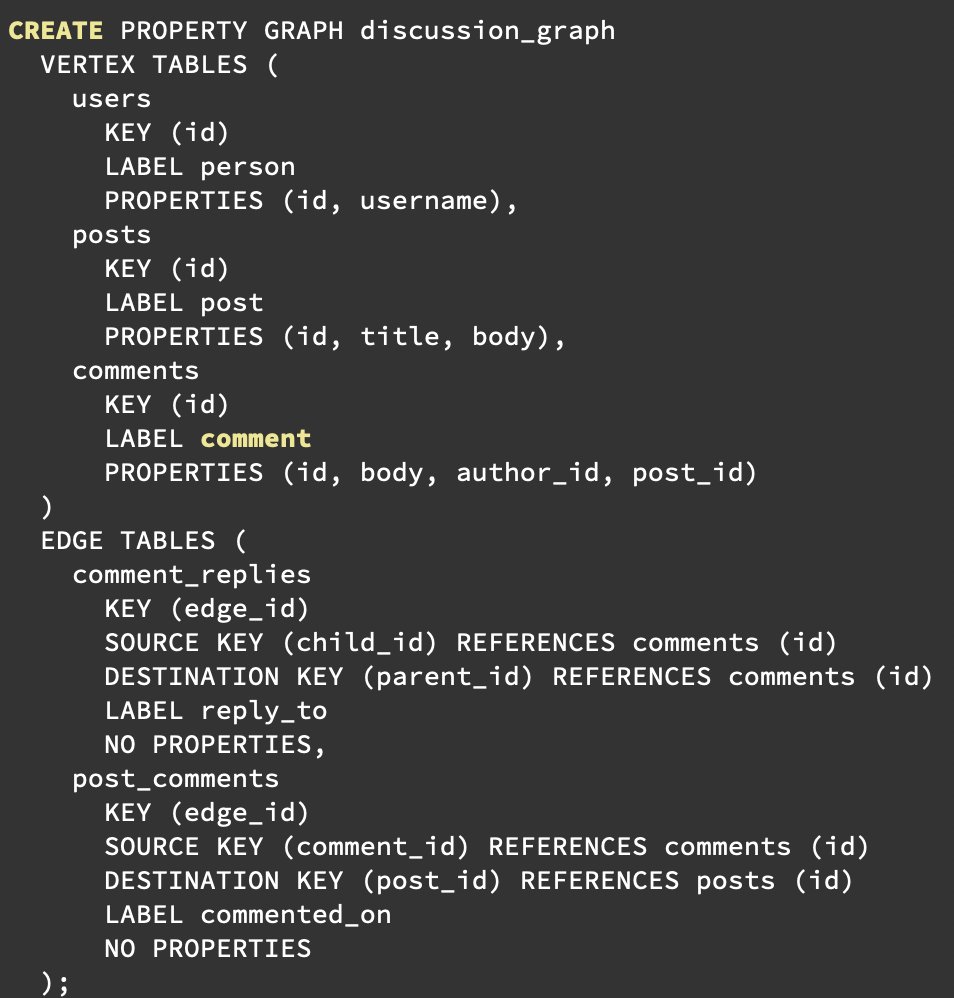
DDL definition: a graph is declared and named. `CREATE PROPERTY GRAPH org_graph` declares which tables are vertices and edges, once. Queries can reference the graph by name. Schema changes propagate automatically, clear errors if a query references a vertex/edge that no longer exists, and no dropping tables with associated graphs.
Ever written a large CTE query that no fails due to a schema change? Yeah, me, either.
Query syntax: query syntax that follows SQL:2023 standards. For instance, `(a)<-[IS reports_to]-(b)` means b reports to a.
You get the standard composability of SQL because GRAPH_TABLE behaves as a table. So, join it, filter it, aggregate it, put it in a CTE, and think of GRAPH_TABLE as a new FROM clause source.
The question answered with this implementation is: "What is the least we can build that gets us started?" The answer appears to be DDL support and supported query syntax.
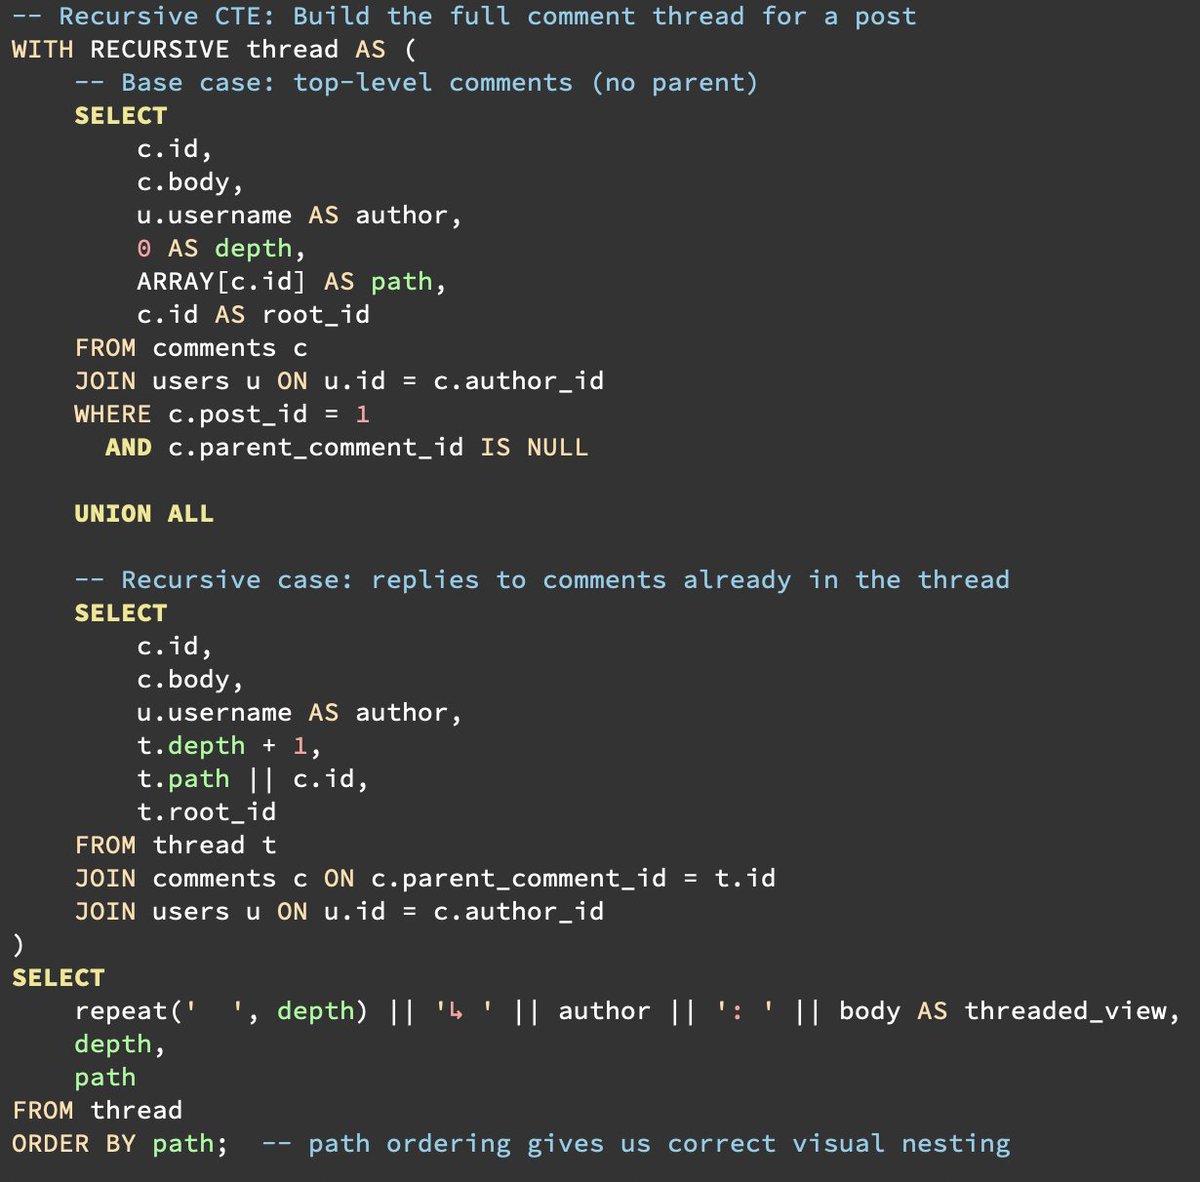
What SQL/PGQ can't do yet that recursive CTEs still do better:
Variable depth: if you need all descendants at any depth, SQL/PGQ in Postgres 19 is fixed-depth only. You must spell out each hop explicitly, which means you need to know the max depth at the time you write the query, which means the query can get lengthy.
Aggregation along the path: CTEs can build up arrays, concatenate paths, compute running totals as they recurse.
The future:
As with JSON support, just wait, and you'll look up after a few releases and say "oh, now it can do that too."
1
15
83
5,035
May 15
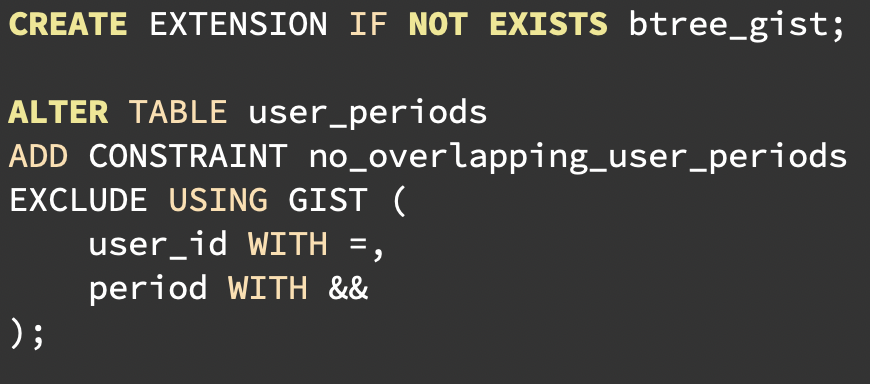
Postgres can prevent overlapping people, rooms, cars, equipment, books (etc) at the data level.
The `&&` operator matches range overlaps for numbers and date/times. To create a constraint, use an EXCLUDE constraint to prevent overlapping periods with matching user_id. Then, no user (or a room or a shift if you configure those) gets double-booked.
For performance, use a GiST constraint. And since we are combining an equal operator with a range comparison, use the btree_gist extension.
Why GiST?
B-tree only works with `<`, `=`, `>` (and combinations of these). It has no concept of overlapping range comparison? GiST (Generalized Search Tree) was built for ranges, geometries, full-text, etc.
Add the btree_gist extension to enable mixing of equality and range operators in the same constraint.
What to watch out for:
• GiST writes are heavier than B-tree. It is a simple-easy addition for moderate-to-large tables with moderate traffic. For tables with high update volume, plan for increased index maintenance; there are a few hacks out there to reduce required maintenance.
• Creating this constraint will require a table lock while it is building.
• If using table partitions, confirm your constraint works with your partitioning scheme.
That time I unintentionally built a calendar ...
Calendars are harder than they should be. They’re simultaneously a date storage problem, a timezone problem, a presentation problem, and a people problem.
One of our customers regularly moved between time zones for work and home and wanted the calendar to behave in a very specific way. Unfortunately, the software had been built to always display times based on the organization’s settings. This is just one example of how calendars test your ability to handle what feel like relatively simple trade-offs.
Pushing collision constraints into application code means relying on potentially multiple codebases to prevent double-booking. When you implement the same rule in the database, it becomes rigid. So you have to decide whether that level of strictness is what you actually want.
Most personal calendar apps are fairly permissive with overlaps and leave it to the user to manage double-booking. But imagine a service call instead: a technician literally cannot be in two places at the same time. In those cases, the data needs to be rigid. Software should prevent double-booking for resources that cannot possibly be used simultaneously.
When preventing double-booking, carefully work through the layers of constraints and trade-offs to decide whether the database should enforce it.
Calendars are messy enough already. Where possible, let the database limit the chaos.
9
59
2,787
May 14
Why do Postgres' extensions need to be built for specific major versions?
Postgres major releases intentionally evolve internal structs, function signatures, and memory layouts in the headers. These are modifications to the existing ABI (application binary interface). Postgres extensions rely on a stable ABI for binary compatibility with Postgres.
Postgres typically aims to maintain compatibility for extensions across minor versions. This means if you build an extension for Postgres 18.1, it should work for 18.2. However, this is not always the case. The nuances of Postgres ABI guarantees were a sufficiently hot topic that they produced new documentation on the subject back in July 2024: postgresql.org/docs/current/…
A major struct change occurred in a minor release of 17.1 which gave us insight into how expert extension developers juggle integrations with Postgres:
15 Nov 2024

On the PostgreSQL extension ABI issue in the latest patch release (17.1, 16.5, ...).
PostgreSQL extension C code includes header files from PostgreSQL itself. When the extension is compiled, functions from the headers are represented as abstract symbols in the binary. The symbols are linked to the actual implementations of the functions when the extension is loaded based on the function names. That way, an extension compiled against PostgreSQL 17.0 can usually still be loaded into PostgreSQL 17.1, as long as the function names and signatures from headers do not change (i.e. the application binary interface or "ABI" is stable).
The header files also declare structs that are passed to functions (as pointers). Strictly speaking, the struct definitions are also part of the ABI, but there is more subtlety around that. After compilation, structs are mostly defined by their size and offsets of fields, so for instance a name change does not affect ABI (though does affect API). A size change does affect ABI, a little.
Most of the time, PostgreSQL allocates structs on the heap using a macro that looks the compile-time size of the struct ("makeNode") and initializes the bytes to 0. The discrepancy that arose in 17.1 is that a new boolean was added to the ResultRelInfo struct, which increased its size.
What happens next depends on who calls makeNode. If it's PostgreSQL 17.1 code, then it uses the new size. If it's an extension compiled against 17.0, then it uses the old size. When it calls a PostgreSQL function with a pointer to a block allocated using the old size, the PostgreSQL function still assumes the new size and may write past the allocated block.
That is in general quite problematic. It could lead to bytes being written into an unrelated section of memory, or the program crashing. When running tests, PostgreSQL has internal checks (asserts) to detect that situation and throw warnings.
However, PostgreSQL uses its own allocator which always rounds up the number of bytes in its allocations to a power of 2. The ResultRelInfo struct was 376 bytes (on my laptop) so it would round up to 512, and this is still the case after the change (384 bytes on my laptop).
So, in general this particular change in the struct does not actually affect the allocation size. There may be uninitialized bytes, but that is usually resolved by calling InitResultRelInfo. The issue primarily causes warnings in tests / assert-enabled builds for extensions that allocate ResultRelInfo, though only when running those tests using the new PostgreSQL version with an extension binary that was compiled against the old PostgreSQL versions.
Unfortunately, that's not the end of the story. TimescaleDB is a heavy user of ResultRelInfo and does some things that do suffer from the size change. For instance, in one of its code paths, it needs to find the index of a ResultRelInfo pointer in an array, and to do so it does pointer math. This array was allocated by PostgreSQL (384 bytes), but the timescale binary assumes 376 bytes and the result is a nonsense number which then hits an assert failure or segmentation fault.
github.com/timescale/timesca…
The code here is not really at fault, but the contract with PostgreSQL was not quite as assumed. That's an interesting lesson for all of us.
It's quite possible that there are other issues like this in other extensions, though there not many extensions as advanced as Timescale. Another advanced extension is Citus, but I've done some validation and Citus looks safe to me. It does exhibit the assert warnings.
Some caution is advised. The safest thing to do is to make sure extensions are compiled using the headers from the PostgreSQL version that you are running.
5
25
3,395
May 13
If you're still running Postgres 14, two important things to know:
1. The final community release is coming this November.
2. You're missing out on 5 years of major performance gains, new features, and stability improvements.
Major version upgrades require planning. Changes to page headers, tuple formats, and index optimizations mean you’ll need to rebuild indexes and data structures. Common paths include pg_dump/restore, pg_upgrade, or logical replication (with its known limitations). Not to brag, if you are on Crunchy Bridge, it's just a button click.
Functions and extensions can also behave differently, so proper behavioral validation is essential, especially for critical systems, so don't just YOLO it.
That said, it’s not something to fear. The performance and reliability improvements in newer versions will make your life (and your queries) noticeably better.
1
4
20
1,802
May 13
For more reading: Examining Postgres Upgrades with pg_upgrade
crunchydata.com/blog/examini…
1
1
308
May 8
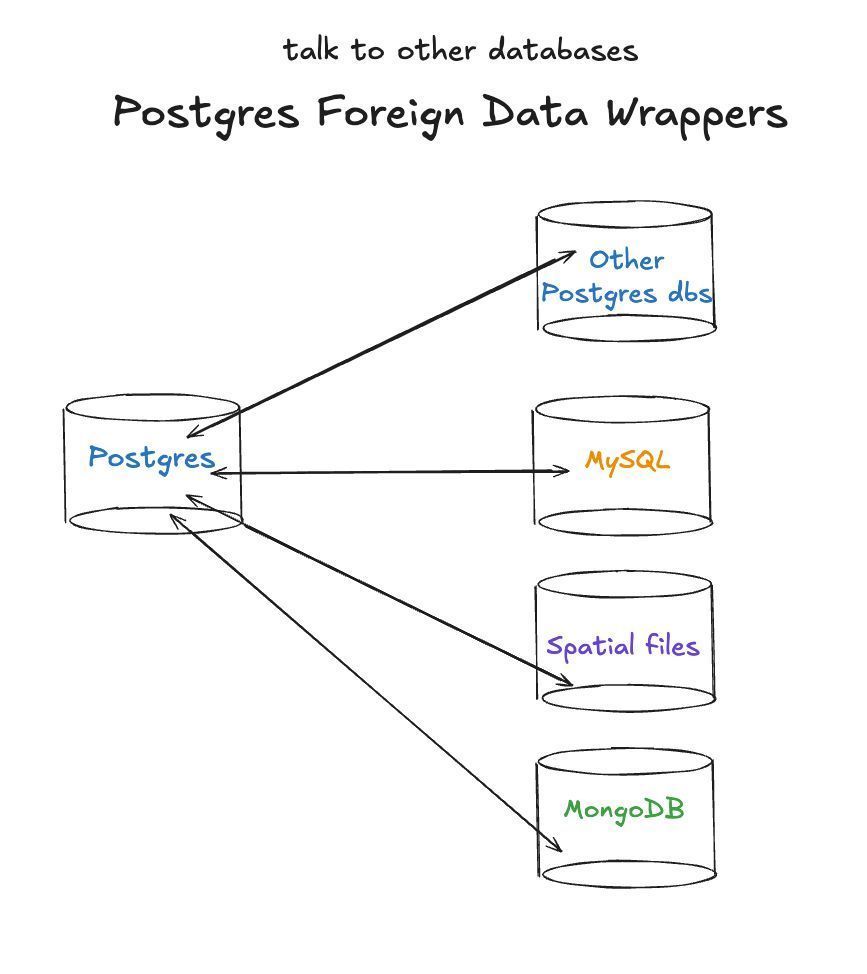
Postgres Foreign Data Wrappers (FDW) let you query remote DBs as local tables. We support FDWs to other Postgres dbs, Mongo, MySQL, Clickhouse, and even OGR spatial files. One query, multiple sources—no ETL required!
4
72
3,421
May 7
Monitor your Postgres replicas 📊
Monitor pg_stat_replication on the primary for real-time lag & sync states. On the standby, use pg_last_xact_replay_timestamp() to see exactly when the last commit hit.
1
9
825
May 6
Postgres I/O sawtooth spikes can stem from aggressive checkpoints settings. To stabilize latency - look at an increase to the checkpoint_timeout setting. Also look at checkpoint_completion_target = 0.9 to spread the I/O load.
3
13
797