
Where developers learn, build, and share. Your source for hands-on demos, cheat sheets, explainers and more.
Joined October 2009
- Tweets 10,371
- Following 183
- Followers 64,886
- Likes 3,583
3,875 Photos and videos


3 types of mappings in Elasticsearch
Dynamic: Elasticsearch detects field types as documents arrive.
Explicit: you define every field upfront. Recommended for production.
Runtime: schema-on-read, no reindexing needed.
Each trades setup speed for indexing control.
1
6
21
1,782
Stop building dummy data to test Elasticsearch.
Kibana ships three production-quality sample datasets. One click to install, dashboards included:
- Sample eCommerce orders: customer transactions, product categories, revenue by region
- Sample flight data: airline routes, ticket prices, delay metrics, geographic maps
- Sample web logs: HTTP requests, response codes, geoIP, error rates
Each one comes with pre-built visualizations and a full dashboard out of the box.
Open Kibana, go to Integrations, search Sample Data, click Install.
Real data. Real dashboards. No setup required.
2
6
15
2,146
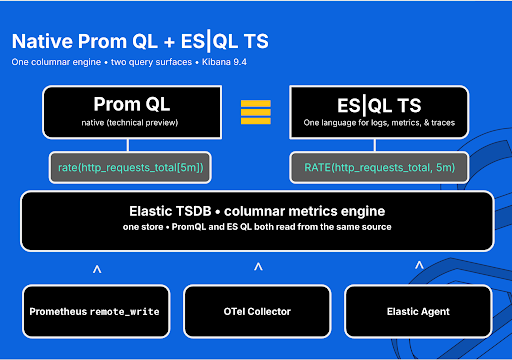
🧵 Your PromQL doesn't have to be rewritten to move to Elastic Observability.
9.4 added native Prometheus support.
Ship metrics straight to ES, run your existing PromQL in Kibana.
Same queries. Same dashboards.
rate(http_requests_total{job="api"}[5m])
That runs in Kibana now. No rewrite. Native PromQL is in technical preview.
1
3
13
1,533
When you want one language across logs, metrics, and traces, ES|QL's TS command is the direct equivalent.
TS metrics-*
| STATS SUM(RATE(http_requests_total, 5m)) BY job, TBUCKET(5m)
RATE(metric, 5m) maps to PromQL's rate(metric[5m]).
TS groups by time series first and handles counter resets
before you aggregate across hosts.
Keep your PromQL instance. Adopt ES|QL at your own pace.
Blog: go.es.io/4e9RJpq
ES|QL TS docs: go.es.io/4fMChRn
5
635
Learn how to cut Elasticsearch log storage by up to 76% with LogsDB:
1. Create a LogsDB index with "index.mode": "logsdb"
2. Reindex your logs into both a standard and LogsDB index
3. Force merge both indices with _forcemerge?max_num_segments=1
4. Measure the difference with the _stats API
In our test: 15.37 MB (standard) vs 8.6 MB (LogsDB). 44% reduction on test data. 76% in production benchmarks.
16
11
187
4,481,637
Follow along in the full tutorial: go.es.io/4e3NYBY
1
7
1,227
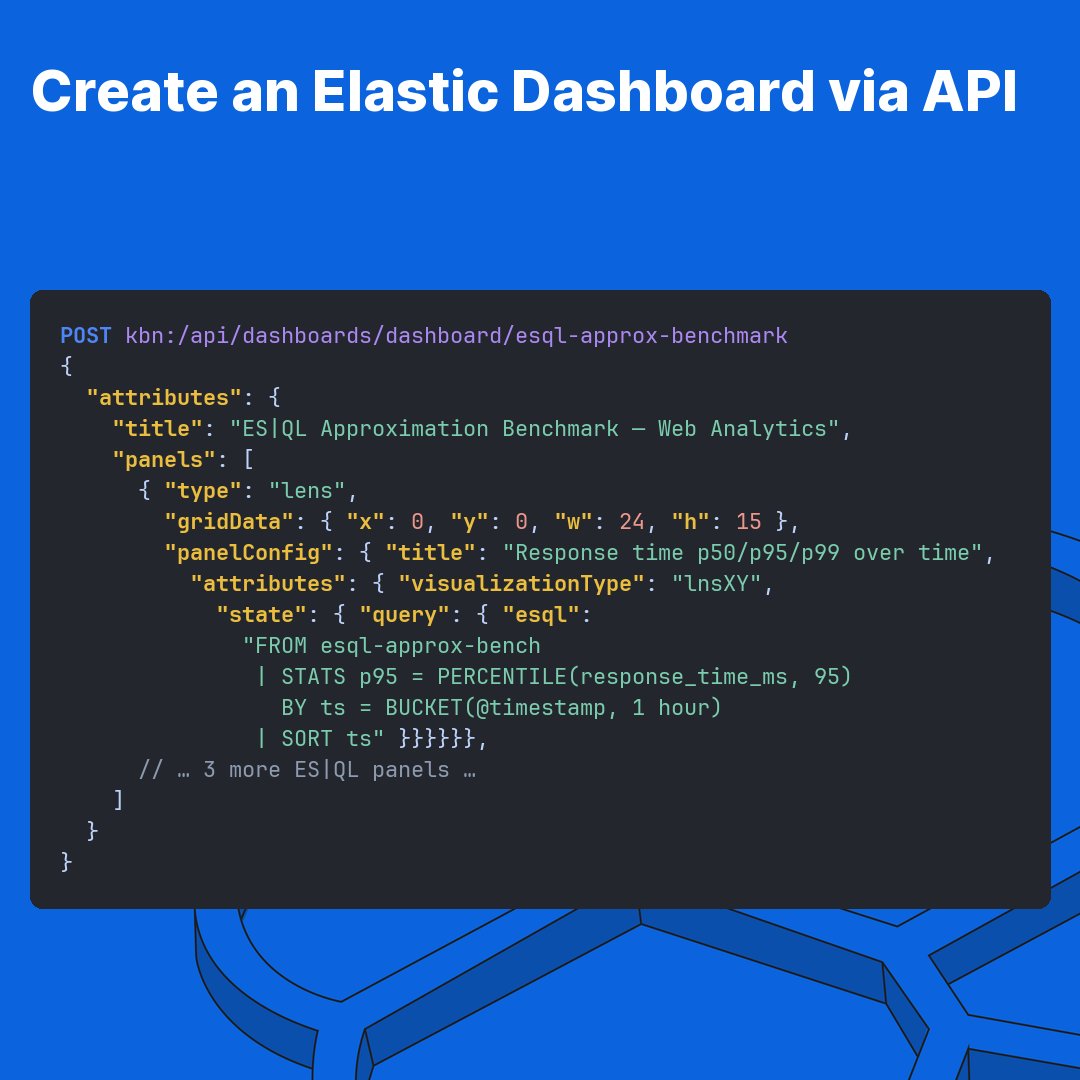
🧵 p95 latency tile in Kibana. 5 million events. Takes 296ms exact.
Add one line to the ES|QL pipeline:
SET approximation=true;
Same query. 110ms. Every result comes with a confidence interval.
Drop the interval (SET approximation={"confidence_level": null}) and it runs in 75ms. 0.16% error.
1
11
1,719
Good fit for the speculative query patterns LLM agents generate:
fast, approximate, cheap.
Won't approximate DISTINCT_COUNT, MIN, or MAX yet.
No support for TS, JOIN, or FORK pipelines. Falls back to exact.
Gist: go.es.io/4fbZdcH
Blog: go.es.io/4nUElst
4
983
🧵 Autocomplete has to be faster than regular search. That's the whole point.
If your latency is high, users stop seeing suggestions before they finish typing.
The approach you pick determines whether you hit that bar in production.
Here are 4 ways to build autocomplete in Elasticsearch. 🧵
(And how to avoid picking the wrong one.)
1
1
6
2,757
TL;DR:
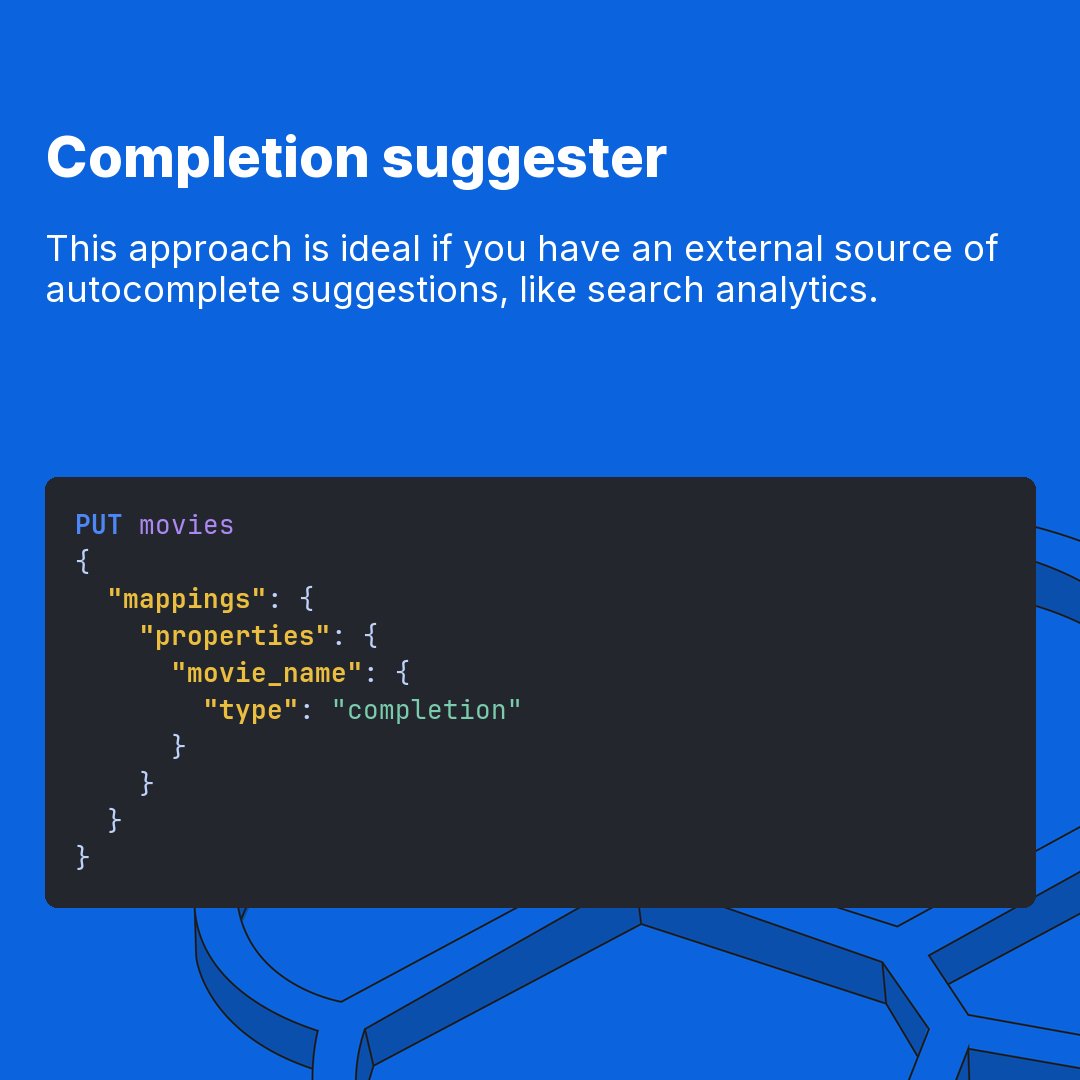
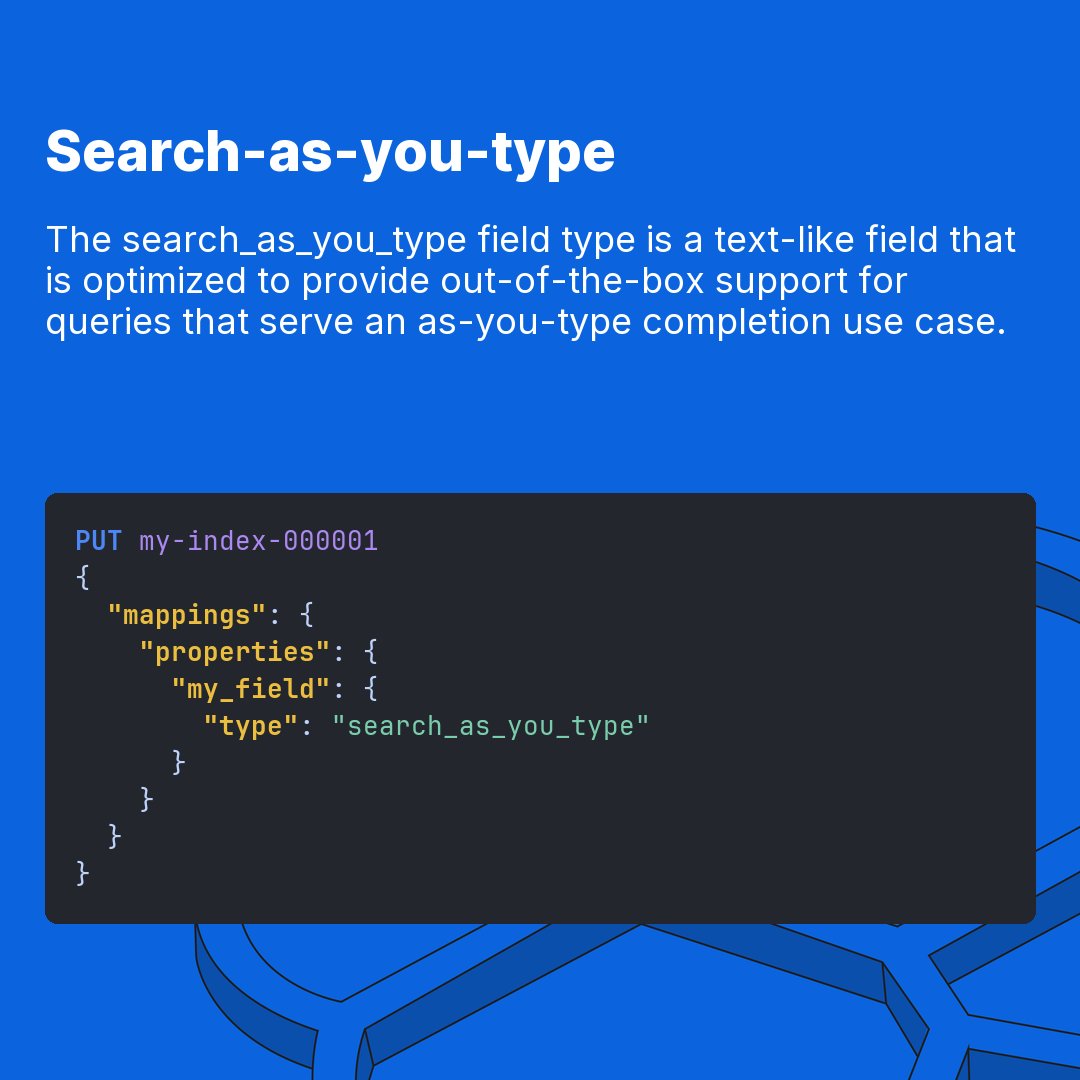
- 4 approaches: search-as-you-type, query time, completion suggester, index time
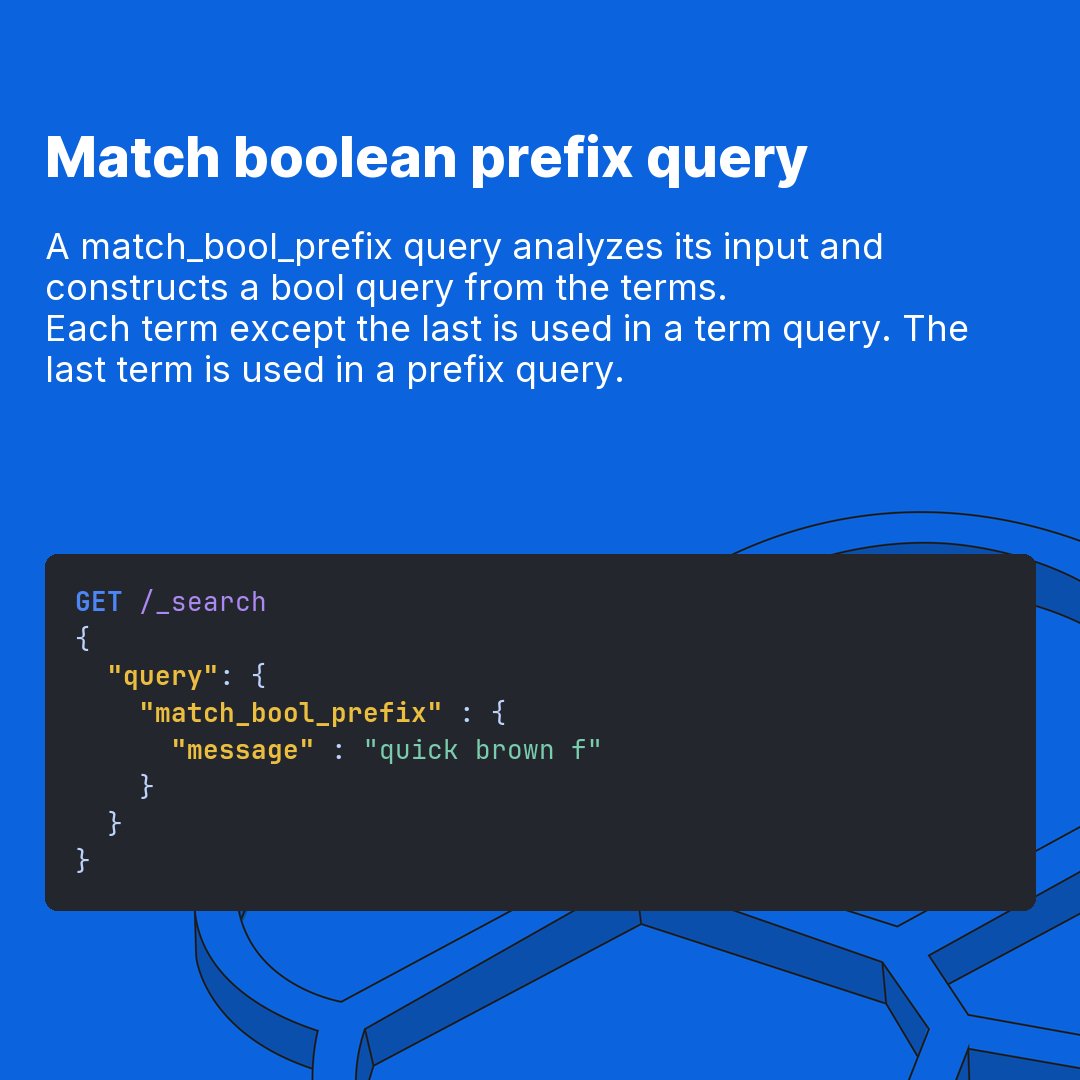
- match_bool_prefix is the underused middle ground for query time
- Empty prefix queries can bring down a cluster — always set a minimum character threshold
- Completion suggester is for query suggestions, not results
- Index time is fastest at query but costs more to store and operate
1
3
871
Full breakdown with code samples in the blog:
go.es.io/4x6wUmu
4
667