
Advanced trading community focused on market structure, liquidity, risk management, tools & execution improvement. We think, analyze & trade independently.
Joined February 2026
- Tweets 123
- Following 11
- Followers 3,447
- Likes 22
118 Photos and videos


Pinned Tweet

Mar 27
🚨 $1,000 GIVEAWAY — 10 x $100 🚨 $BTC
We’re building one of the fastest growing trading communities on X.
To enter:
• Follow @PARAGONDEN
• RT
• Comment “PARAGON”
• Tag 2 traders
We’ll pick 10 winners.
Serious traders only.
Join the community: discord.gg/paragon
2,833
1,783
1,685
145,326
$BTC The 1Y HODL Wave tracks the share of BTC that hasn't moved in over a year, and rising levels have often coincided with long-term conviction and lower selling pressure.
Despite recent price weakness, long-term holders continue to hold rather than distribute, suggesting accumulation remains intact and supporting the case for higher prices over time 📈
2
26
🎙️ The Paragon Stream Schedule Has Landed
No more guessing when the next stream is.
📅 Consistent sessions.
📈 Market breakdowns.
🎯 Trade reviews.
🧠 Live education.
All times below are UTC.
Join to watch the stream 👇
discord.gg/paragon
See you inside ⚡ $BTC
2
7
434
Jun 13
$BTC remains within the post-halving cycle window where previous bull markets have historically delivered their strongest gains.
Could price go lower? Absolutely. But the biggest risk may be waiting for a deeper discount that never comes.
1
9
341
Jun 12
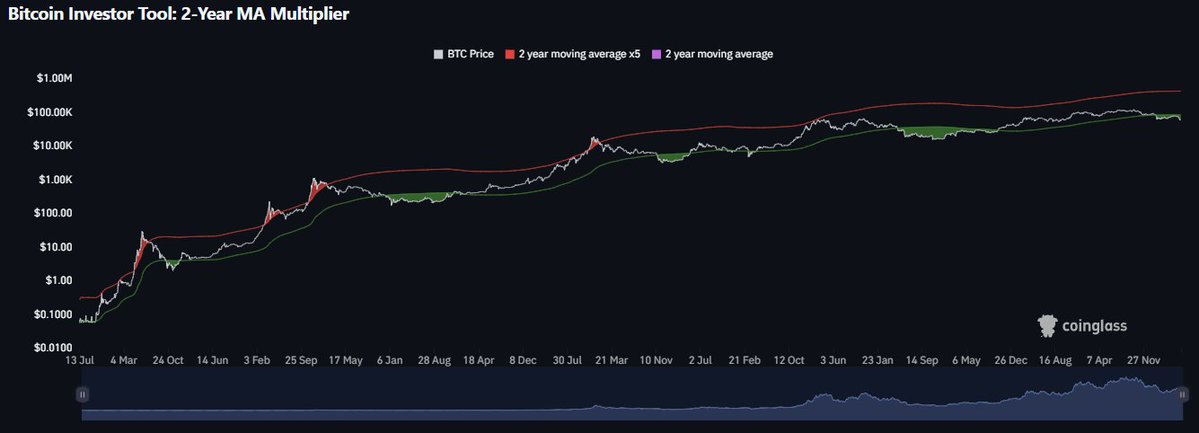
$BTC is trading near its 2-Year MA rather than the overheated zone near the 2-Year MA ×5 band 👀
Traditionally, risk/reward has been far more attractive near the green band than the red one, making this a region long-term investors often look to accumulate.
5
217
Jun 12
$BTC Coin Days Destroyed (CDD) remains surprisingly calm despite the recent drop. 📉
CDD tracks the movement of older coins, and major tops often see sharp spikes as long-term holders distribute. We're not seeing that.
For now, veteran holders appear to be sitting tight, suggesting the selloff isn't being driven by widespread long-term holder selling.
4
214
Jun 11
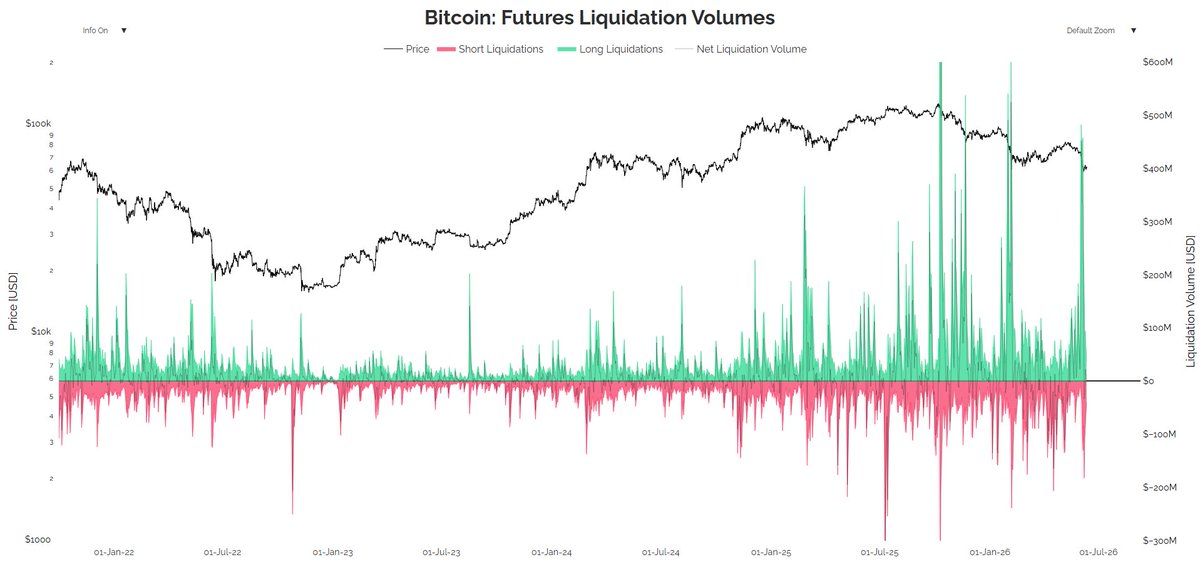
$BTC recently triggered a massive spike in long liquidations as the price once again took a sharp downward dive 👀
Over-leveraged buyers were aggressively flushed out by the sudden drop. This massive cascade clears the system of excessive speculative froth, typically paving the way for a cleaner local floor and a healthier future recovery.
1
3
201
Jun 11
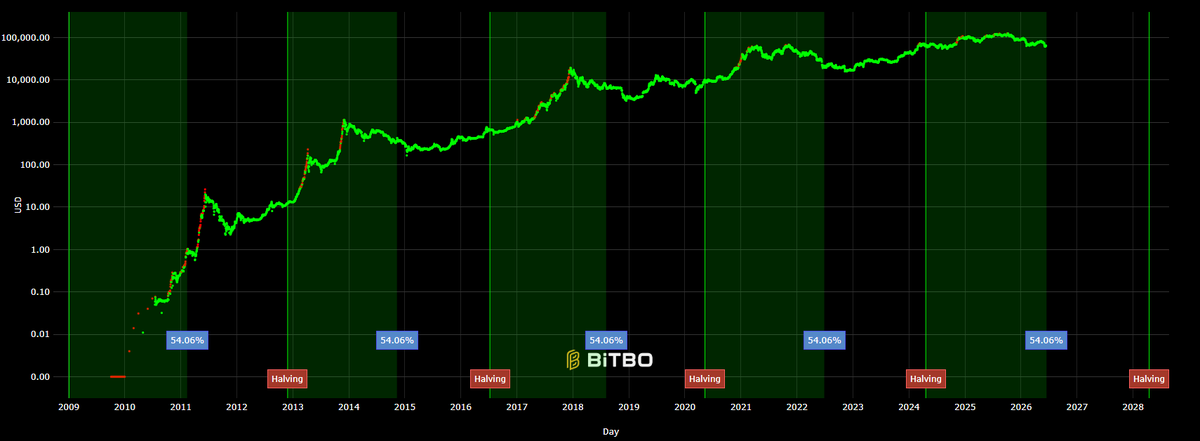
$BTC has now fallen below the Power Law Q5 band, a zone that has historically marked periods of deep undervaluation.
Previous visits to this area offered some of the best long-term buying opportunities of their respective cycles 📈
Not a timing signal, but from a historical valuation perspective, BTC is trading in a region where risk/reward has often been favourable.
6
302
Jun 10
$BTC CBBI continues to cool off alongside price, but remains far above the levels that marked previous bear market bottoms.
The index is a blend of multiple cycle indicators, so a falling CBBI suggests excess speculation is being worked off rather than a full cycle reset.
Current signal: momentum is weakening, not exhausted. A deeper correction or extended consolidation would be normal before the next major move 📉
2
208
Jun 10
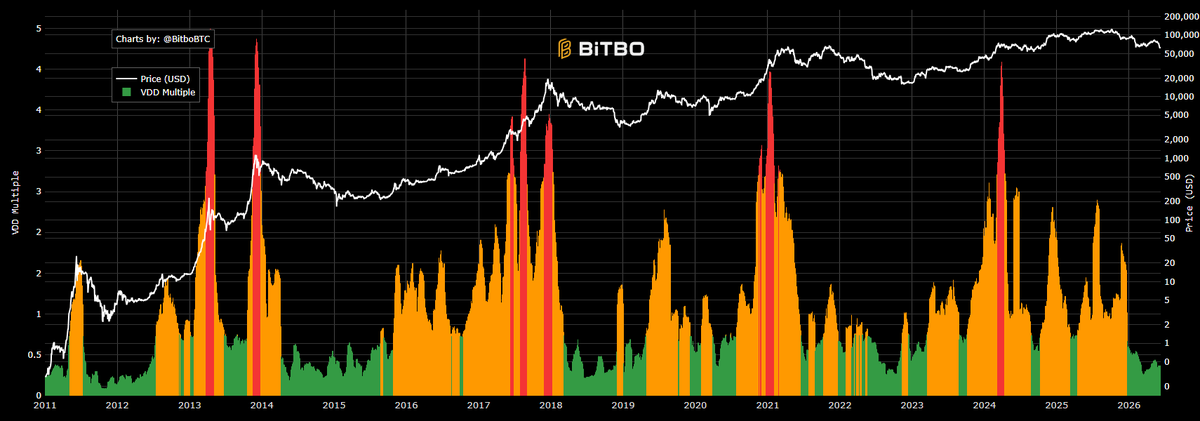
$BTC VDD Multiple remains in the lower historical range despite a sizable pullback.
Previous cycle tops were typically marked by aggressive VDD spikes as older coins moved and long-term holders took profits.
Current readings suggest distribution pressure remains relatively muted. Normally, these levels have been more favorable for accumulation than selling 📊
3
227
Jun 10
🔴 RAMI LIVESTREAM RECAP DROPPED 🔴
bitcoin:native
→ DCA bids mapped
→ Bullish count still intact
$ETH
→ Structure update
→ 10k macro target remains in play
Stocks & Commodities
→ Nvidia topping?
→ S&P correction ahead?
→ Brent crude final wave warning
Missed @ramihijazi stream? Catch the recap below 👇
youtu.be/QX_REXRAB9E?si=PBgs…
5
241
Jun 9
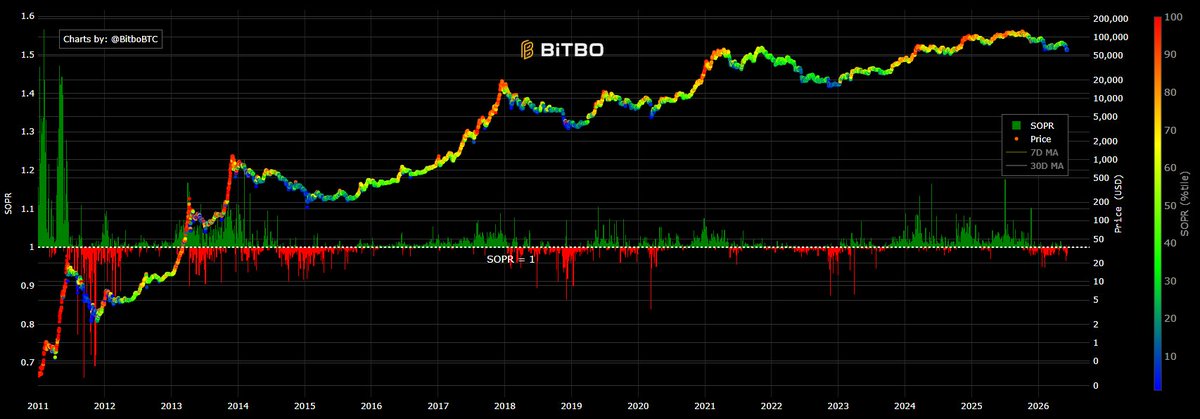
$BTC is undergoing a crucial network reset as the SOPR metric dips below the 1.0 break-even line ⚖️
The current pattern shows investors are actively cutting losses and panicking after the recent price drop.
Historically, this capitulation event is exactly what's needed to exhaust the sellers and lock in a firm macro floor.
5
232
Jun 9
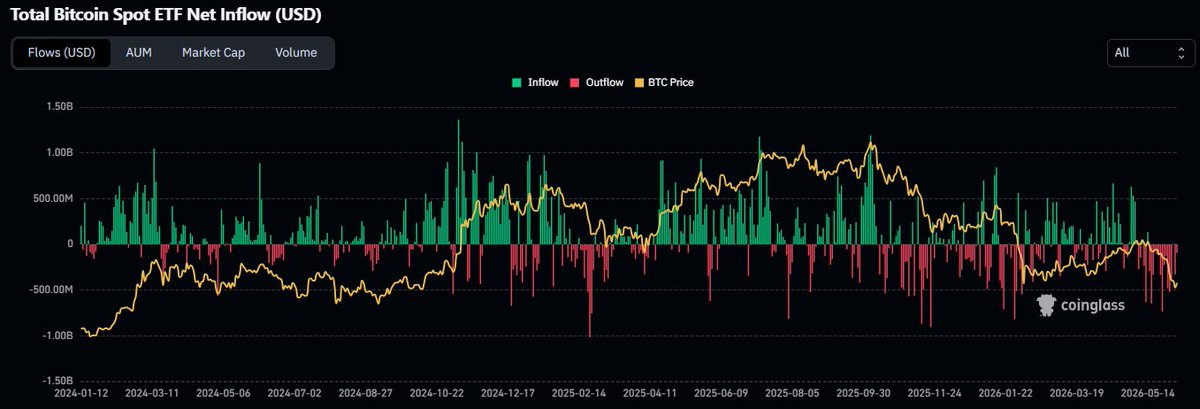
$BTC remains under pressure as Spot ETFs face a heavy wave of net outflows 💸
The steady stream of red bars through April and May 2026 is actively pulling the price line down. This institutional selling needs to dry up completely before a reliable macro floor can establish itself.
1
235
Jun 8
$BTC has bounced, but significant liquidity still sits below current price 🧲
The recent move may have relieved some immediate selling pressure, yet the larger liquidity pools beneath remain untouched.
A revisit toward those levels wouldn't be unusual before the market decides its next major direction.
8
331
Jun 8
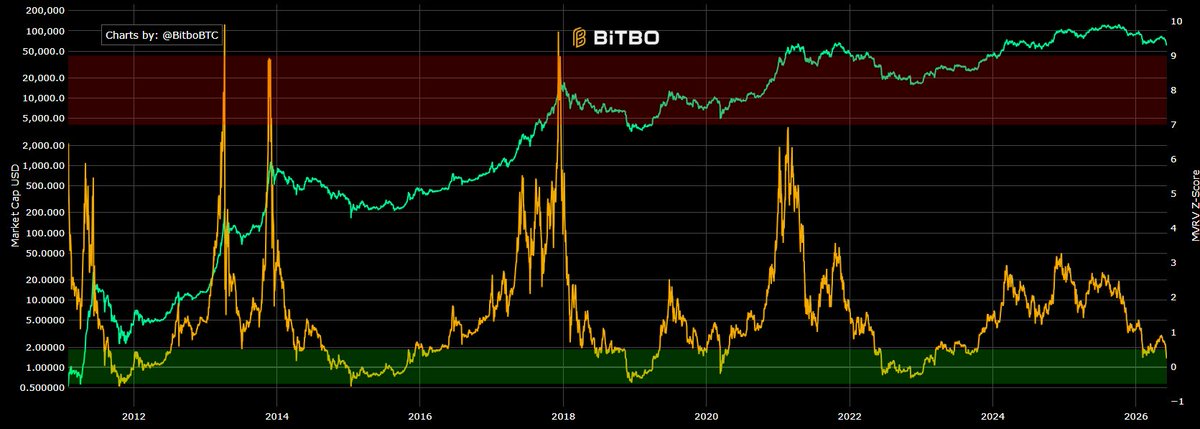
$BTC MVRV Z-Score is cooling back toward the lower end of its range 👀
Historically, the best long-term setups have formed after this metric resets from elevated levels, not while it is stretched.
If it stabilizes here, this is the kind of zone that has often preceded stronger future upside.
1
5
290
Jun 8
🚨 THIS WEEK'S MACRO WATCHLIST 🚨
Markets are heading into a packed week of economic data releases that could bring volatility across risk assets.
📅 Tue 09 Jun
🏠 Existing Home Sales 15:00
📅 Wed 10 Jun
📊 Core Inflation Rate MoM 13:30
📈 Core Inflation Rate YoY 13:30
💵 Inflation Rate MoM (CPI) 13:30
🔥 Inflation Rate YoY (CPI) 13:30
📅 Thu 11 Jun
🏭 PPI MoM 13:30
📅 Fri 12 Jun
🧠 Michigan Consumer Sentiment (Preliminary) 15:00
⚠️ Wednesday's CPI data will likely be the biggest volatility event of the week.
Keep an eye on $BTC as inflation numbers and market expectations around rate cuts could drive major moves across crypto. 📉📈
Who's ready for a volatile week? 👀
1
2
236
Jun 7
$BTC Fear & Greed combines volatility, momentum, volume, social sentiment, and investor behaviour into a single score.
That score has been trending lower for months, showing optimism is steadily leaving the market 📉
Traditionally, major opportunities tend to appear after sentiment resets, not when greed is running hot.

2
5
256
Jun 7
$BTC Open Interest continues to unwind as price revisits key support.
Previous cycles show that major advances are rarely built on peak leverage. They tend to start after leverage is flushed, positioning is lighter, and weaker hands have been forced out.
The reset appears well underway 📊

1
7
286
Jun 6
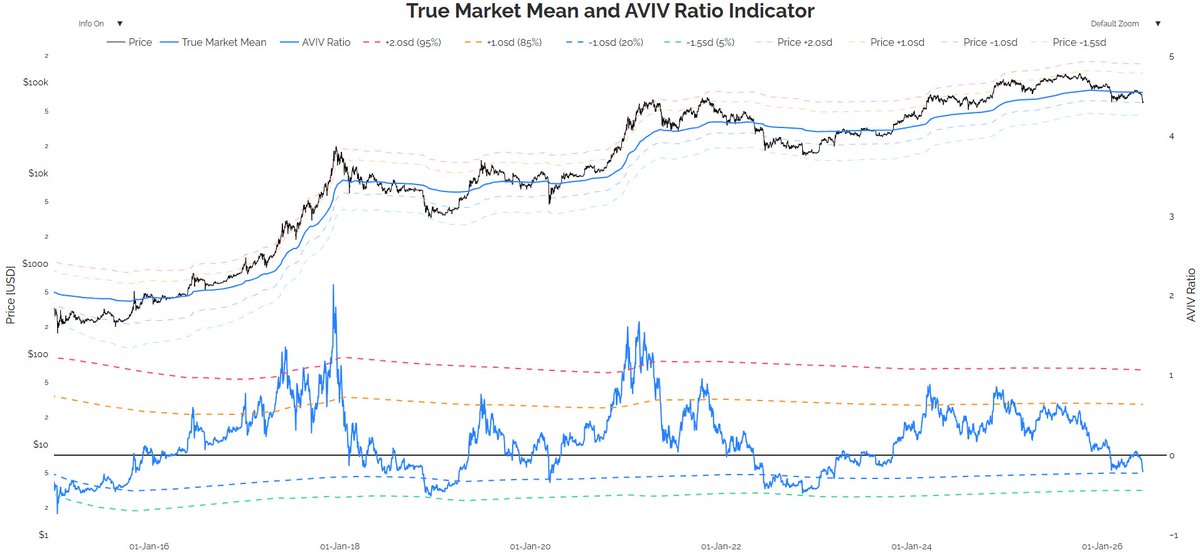
$BTC is approaching its True Market Mean, a level that has historically acted as strong support during major corrections 👀
Previous visits to this area have often marked periods where long-term investors began accumulating. Not a guarantee of a bottom, but risk/reward is becoming far more attractive than it was near the highs.
1
6
277
Jun 6
$BTC Bitcoin's Daily RSI is approaching levels that have historically marked periods of exhaustion for sellers.
That doesn't guarantee a bottom, but when RSI reaches these zones, downside often becomes more limited while the probability of a relief bounce starts to increase 📊
8
354