
Share, create, and explore @Tableau data visualizations for free on Tableau Public. For more inspiration, view our #VizOfTheDay and connect with our #DataFam ❤️
Joined March 2012
- Tweets 6,170
- Following 1,178
- Followers 70,933
- Likes 2,794
2,635 Photos and videos


Jun 12
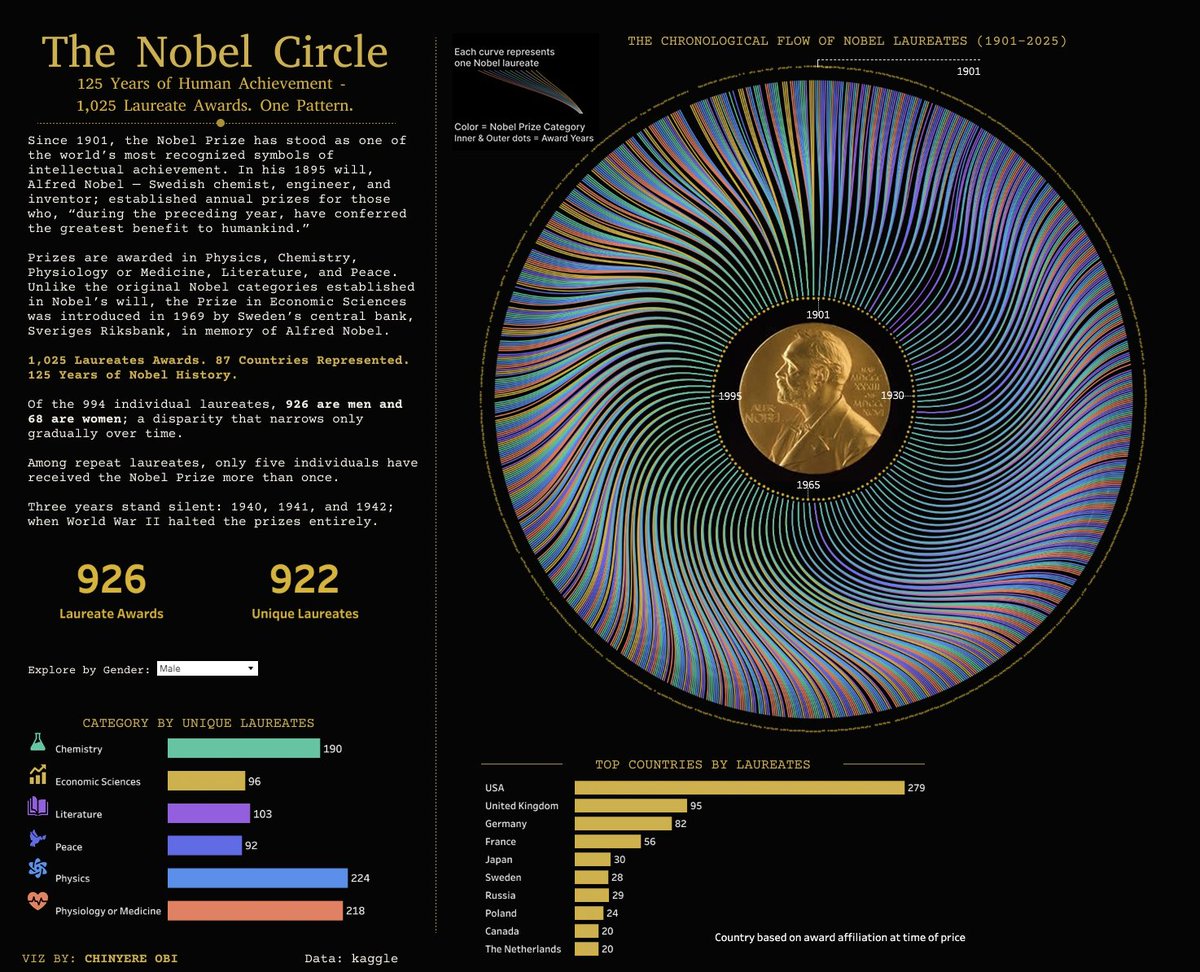
This #VizOfTheDay by Chinyere Obi maps 125 years of Nobel Prize history through a custom Radial Sankey inspired by @_CJMayes where each curve represents a recipient and each color represents a prize category.
Explore the insights on Tableau Public: tabsoft.co/3S8ctW8
1
24
801
Jun 11
Explore this #VizOfTheDay by Kat Rocha, showcasing 10 creative ways to elevate your bar charts. Learn when to use each variation, when to avoid it, and how to build it yourself in Tableau. Inspired by @VizWizBI.
Check out the viz on Tableau Public: tabsoft.co/3S42oJN
1
14
753
Jun 10
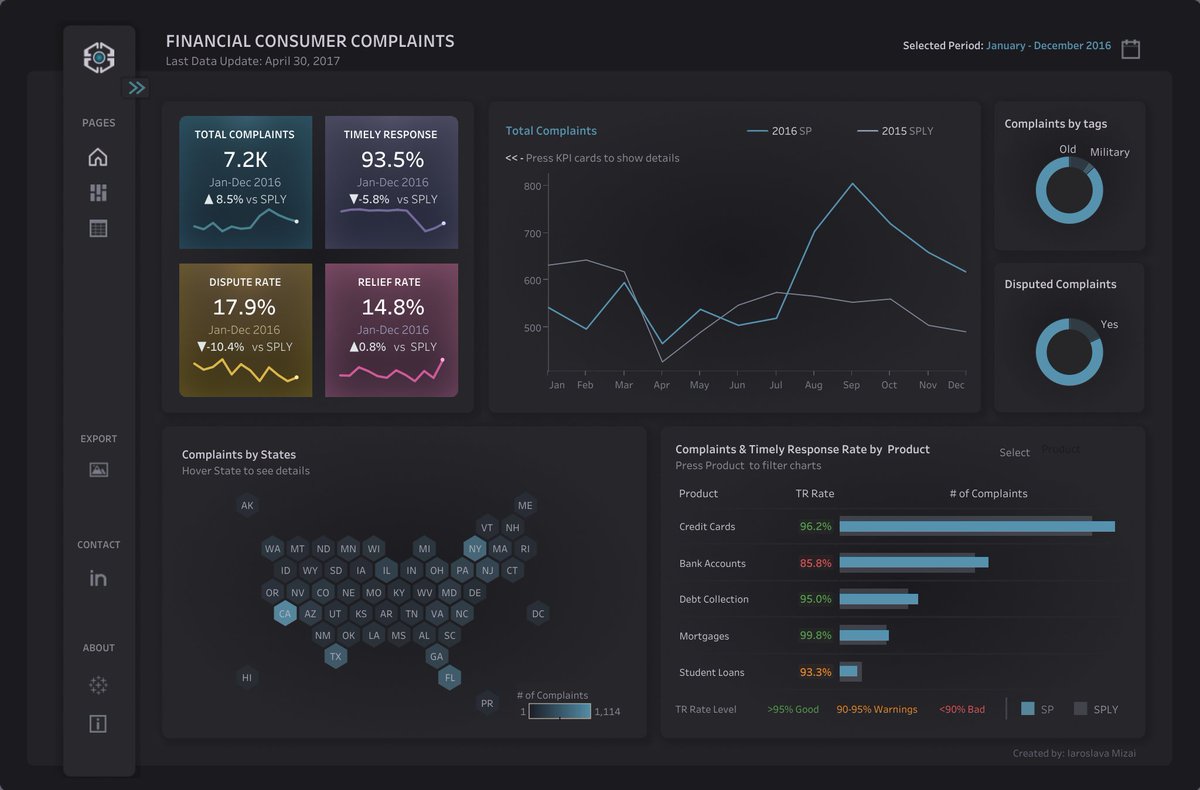
This #VizOfTheDay by Iaroslava Mizai monitors financial consumer complaints using the RWFD dataset.
It tracks timely response rates and dispute levels across products like credit cards and mortgages providing insights into service quality.
Explore the viz on Tableau Public: tabsoft.co/4dWyrE4
1
8
556
Jun 9
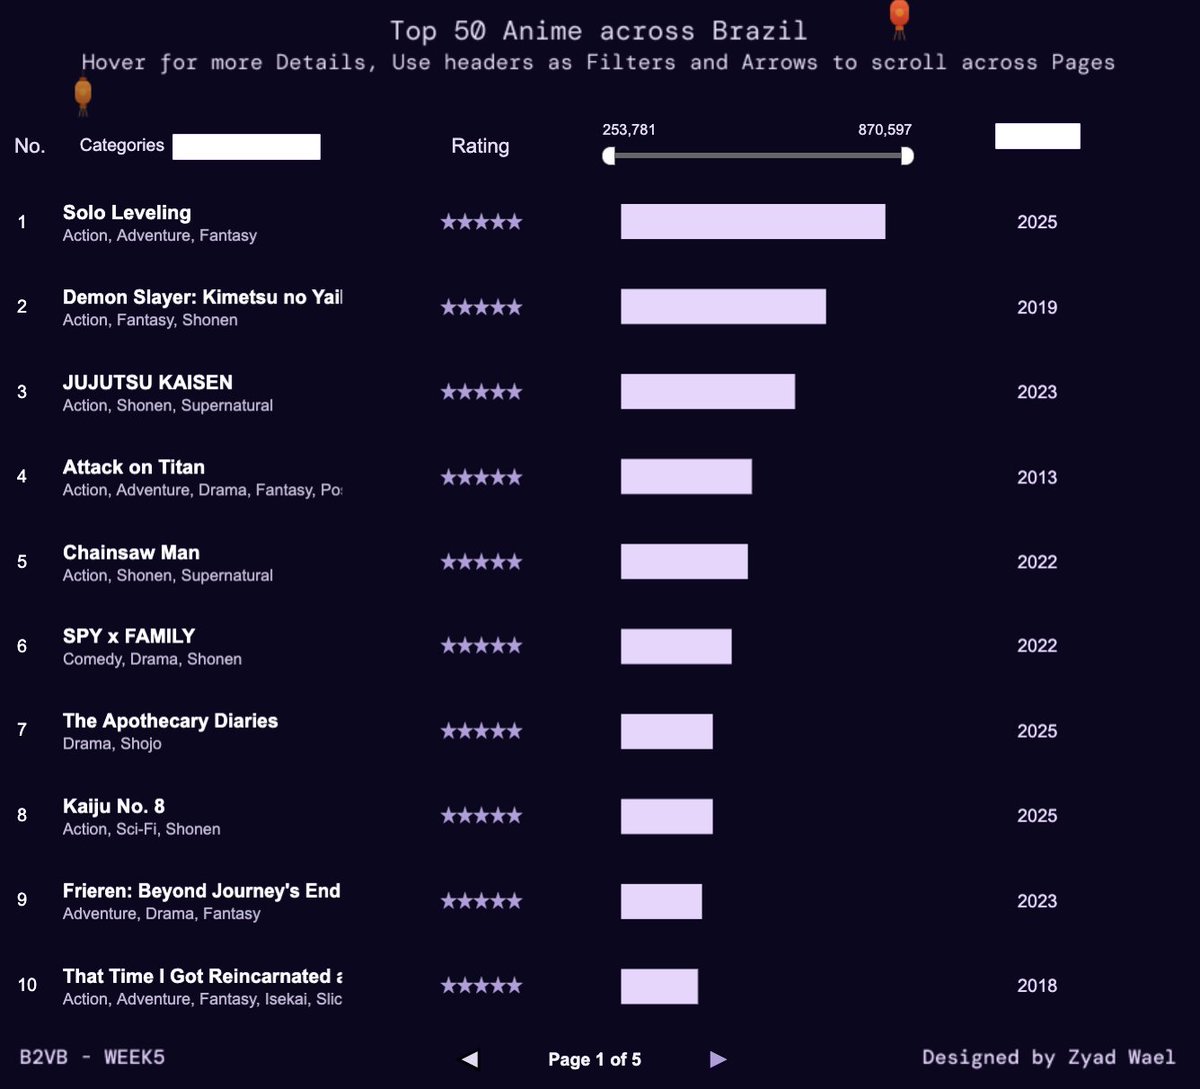
In this #VizOfTheDay, @i__godzilla visualized Crunchyroll's top 50 Anime across Brazil using ranked bar charts and interactive navigation.
Explore this #B2VB entry on Tableau Public: tabsoft.co/4oiu5dN
14
694
Jun 8
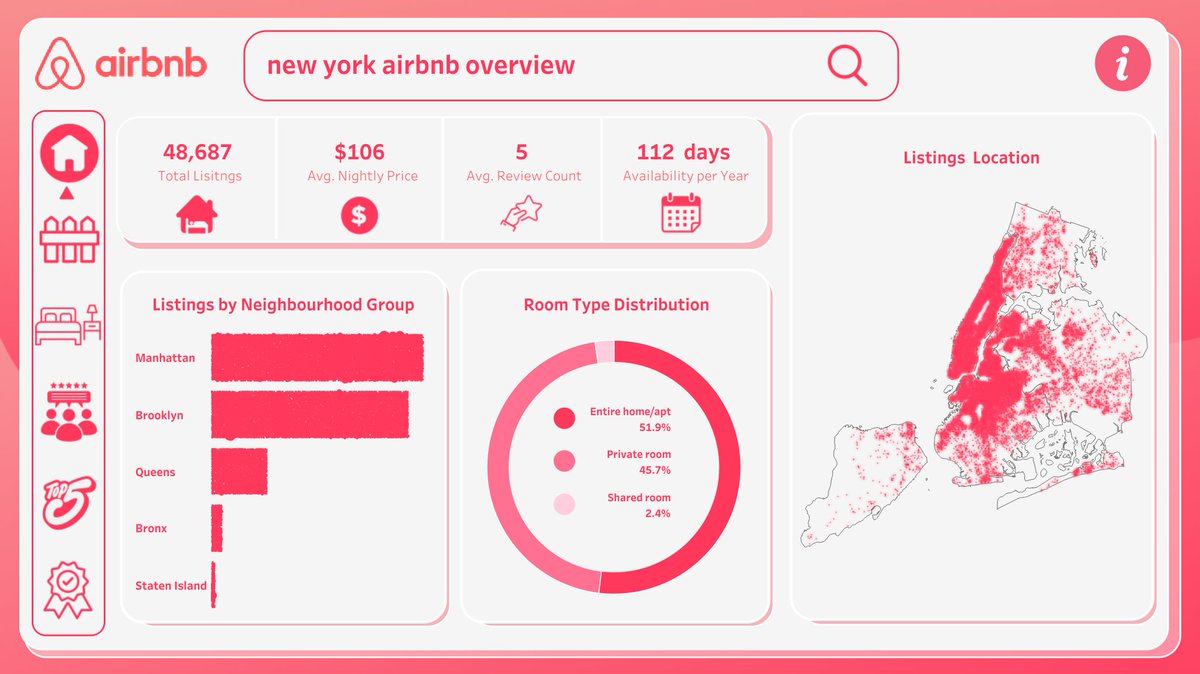
This #VizOfTheDay by Sahil Lodhi visualizes listings by neighborhood and room types. It includes personal recommendations and guest happiness scores to help travelers find the best stays in the city.
Explore the viz on Tableau Public: tabsoft.co/4un1Yfa
2
23
1,001
Jun 5
Explore this #VizOfTheDay by @KhennieNectar and @VizWithVictory featuring nine real-world KPIs across six industries to help users track, compare, and better understand business performance.
Check out the viz on Tableau Public: tabsoft.co/3RM2Tbq
1
2
22
1,027
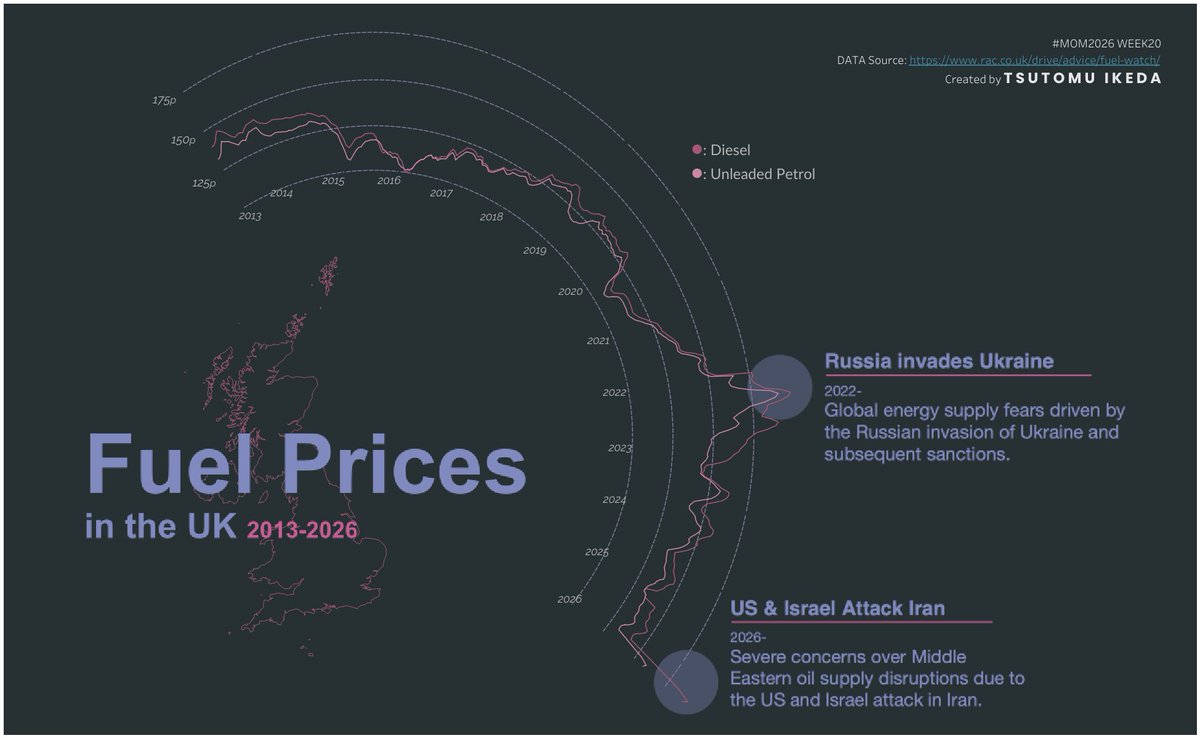
Jun 4
This #VizOfTheDay by @TIkeda93820944 uses a circular line chart to explore and show UK fuel price trends from 2013–2026 dynamically, highlighting the relationship between geopolitical shocks and energy costs.
Explore this #MakeoverMonday entry on Tableau Public: tabsoft.co/4dR6LAA
2
25
1,630
Jun 1
This #VizOfTheDay by @boknowsdata is a creative interactive resume built in Tableau. It visualizes his professional experience, technical skills, and extensive portfolio of work through a clean and engaging layout.
Explore the viz on Tableau Public: tabsoft.co/3PUnNnV
29
1,371
May 29
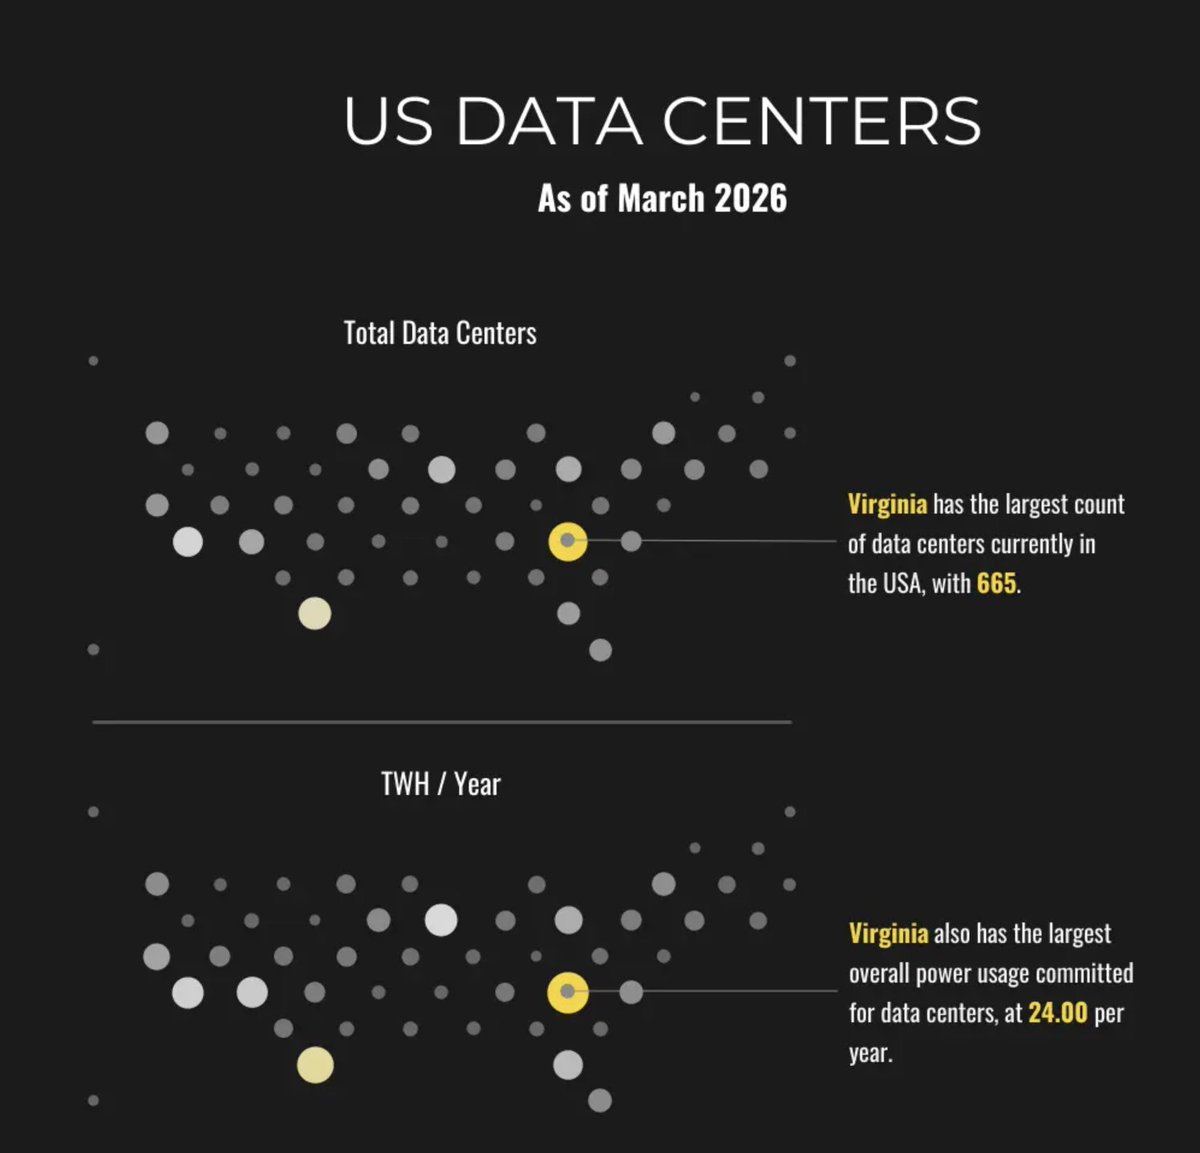
Explore this #VizOfTheDay by Matt Meier featuring map layers which analyzes U.S. data center concentration, power consumption, and operator investment commitments.
A #B2VB entry inspired by Blake Fieza. Check out the viz on Tableau Public: tabsoft.co/43CDhQI
4
22
1,203
May 28
In this #VizOfTheDay by @pyonpyon_tab, explore the evolution of diamond-cut designs across centuries through a timeline featuring geometric silhouettes and historical sequencing.
Check out the viz on Tableau Public: tabsoft.co/4uAKnkx
2
10
52
5,431
May 27
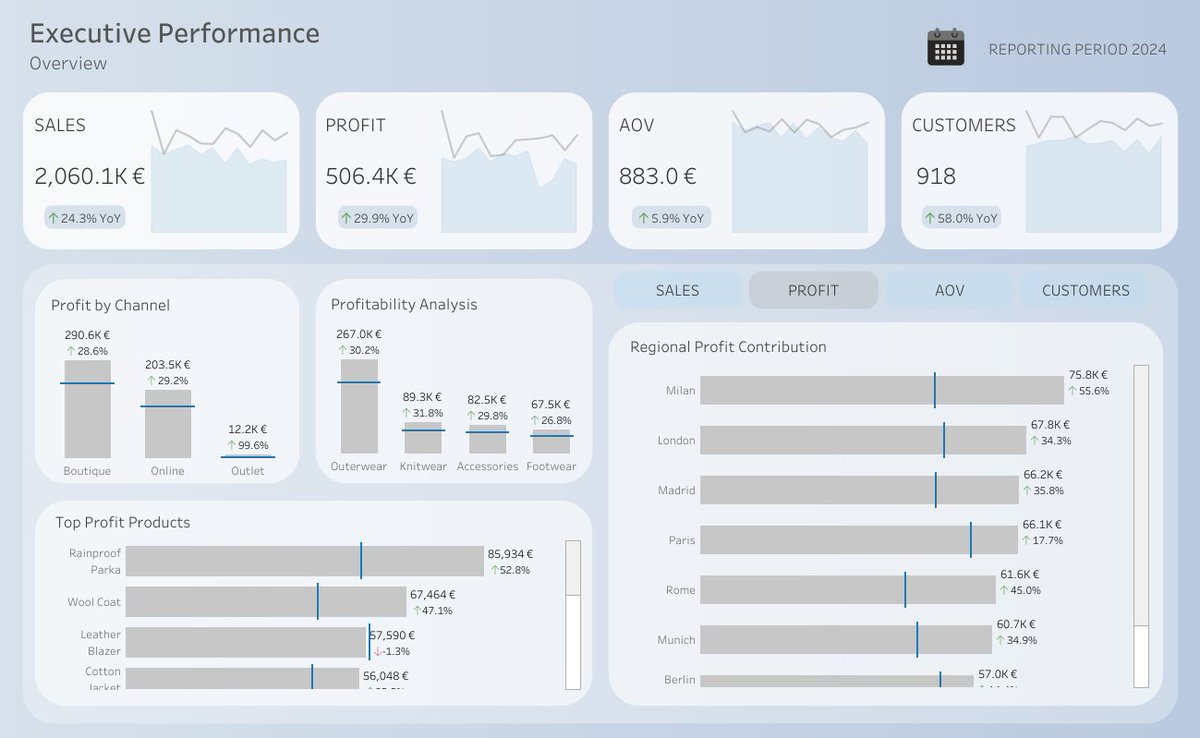
This #VizOfTheDay by Mykyta Loiko provides an Executive Performance Overview.
It tracks high level business health through KPIs such as total revenue, gross profit, and customer growth trends across various regions and time periods.
Explore the viz on Tableau Public: tabsoft.co/4vgextB
2
17
1,622
May 26
Explore this #VizOfTheDay by @pradeep_zen comparing the 15 highest and lowest occupations in the US that are likely to be displaced by AI using a 0–100 AI risk score from aiexposure.org submitted for a #MakeoverMonday challenge.
Check out the viz on Tableau Public: tabsoft.co/4veHbva
2
11
1,019
May 22
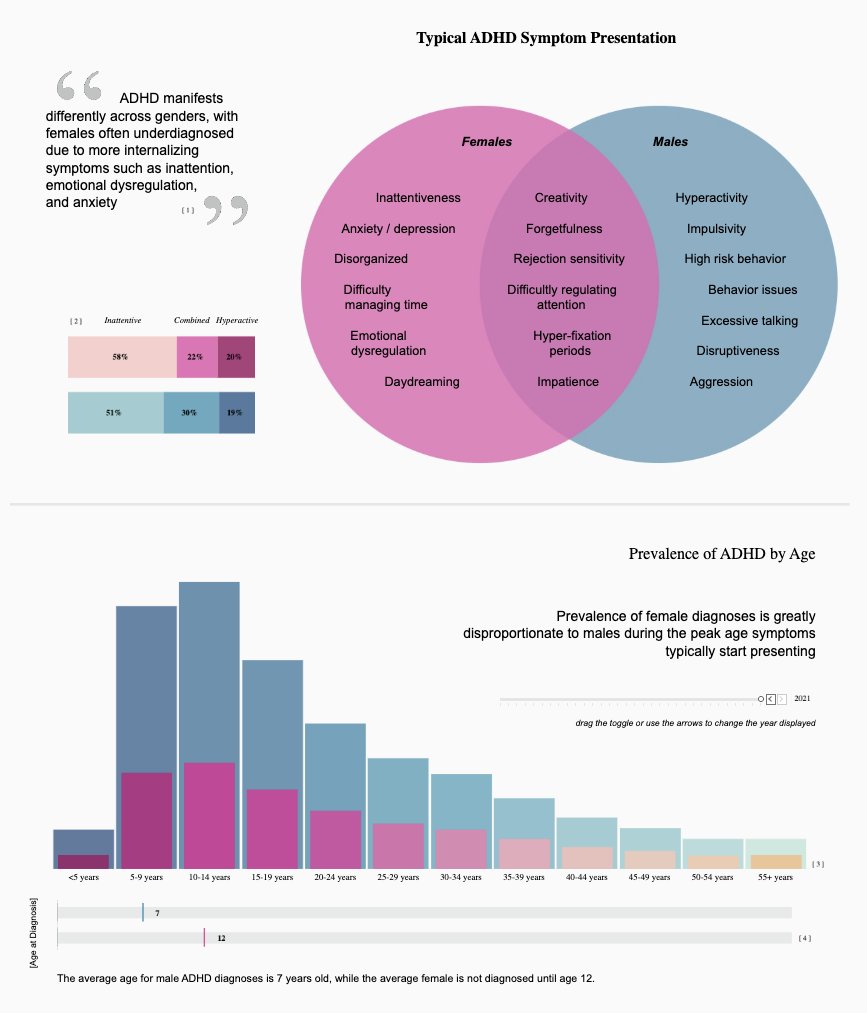
In honor of Mental Health Awareness Month, this #VizOfTheDay by Kelsey Oehrke uses a bar in bar chart, sunburst diagram, and more to highlight the complexity of the ADHD brain and gender differences in symptom presentation, diagnosis age, comorbidities, and prevalence.
Explore the viz on Tableau Public: tabsoft.co/43pFyP8
1
24
1,103
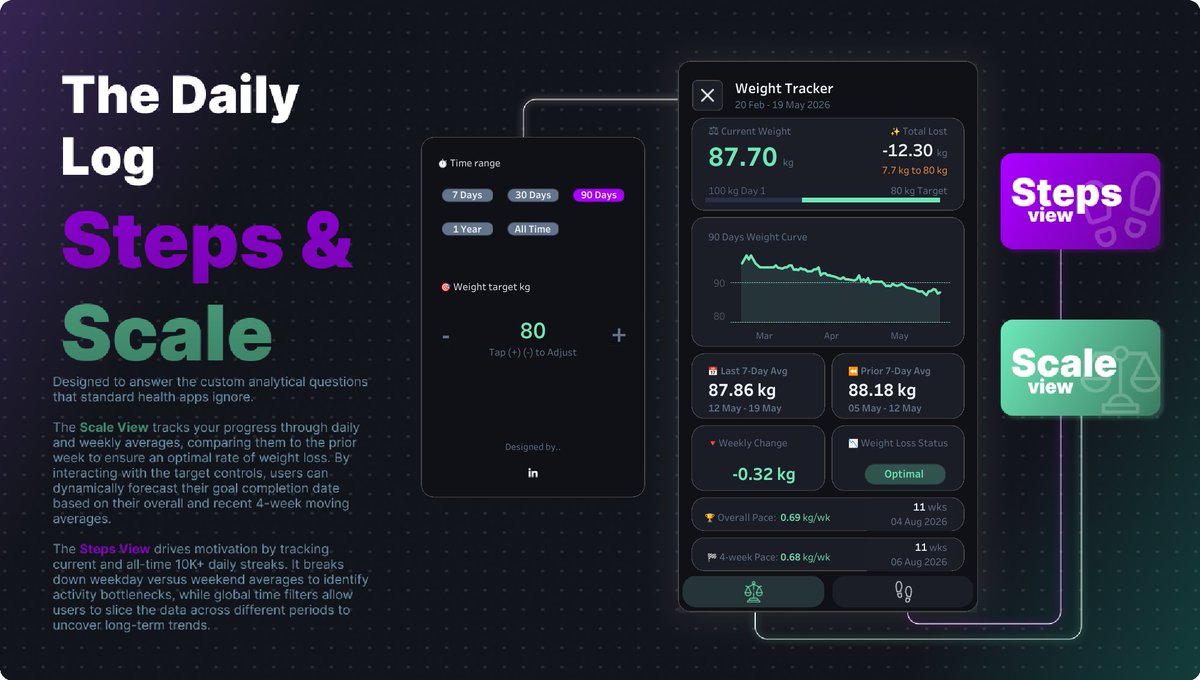
May 21
This #VizOfTheDay by Tawab Hussainy answers the custom analytical questions that standard health apps ignore, transforming step counts and weight data into a personalized view of habits, trends, and long-term progress.
Explore the viz on Tableau Public: tabsoft.co/4fiRUA3
2
11
1,018
May 20
This #VizOfTheDay by @VizzingAround features a Superstore Performance Dashboard with a modern UI and dynamic KPI colors.
It offers both dark and light mode themes along with clear breakdowns of sales by region, state, and category for deep business analysis.
Explore the viz on Tableau Public: tabsoft.co/4wHj61i

1
23
1,469
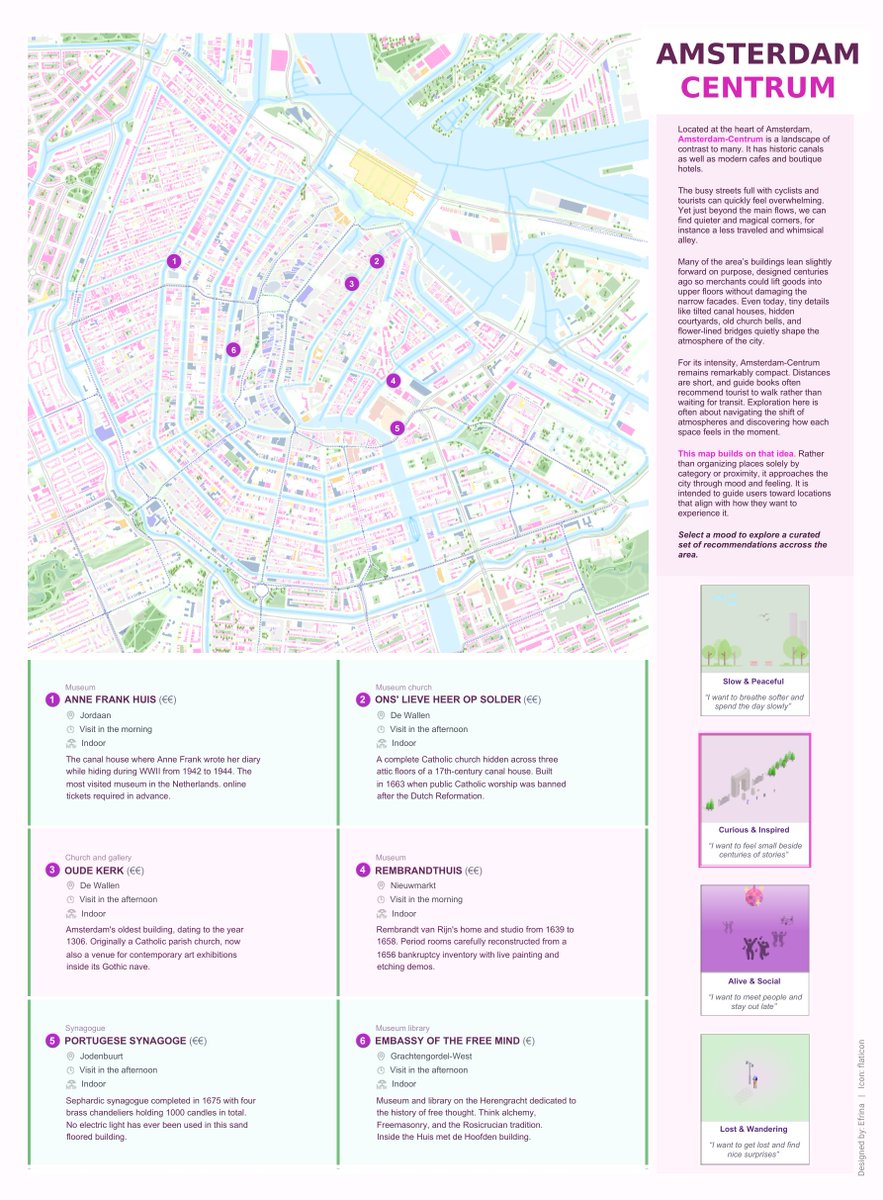
May 19
In this #VizOfTheDay, @polygonmap created a curated experiential map of Amsterdam-Centrum that guides visitors through moods and desired experiences.
Explore the viz on Tableau Public: tabsoft.co/42Nkvpw
1
18
1,165
May 18
This #VizOfTheDay by Michael McCusker showcases advanced design techniques using Tableau Map Layers. It demonstrates how to build highly custom layered visuals including interactive tables and infographics that go far beyond traditional mapping.
Explore the viz on Tableau Public: tabsoft.co/4wBHRw2

2
18
1,184
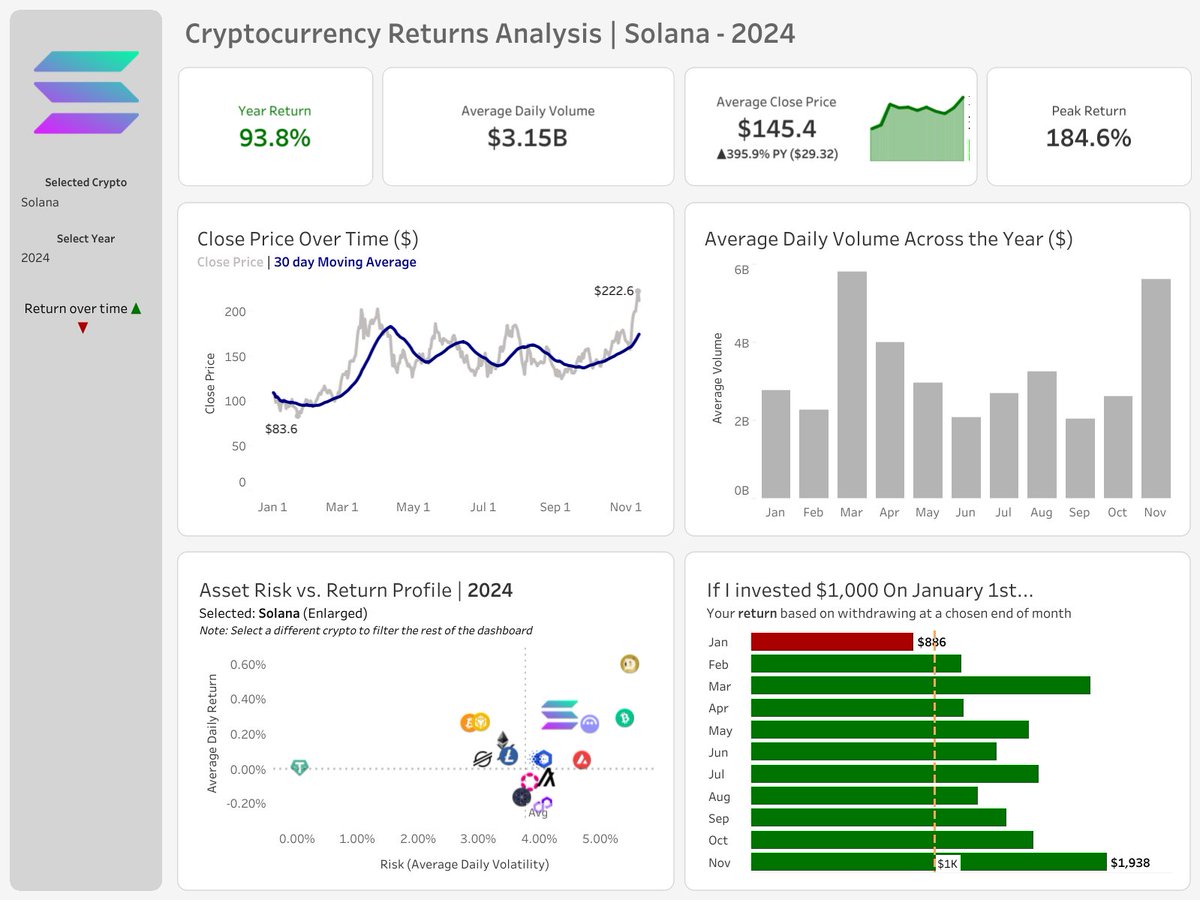
May 15
This #VizOfTheDay by Robin Jones provides a comprehensive cryptocurrency analysis from 2021 to 2024. It tracks price fluctuations, market trends, and trading volumes for major digital assets, offering insights into the volatility and growth of the crypto market over four years. Inspired by @VizWithVictory.
Explore the viz on Tableau Public: tabsoft.co/4nttXb4
17
878
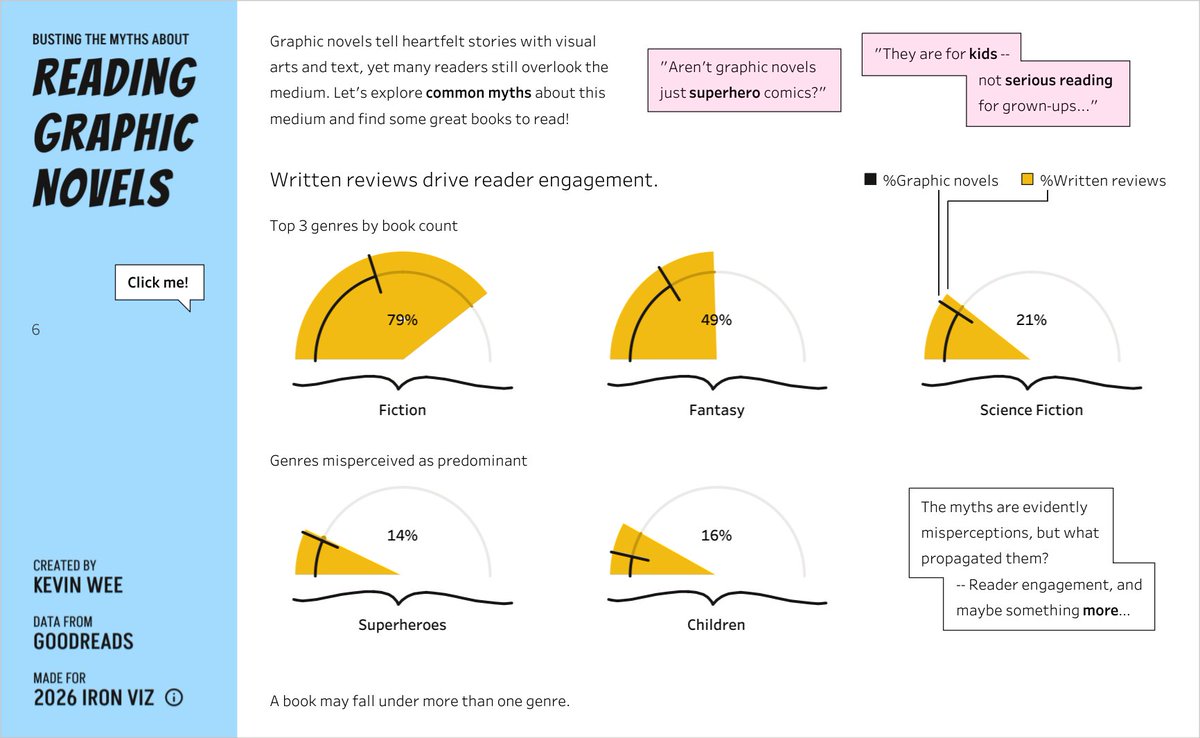
May 14
Explore this #VizOfTheDay and 2026 #IronViz championship dashboard by @KevinWee90, which debunks common myths about graphic novels and reveals how the medium has evolved into one of the most emotionally rich and culturally significant forms of modern storytelling.
Check out the viz on Tableau Public: tabsoft.co/4uTbTd3
4
32
1,007