
Tactical Macro Specialists. For more info on investor positioning, tactical asset allocation recommendations or to trial the research, email sales@vanda.com
Joined March 2013
- Tweets 511
- Following 958
- Followers 4,653
- Likes 99
376 Photos and videos


Pinned Tweet

12 Sep 2023
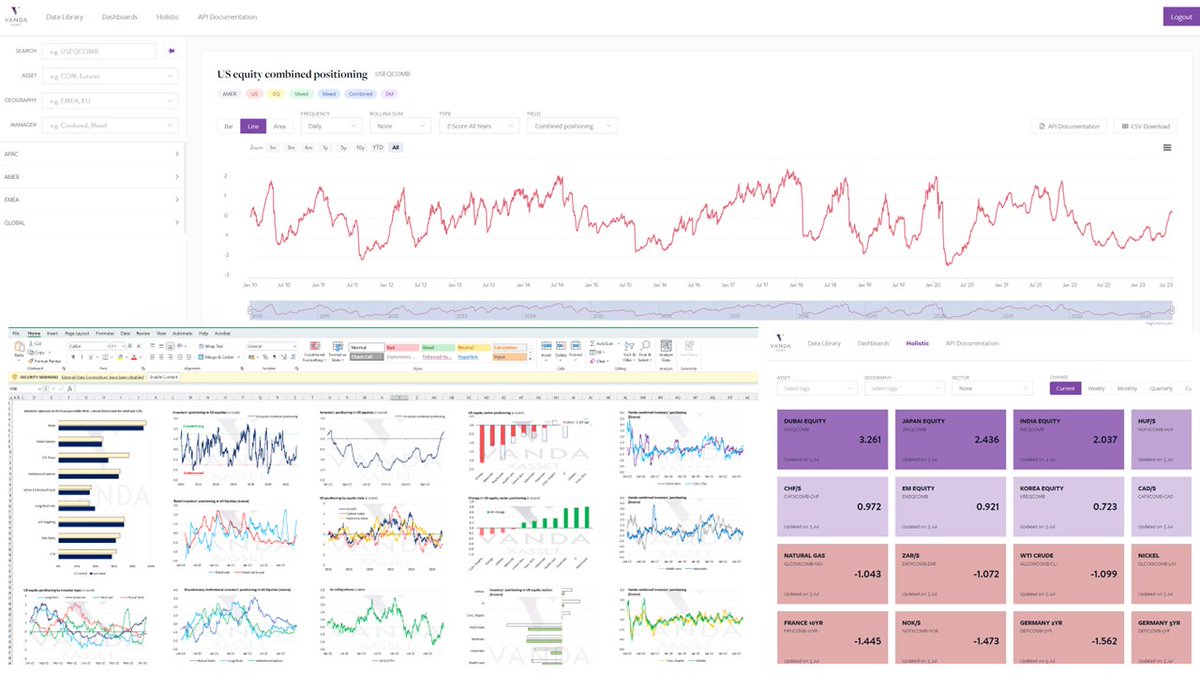
Introducing VandaXasset.
Unlock the power of over 1000 exclusive data sets fuelling Vanda's tactical macro research.
Seamlessly integrate our models into your software via Excel, REST API, AWS or SFTP.
Access global positioning insights effortlessly.
Contact Sales@vanda.com
1
2
14
9,978
19 Nov 2025
Everyone is watching NVDA earnings. Few are looking at the flow setup behind it. Our data shows retail has stepped back from single stock buying while institutions are holding one of the biggest NVDA call positions since 2022. This pattern often comes before major turning points.
1
17
3,772
14 Nov 2025
We said on Wednesday the shutdown wouldn’t clear the macro fog.
Now it’s confirmed: no October CPI, delayed labour data, and markets reassessing cuts.
In moments like this, having a clear framework matters. That’s what Vanda provides.
2
793
27 Oct 2025
Our whitepaper breaks down the signals behind market conviction: Positioning, Policy & Growth.
Get it first: sales@vanda.com
#VandaResearch #Macro #Positioning
1
649
20 Oct 2025
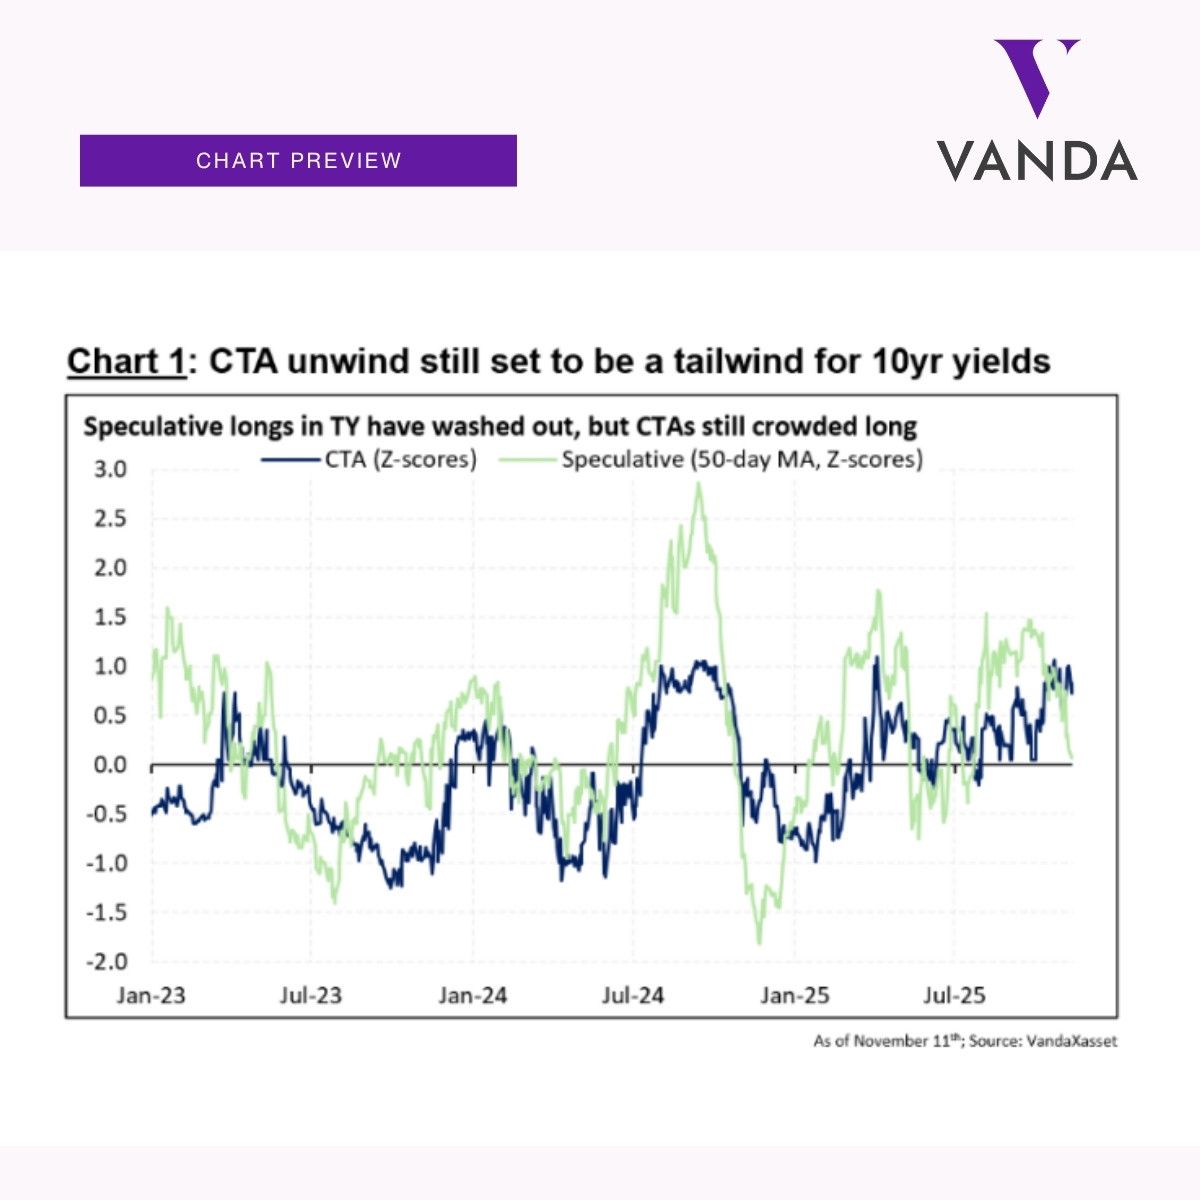
US equities didn’t fall because of a headline or a single bank charge-off.
They fell because positioning is crowded. When markets are this stretched, small shocks feel big.
Our models show room for more unwind systematic selling likely ramps into month-end.
9
10,076
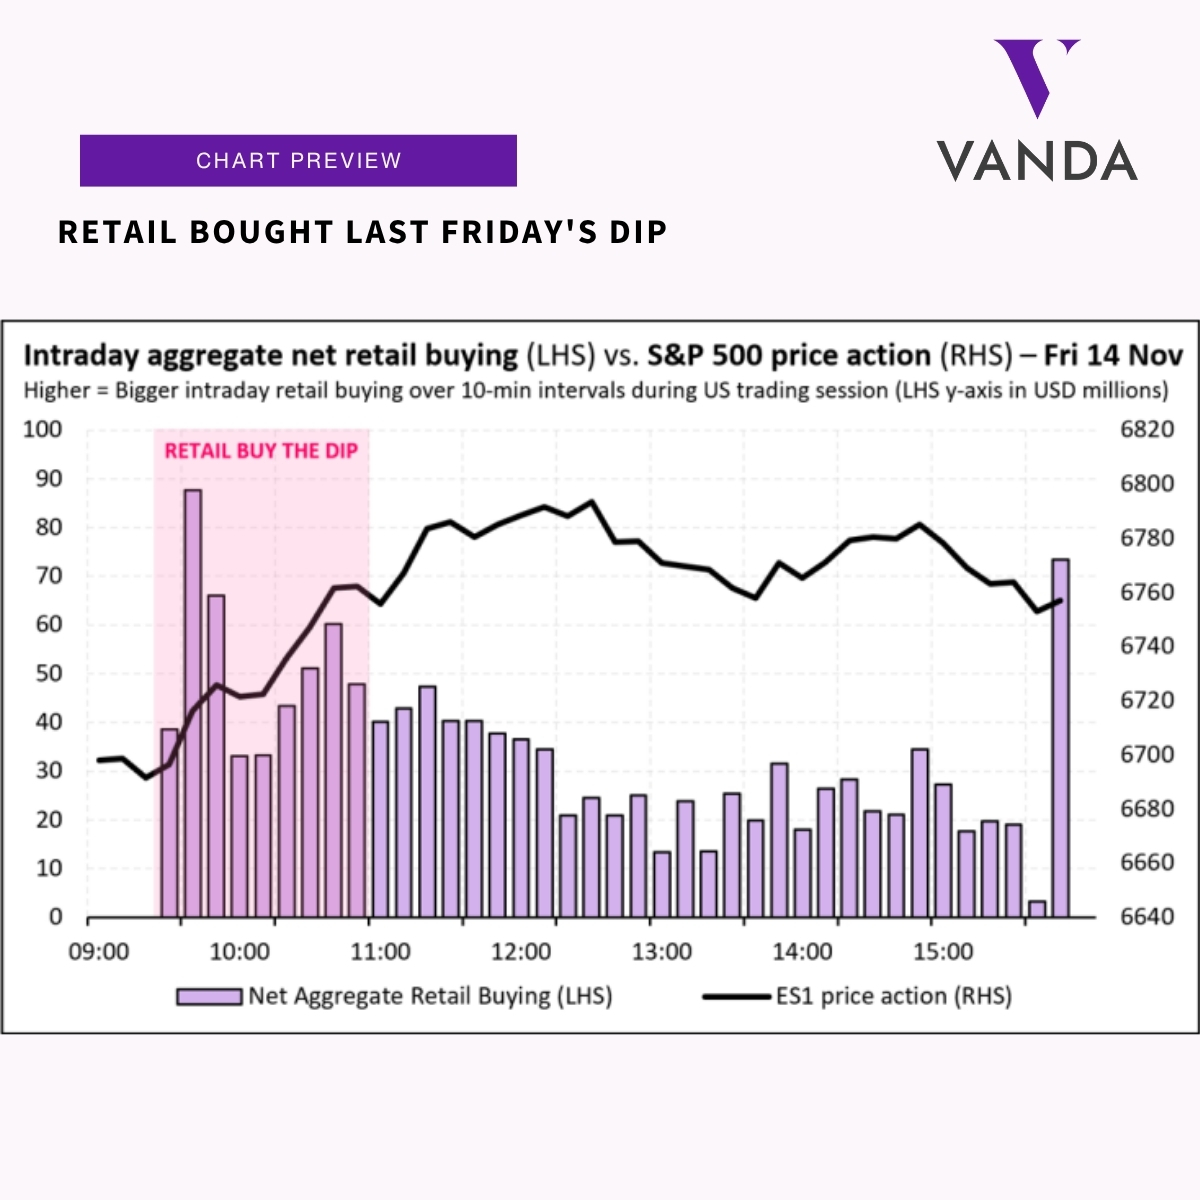
14 Oct 2025
Retail bought the dip. Again.
Rules-based investors sold off Friday, but retail had their biggest buying day since Liberation Day.
Learn more: sales@vanda.com
2
11
12,105
18 Sep 2025
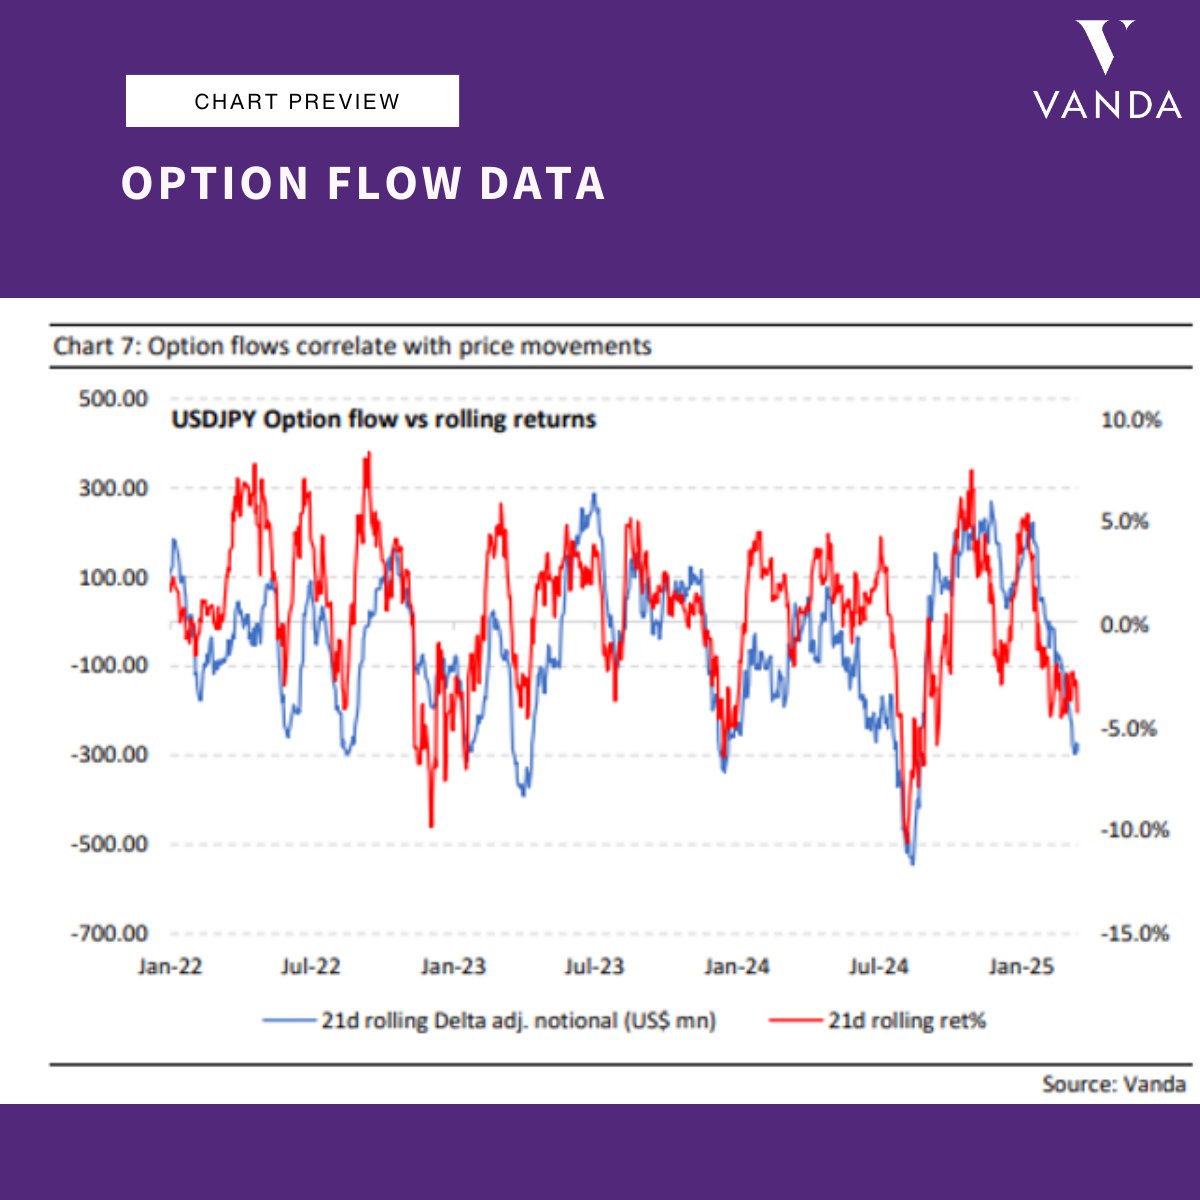
When positioning shifts, prices follow.
This chart shows how our USDJPY option flow data moves in step with returns a clean, reliable proxy for speculative sentiment.
Introducing Live FX Positioning Data updated every 10 minutes. See shifts before they move the market.
1
5
941
11 Sep 2025
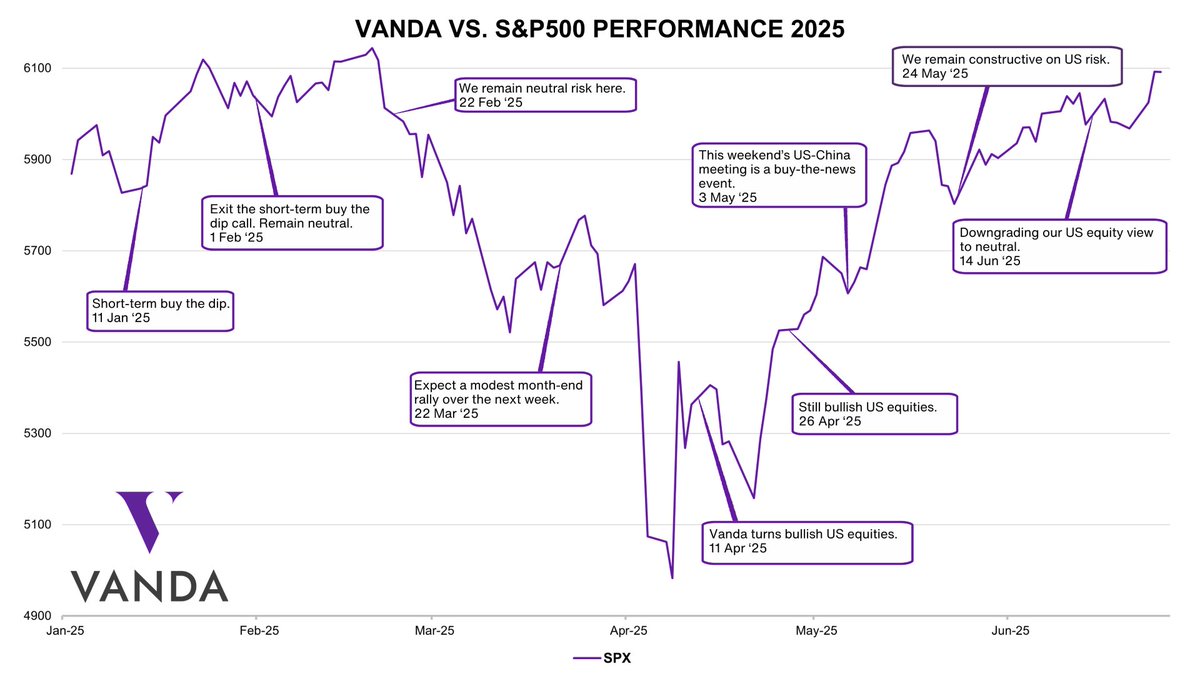
In April, Eric Liu called the bottom on US equities.
He was right. Now his framework has shifted. This time, the call goes against consensus.
To unlock the research: sales@vanda.com
4
720
4 Mar 2025
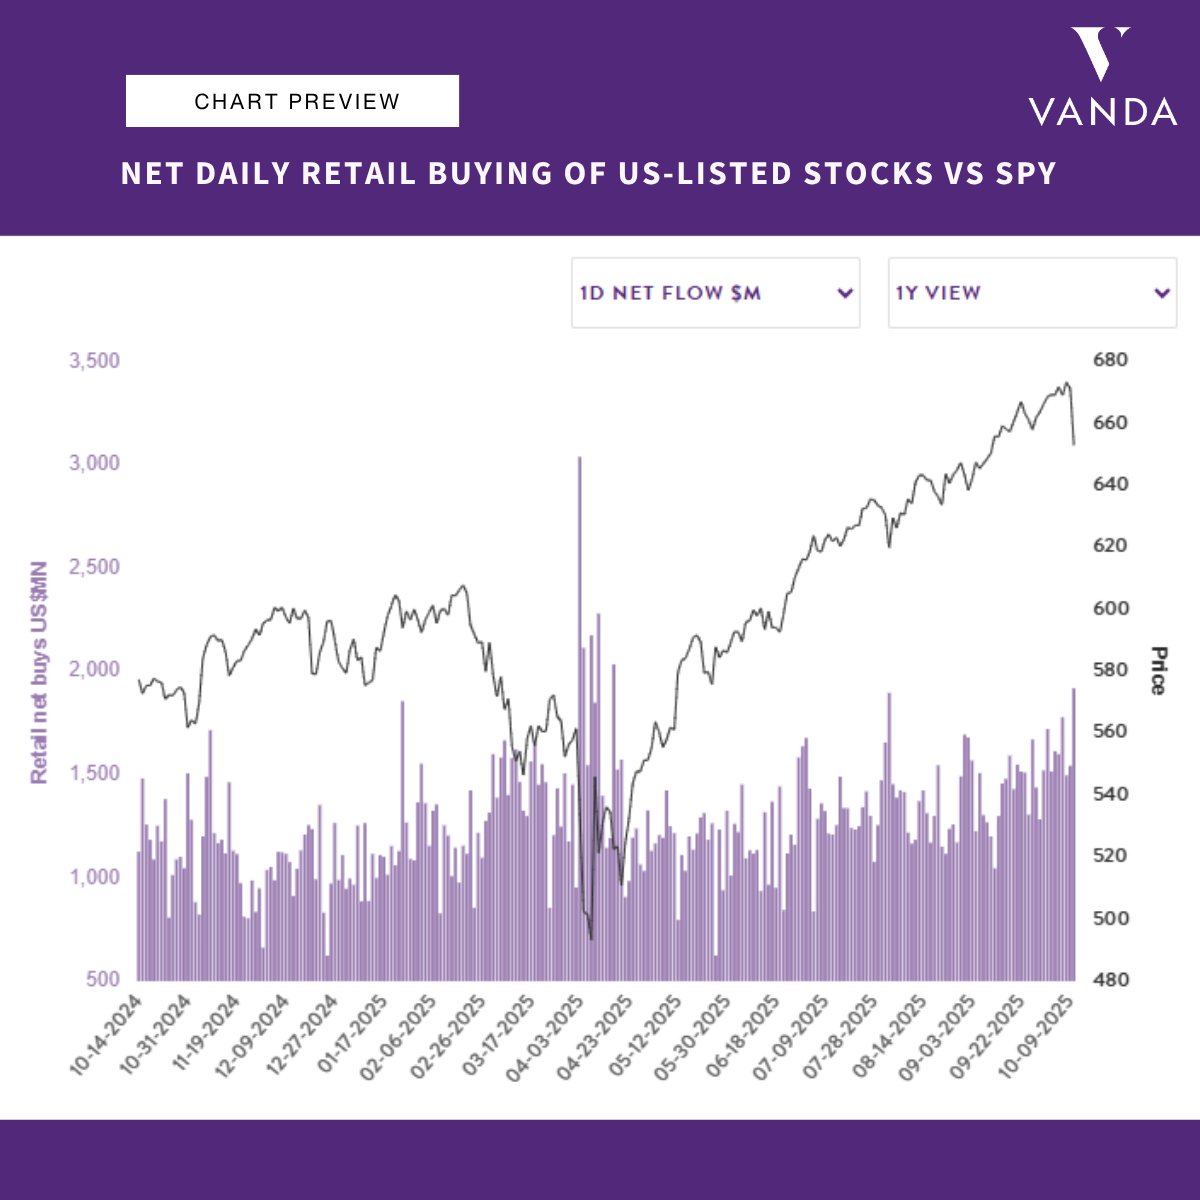
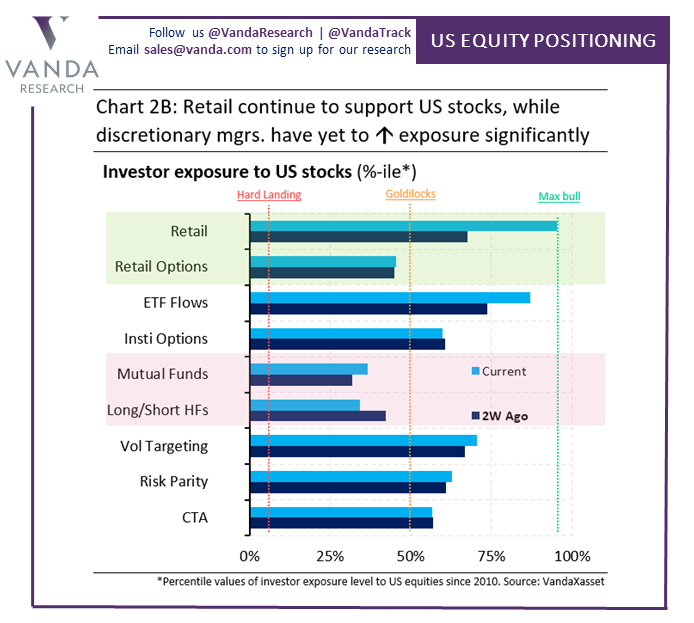
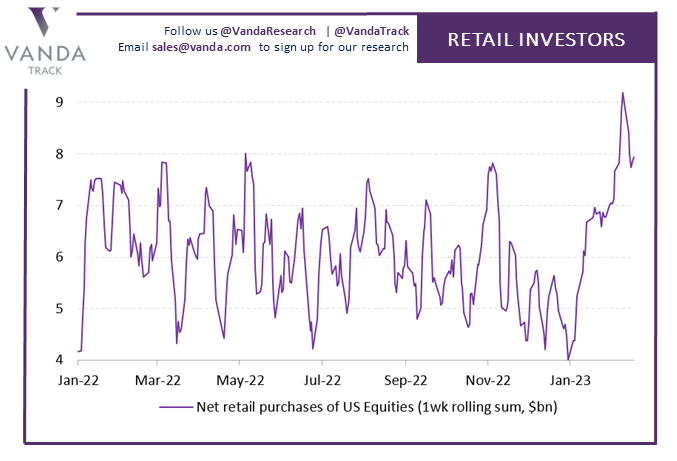
Retail investors piled into US equities again yesterday—classic buy-the-dip behavior. But they haven’t capitulated yet, meaning other players are driving stocks lower.
Find out how to cut through the noise with VandaTrack: shorturl.at/HFqdC
3
1,285
Vanda Research retweeted

1 May 2024
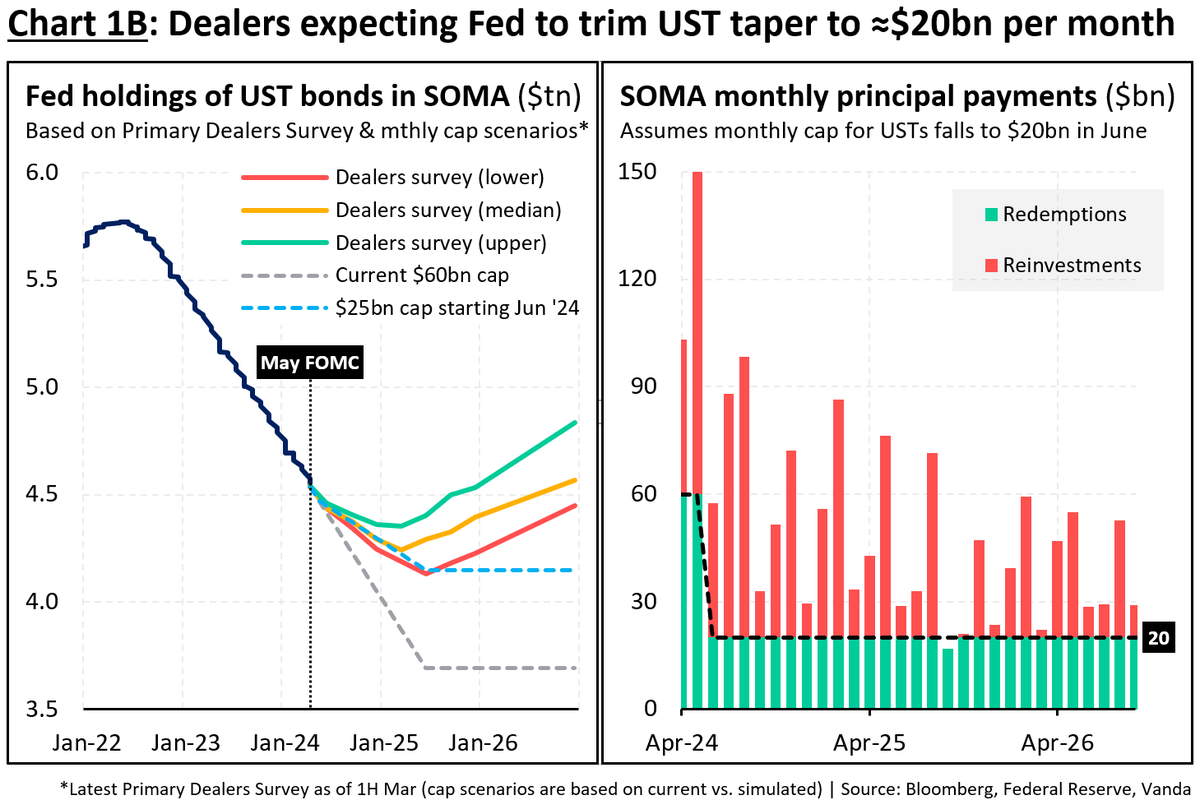
⚠️ Fed taper announcement (caps cut to $25bn) broadly in line with where Primary Dealers were in early March (at $20bn). I don't think this was a massive surprise... and why we're seeing a muted reaction. If anything US yields stay supported unless Powell tries to talk cuts $USD
7
33
7,507
Vanda Research retweeted
25 Jan 2024
⚠️ ECB day…
🟢 Best case for $EUR is Lagarde explicitly rules out Mar/Apr cuts saying ECB will only cut after seeing H1 wage negotiations
🔴 Worst case for $EUR is Lagarde rules in Mar/Apr rate cuts by saying all options possible
Most likely we’ll get a whole heap of nothing
6
8
66
9,146
Vanda Research retweeted
17 Jan 2024
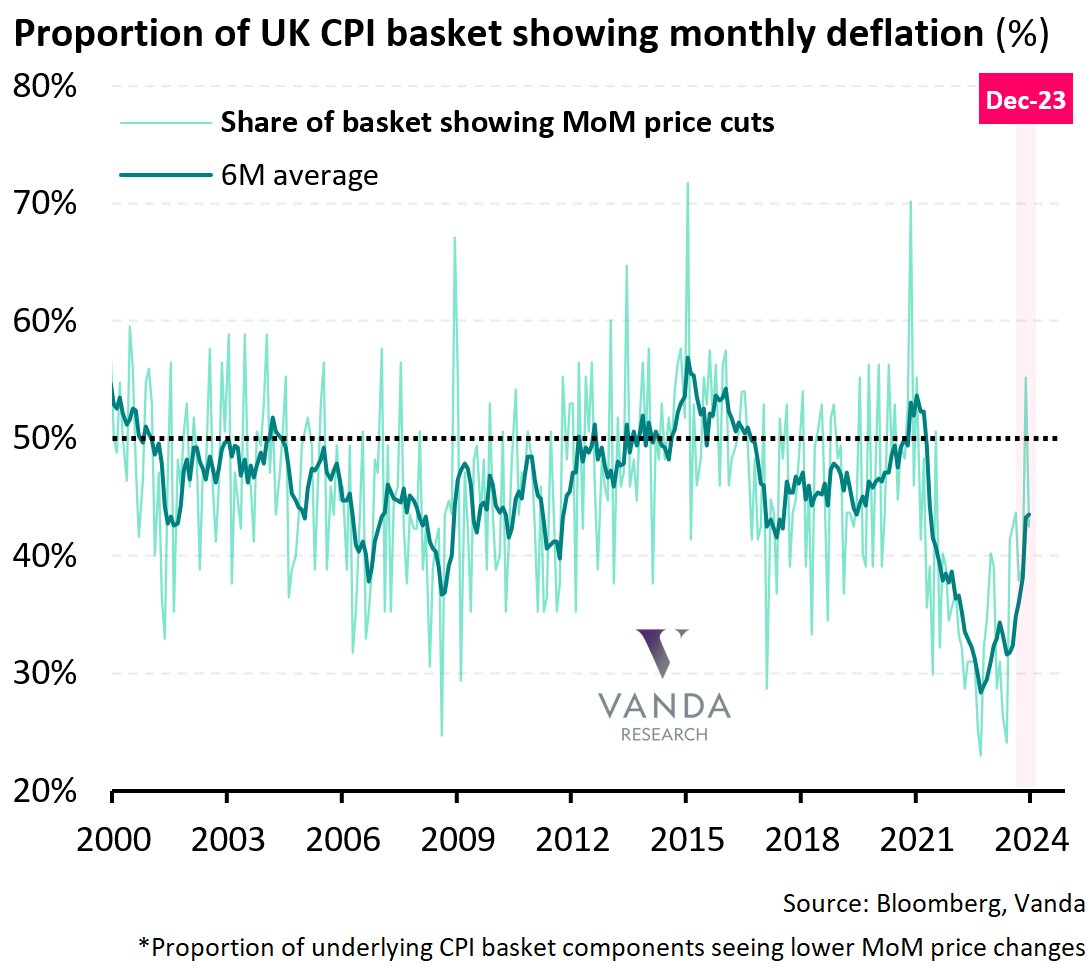
⚠️ On the surface UK CPI was 'hot'. Certainly services sticky (largely hotels). BUT 43% of the basket still saw price cuts. Trimmed mean MoM was 0.2%. This isn't a broad uptick in prices. It's a few sticky factors that I expect will fade in Q1. Mar still live for BoE cut $GBP
6
15
72
17,329
Vanda Research retweeted
29 Mar 2022
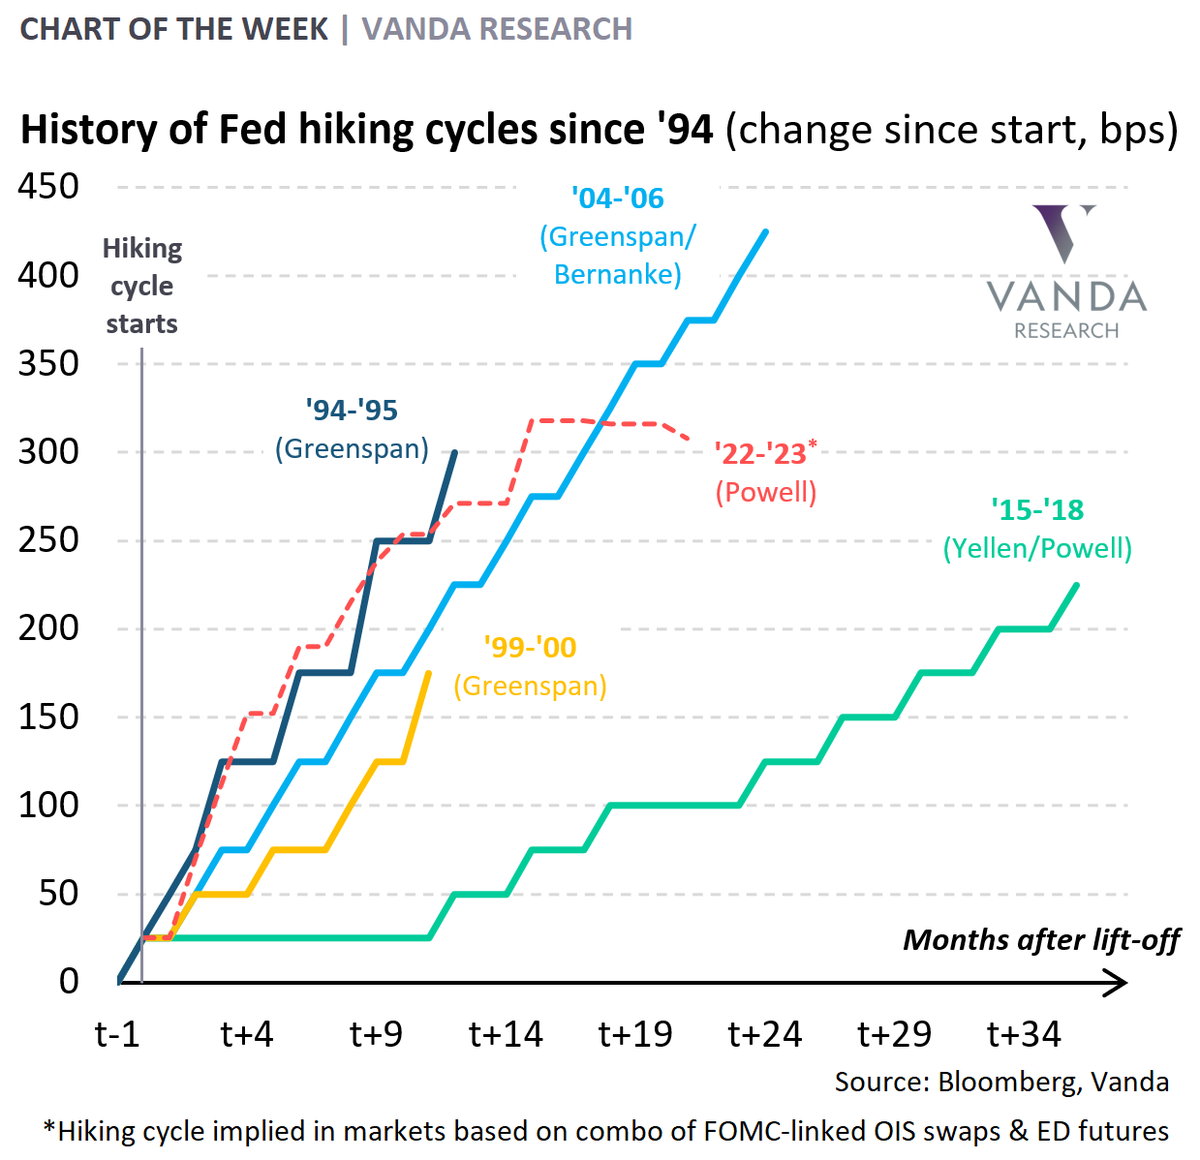
⚠️ Markets are pricing in the most aggressive front-loaded Fed hiking cycle in modern history. If the Fed delivers 4 consecutive 50bps hikes starting in May... which is starting to get priced in... then this will be more aggressive than what we saw in '94. History being made $USD
31
136
477
Vanda Research retweeted
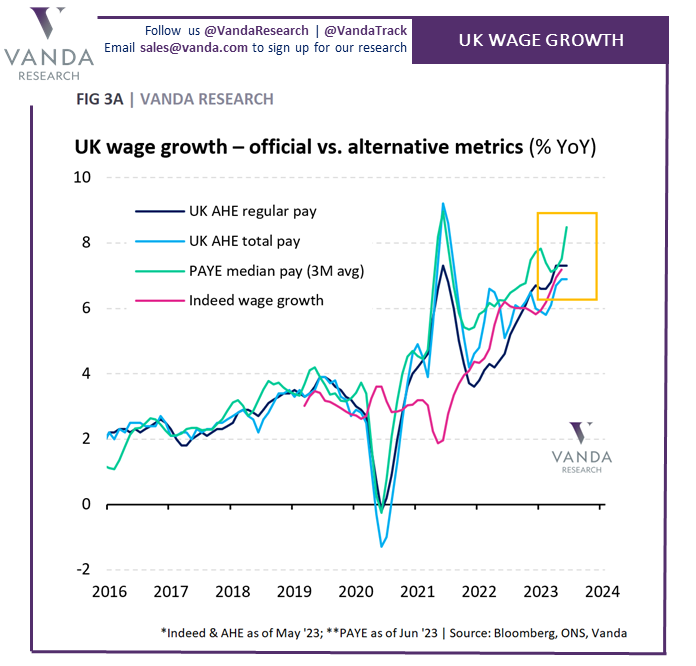
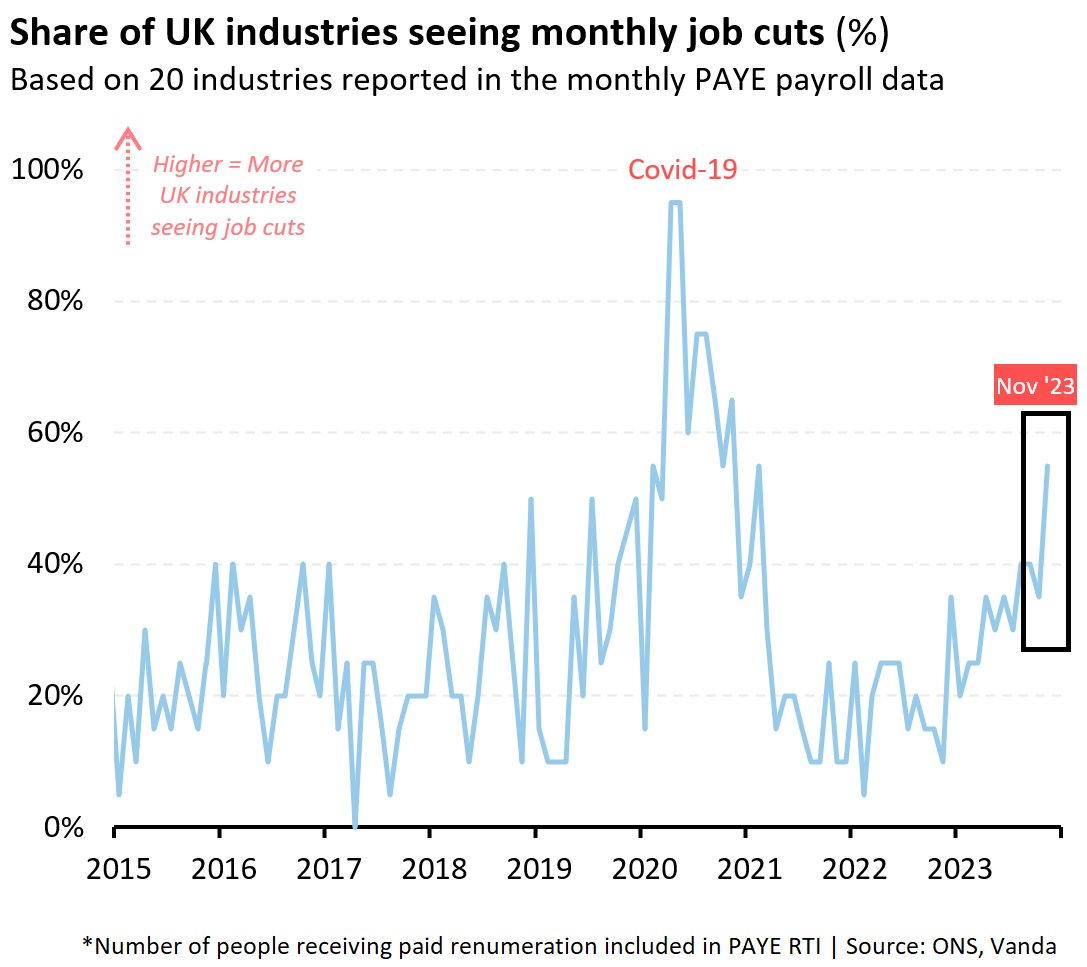
12 Dec 2023
⚠️ UK wage growth misses... and slowing in line with all the other alt data. Negative monthly payrolls too... broad-based with more than 50% of industries seeing job cuts. If the US jobs report was strong... UK one is the polar opposite. BoE can cut sooner than markets think $GBP
2
25
78
23,681
Vanda Research retweeted
30 Oct 2023
⚠️ Sticky flash Oct Tokyo CPI means the risks of a YCC tweak at Oct BoJ tomorrow cannot be ruled out. It's less clear-cut than it was in July given Japan's loss of economic momentum over Q3. But 1H Oct mid-fiscal year price dynamics suggest BoJ might have more work to do $JPY

5
25
4,899
Vanda Research retweeted

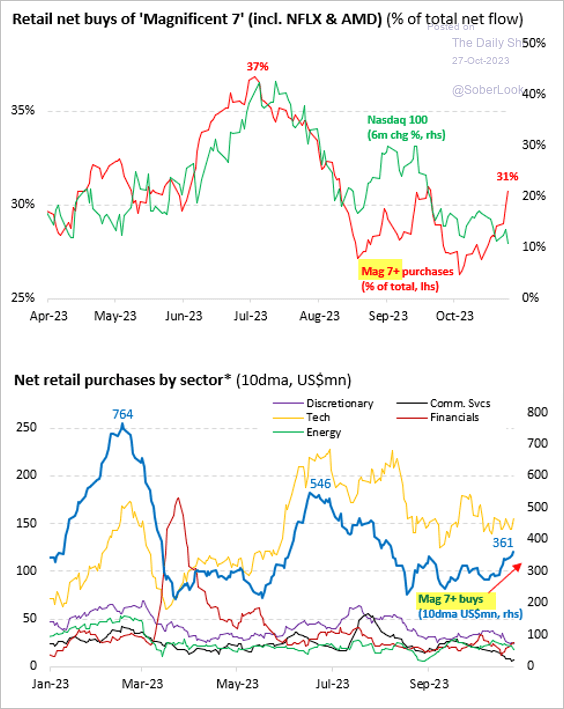
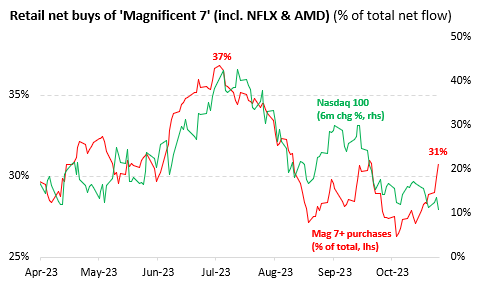
28 Oct 2023
"Retail investors have been buying tech megacaps as prices fall."
@vandaresearch via @SoberLook
15
34
6,211
Vanda Research retweeted

27 Oct 2023
Retail traders are eager to buy the dip in big tech --@vandaresearch
11
18
90
18,570
Vanda Research retweeted
24 Oct 2023
⚠️ UK flash PMI:
- Biggest fall in services activity since Jan
- Longest decline in manf activity since 08/09
- Lower jobs 2nd month in row
- Softer services costs (wages)
- Goods prices declined fastest since '16
Only hawkish factor:
- 3M high in prices charged (services) $GBP
3
48
137
71,344
Vanda Research retweeted
24 Oct 2023
⚠️ UK jobless claims remain in keeping with late '18/'19 end-of-cycle levels. Unemployment data is stale & uncertain given measurement issues. But direction of travel for UK labour market clear - things are getting worse. Another set of data forcing BoE to sit on their hands $GBP
5
31
5,056
Vanda Research retweeted
24 Oct 2023
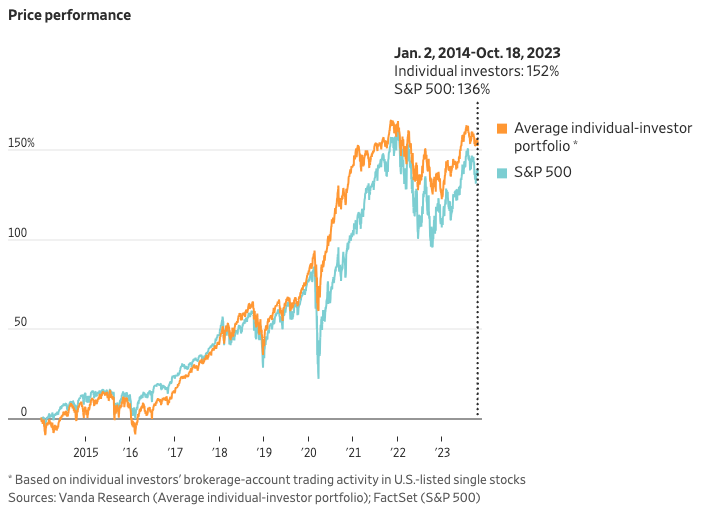
"The average individual-investor stock portfolio has risen about 150% since the beginning of 2014...That beats the S&P 500’s roughly 140% during the same period."
@WSJ @vandaresearch
5
3
11
18,397
Vanda Research retweeted
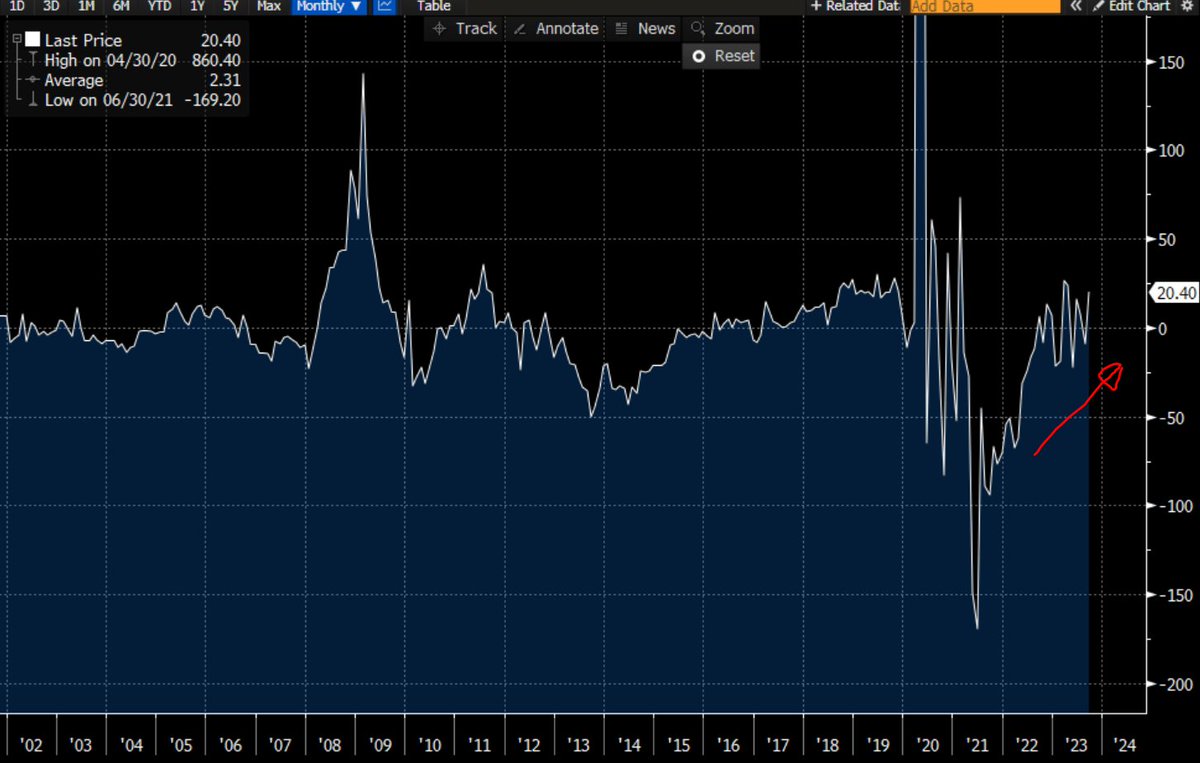
4 Oct 2023
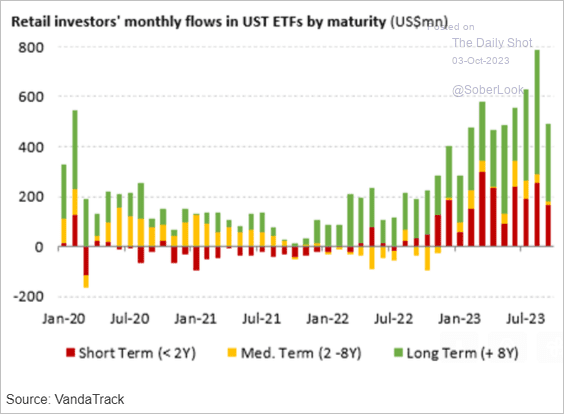
"Retail investors continue to buy Treasury ETFs."
@SoberLook @vandaresearch
4
12
6,165