
Joined August 2011
- Tweets 16,908
- Following 3,308
- Followers 352,370
- Likes 2,298
12,065 Photos and videos
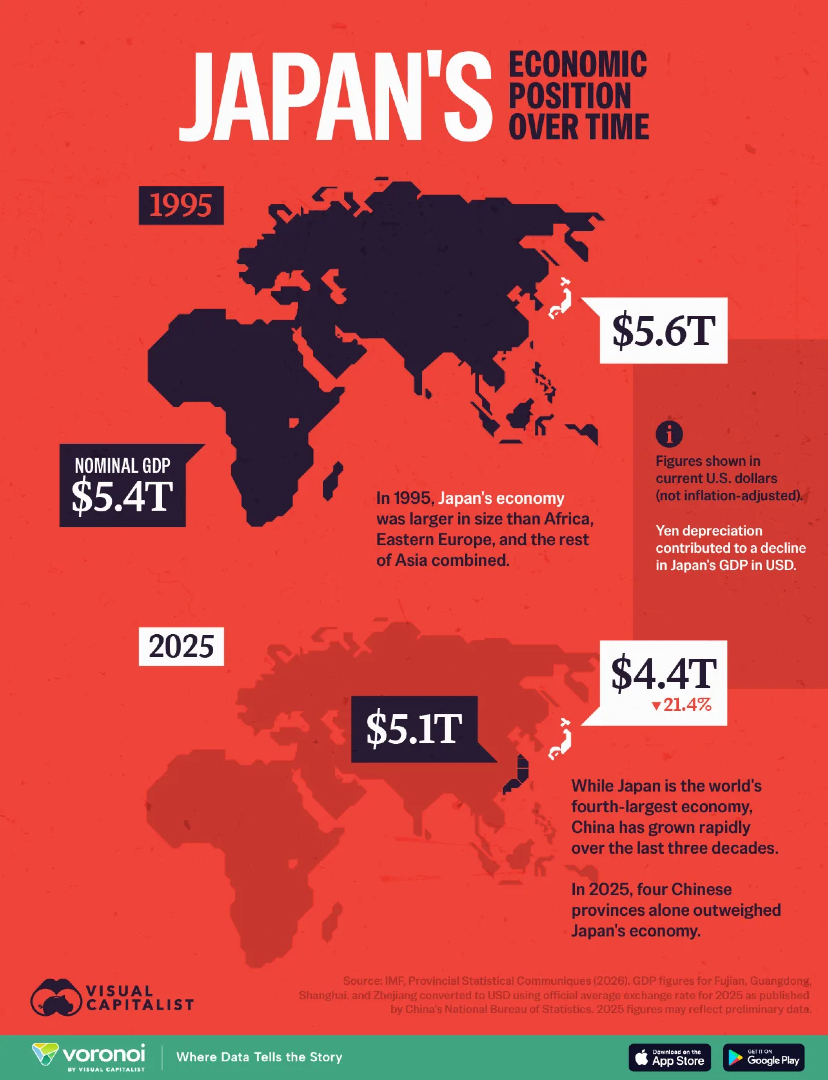


Mapped: How Japan Lost Its Economic Dominance in Asia 📉
visualcapitalist.com/japan-l…
4
32
114
12,845
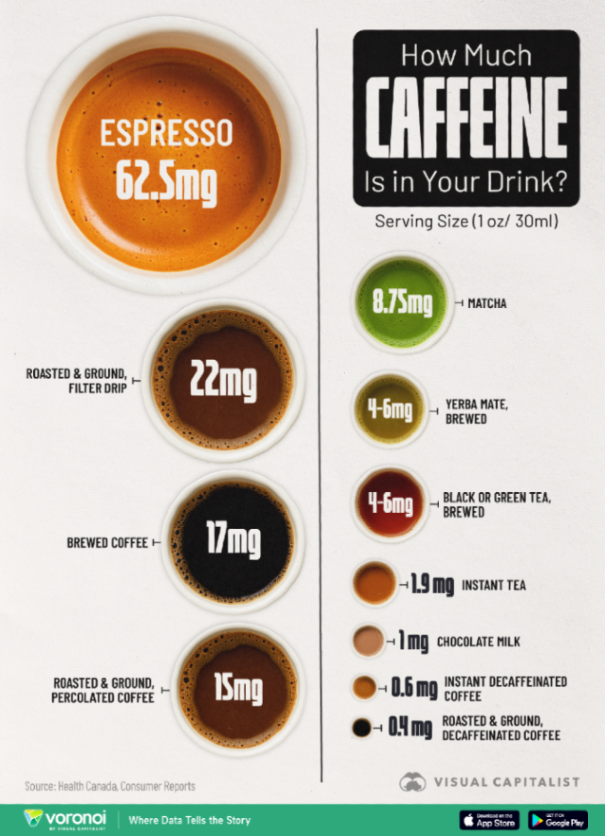
Flashback Favorite 🔙
How Much Caffeine is in Your Drink? ☕
From the Archive: visualcapitalist.com/how-muc…
3
16
89
12,082

Jun 14
Charted: Where Cooling Is Becoming a Luxury in Europe ❄️
This graphic by @datapulse_de is one of the many incredible data-driven charts and stories from creators featured on our @VoronoiApp. ✅
voronoiapp.com/climate/When-…
1
11
56
11,362
Jun 13
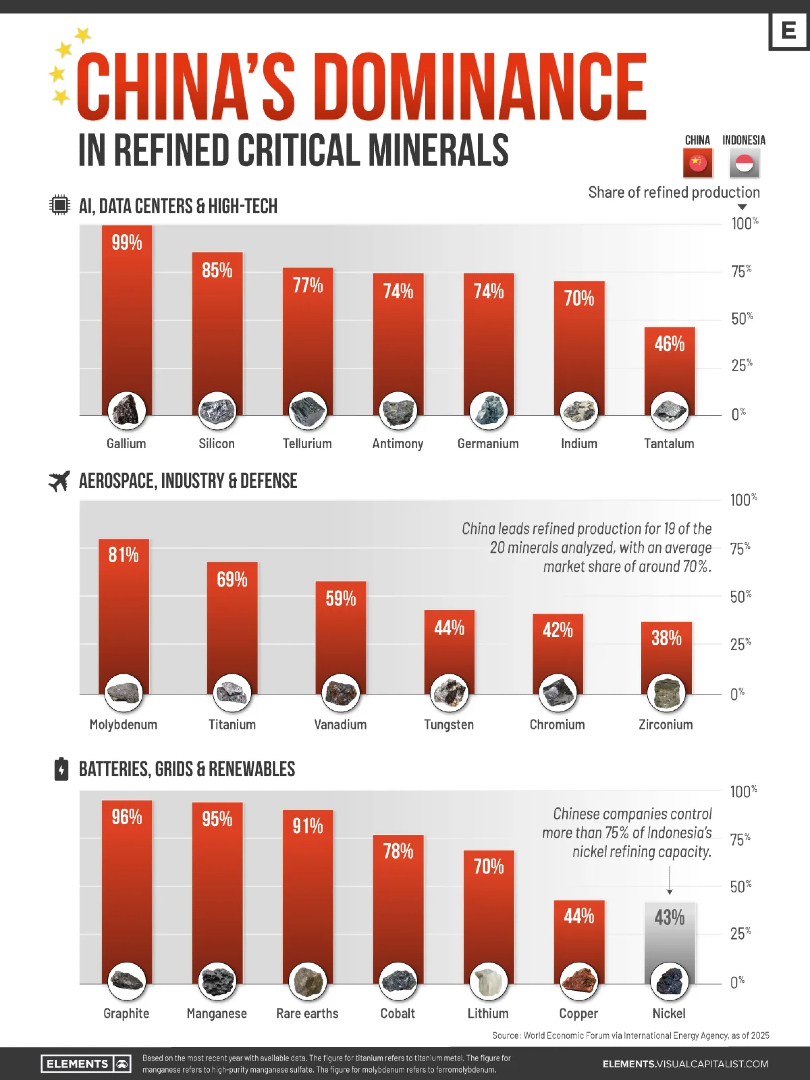
Charted: China’s Grip on Critical Mineral Refining ⛏️
visualcapitalist.com/charted…
5
48
144
15,495
Jun 13
Ranked: Who Controls the World’s Uranium Supply?
visualcapitalist.com/ranked-…
1
35
132
13,149
Jun 13
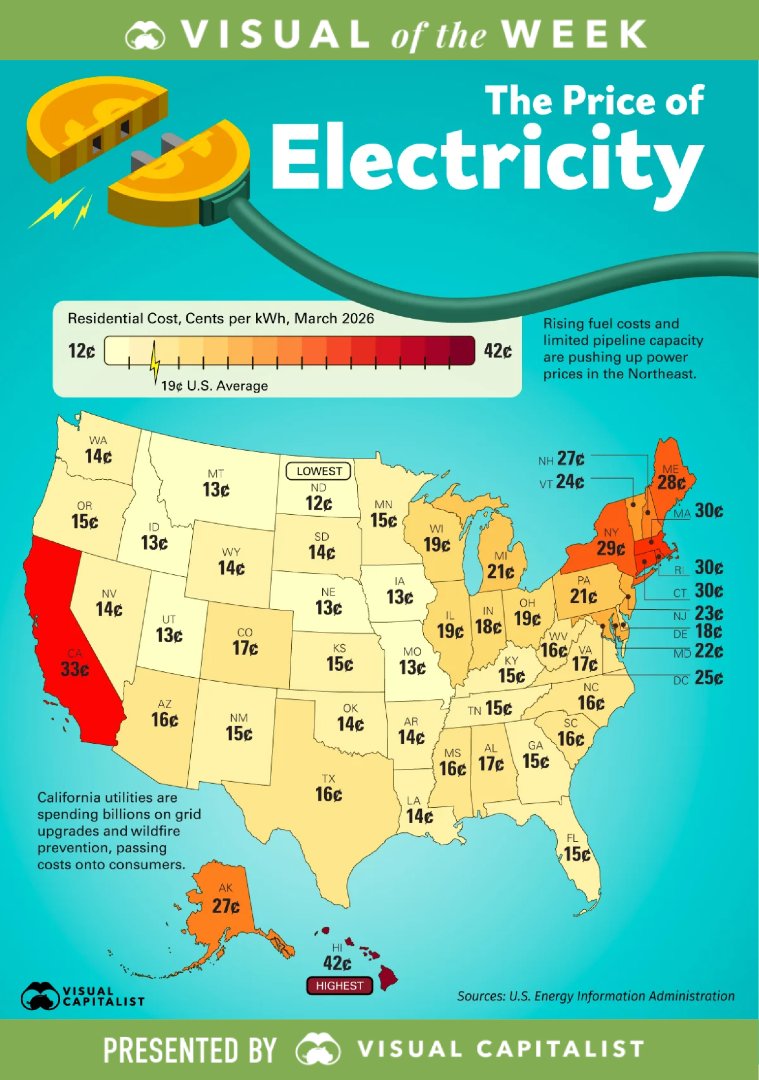
Visual of the Week 🥇
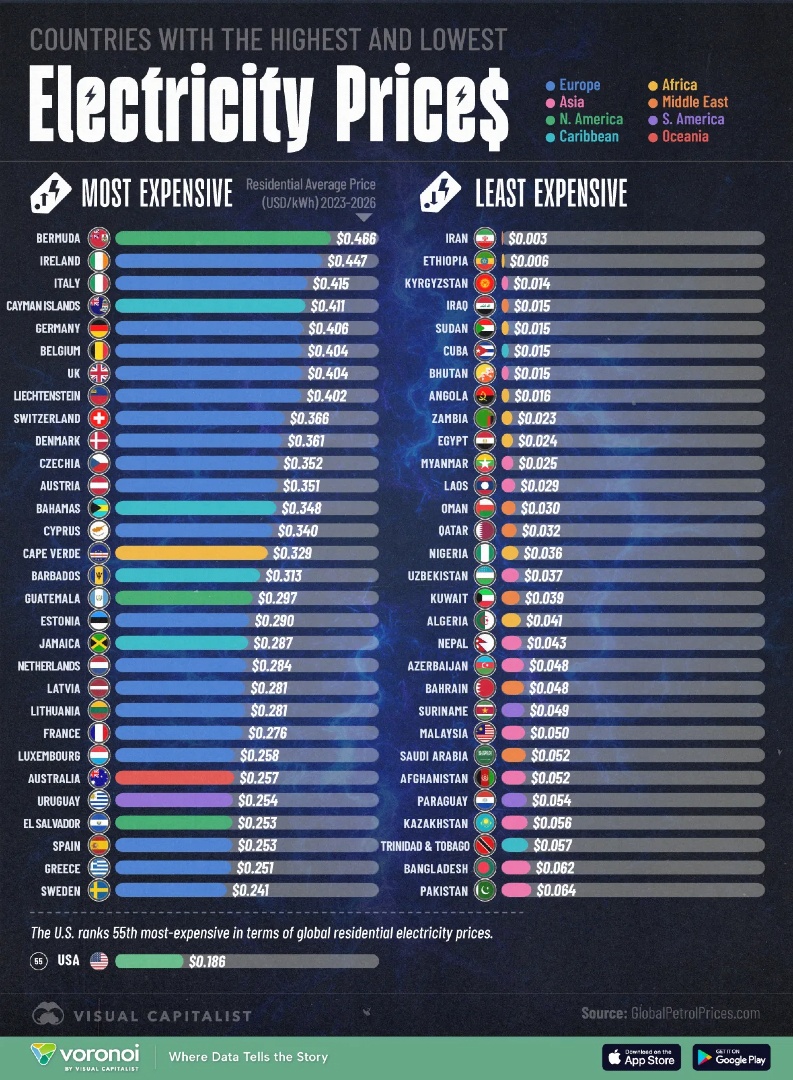
Americans pay 12¢ to 42¢ per kWh for residential electricity depending on where they live—a gap that can add up to roughly $3,000 a year in electricity costs for a typical household.
visualcapitalist.com/mapped-…
8
33
95
11,123
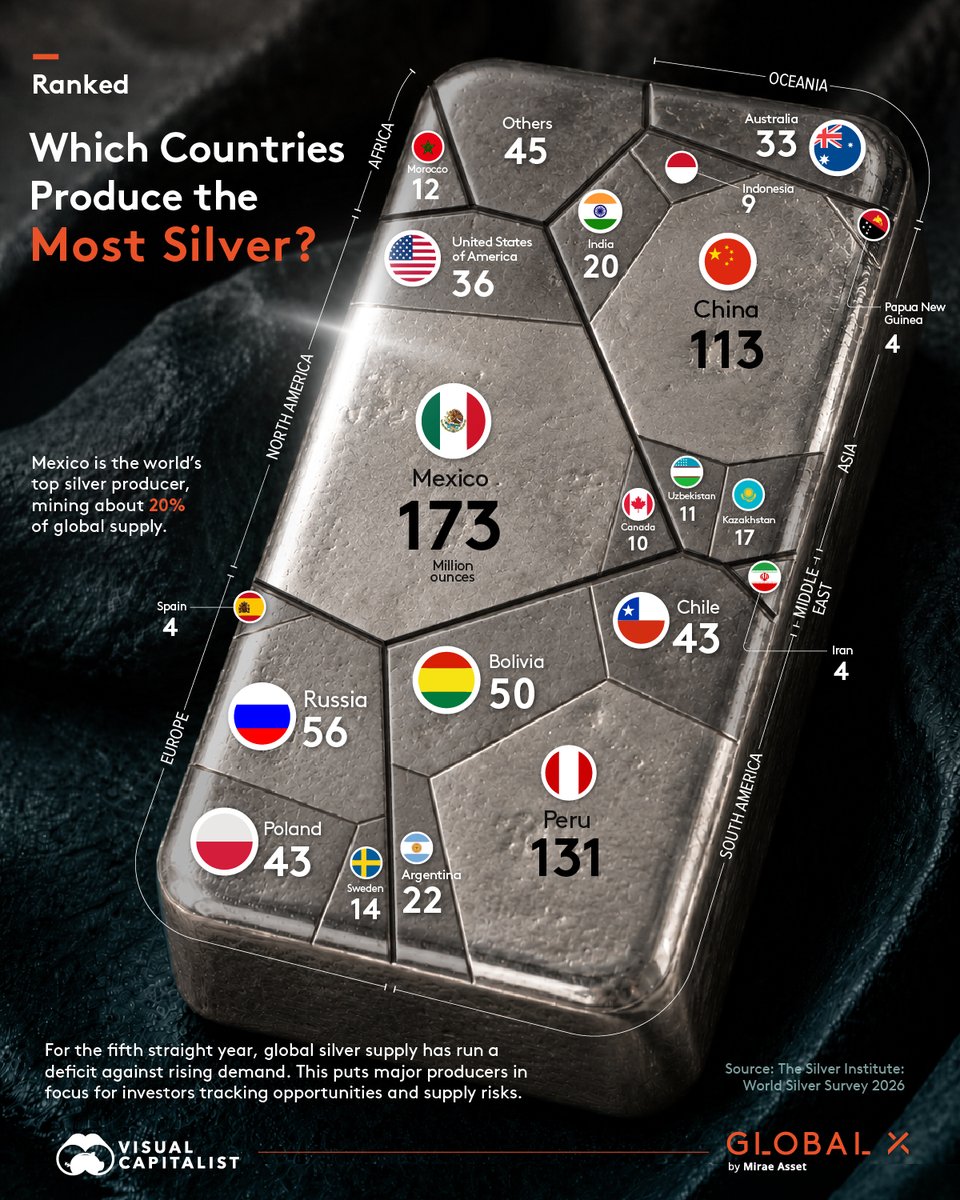
Jun 12
Mexico produces more silver than any other country, mining 173 million ounces in 2025—about one-fifth of global supply ⛏️
This graphic, created in partnership with @globalxca ranks the world's top silver-producing countries and highlights how supply is concentrated among a handful of major mining nations.
visualcapitalist.com/sp/gx04… #gx04
6
53
143
11,892
Jun 12
Elon Musk Becomes the World’s First Trillionaire 🚀
visualcapitalist.com/elon-mu…
7
62
264
11,983
Jun 12
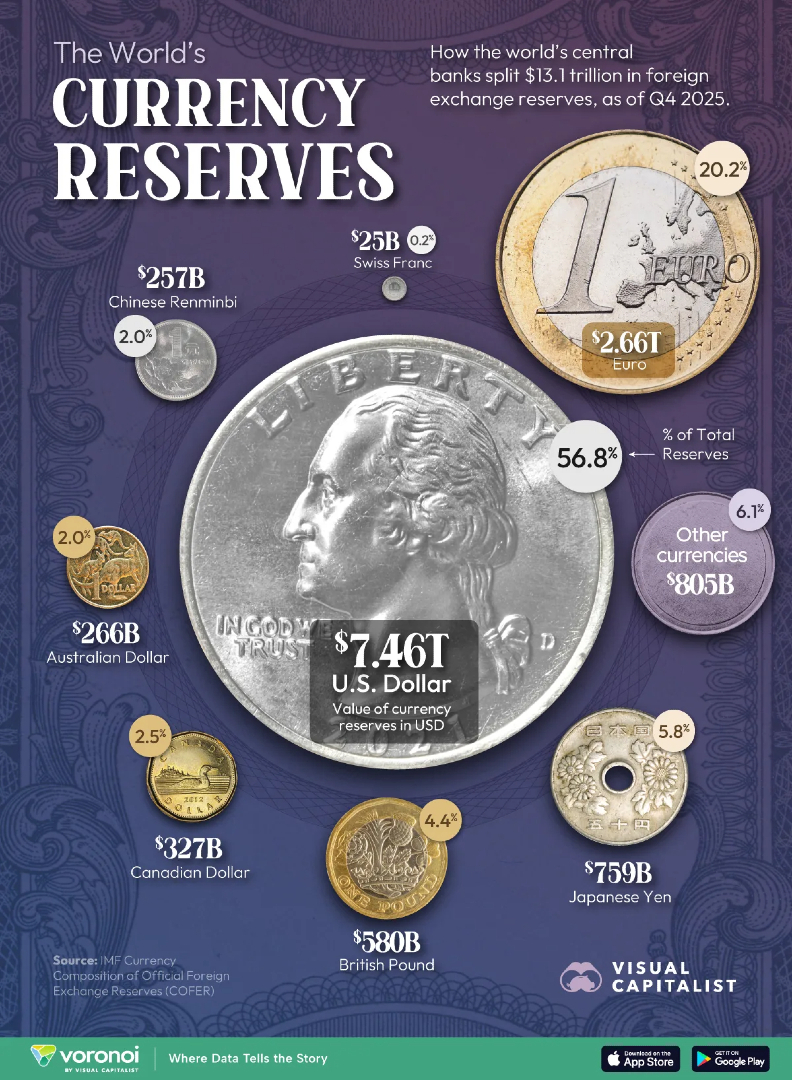
Ranked: The World’s Biggest Reserve Currencies Today 💵
visualcapitalist.com/ranked-…
2
39
141
11,140
Jun 12
Mapped: The Trust Gap Across Europe 👥
This graphic by The European Correspondent is one of the many incredible data-driven charts and stories from creators featured on our website. ✅
visualcapitalist.com/cp/mapp…
2
14
46
9,265
Jun 11
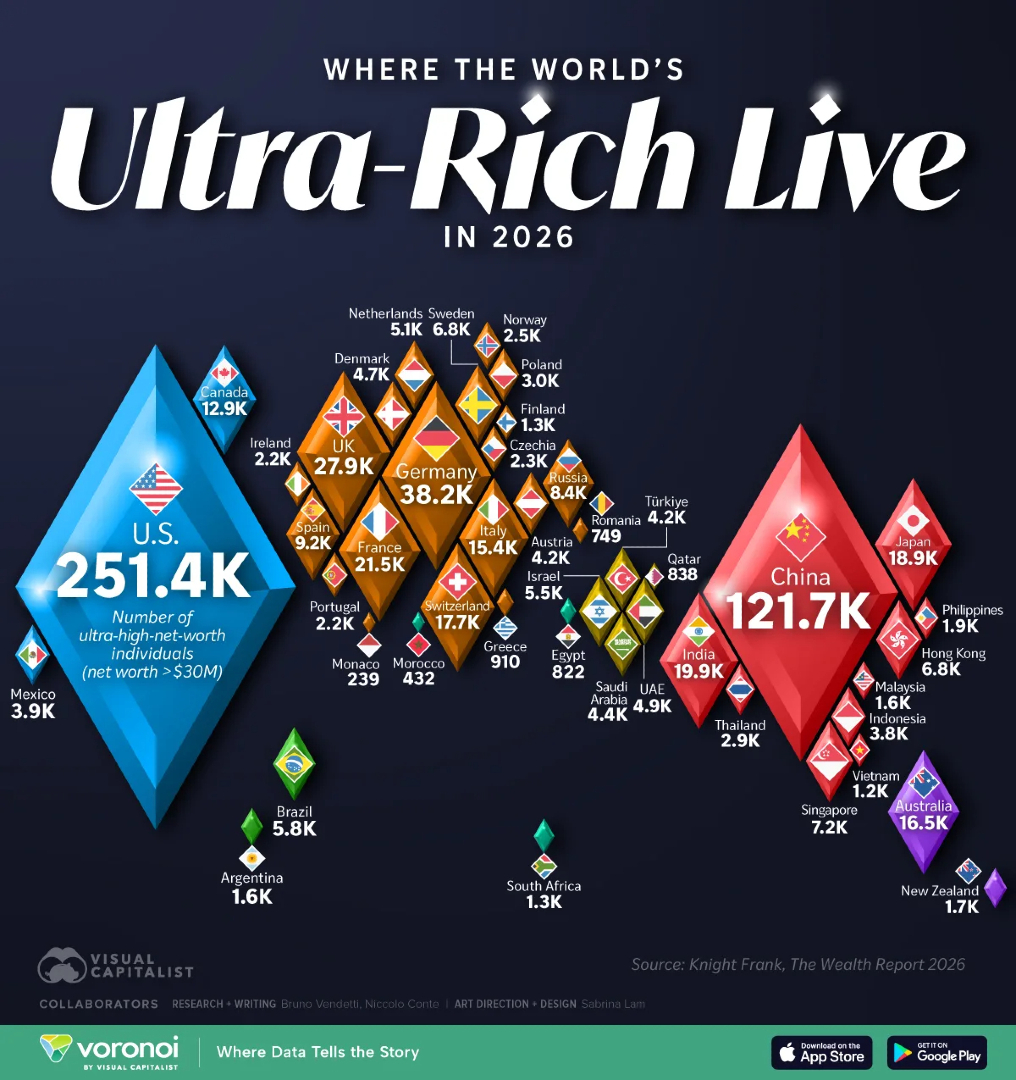
For Mapped: Where the World’s Ultra-Rich Live in 2026 🏙️
visualcapitalist.com/mapped-…
31
122
10,926
Jun 11
Ranked: Where Electricity Costs the Most and Least ⚡
visualcapitalist.com/electri…
5
42
134
13,597
Jun 11
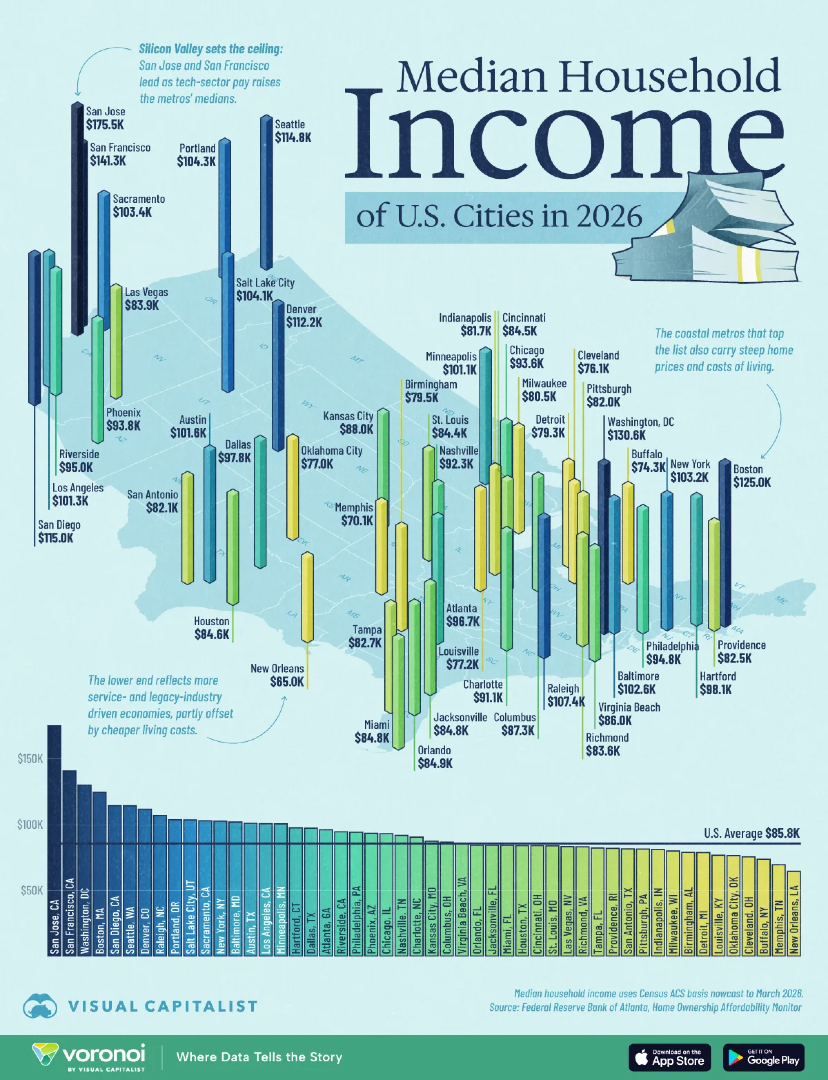
Mapped: How Household Income Varies Across Major U.S. Metros 💵
visualcapitalist.com/mapped-…
2
12
77
9,155
Jun 11
Ranked: Europe’s Most Forested Countries 🌳
This graphic by Harris Saleem is one of the many incredible data-driven charts and stories from creators featured on our @VoronoiApp. ✅
voronoiapp.com/climate/Visua…
4
12
67
9,319
Jun 11
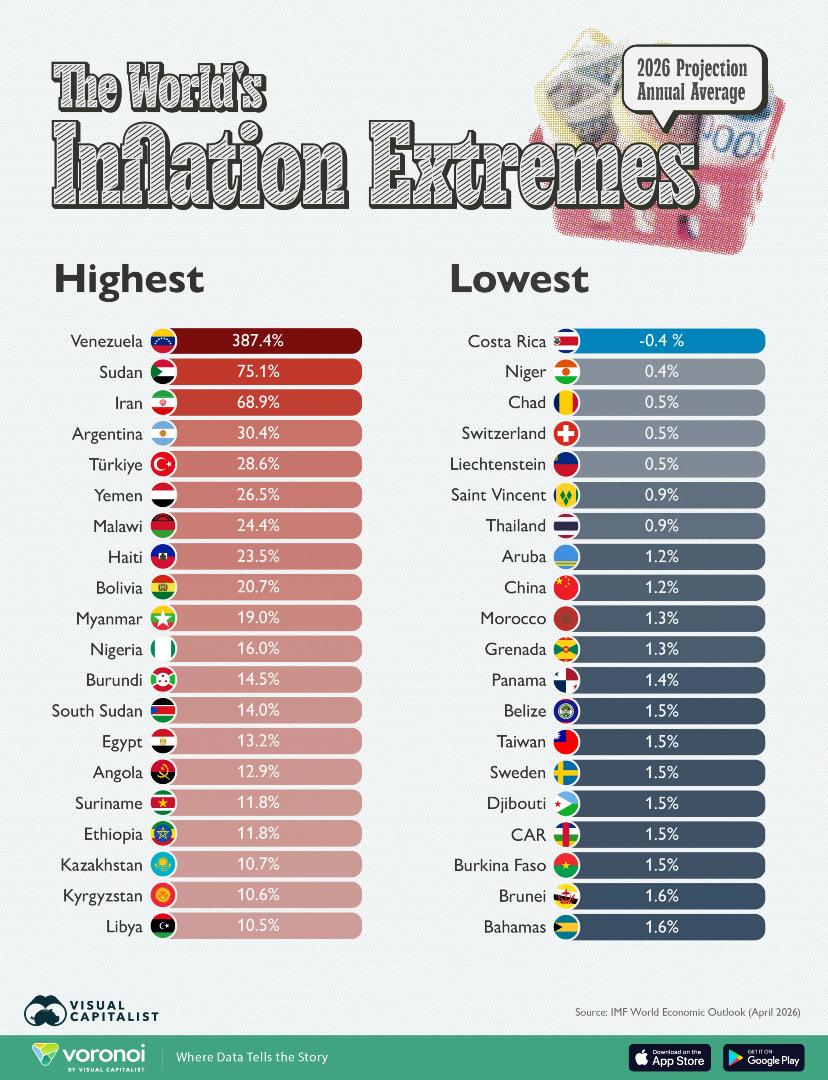
Ranked: The World’s Inflation Extremes in 2026 📈
visualcapitalist.com/ranked-…
4
36
107
13,011
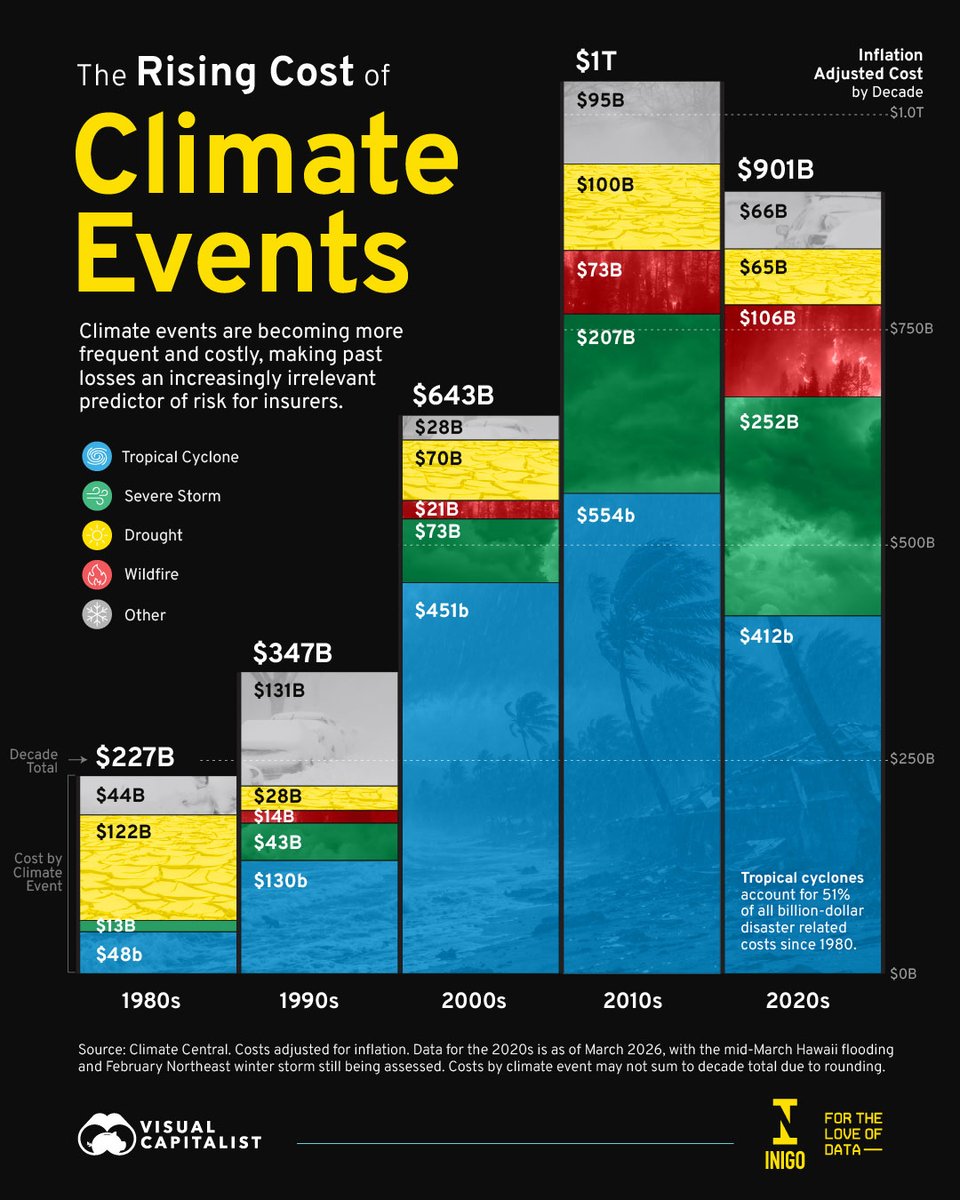
Jun 10
U.S. climate disasters are on track to cost nearly $1 trillion this decade alone 🌪️
This visualization, created in partnership with @Inigo_Insurance, shows how the financial impact of climate-driven natural disasters has escalated since 1980, with losses in the 2020s already nearing the total seen over the entire 2010s.
visualcapitalist.com/sp/ig02… #ig02
6
17
54
6,999
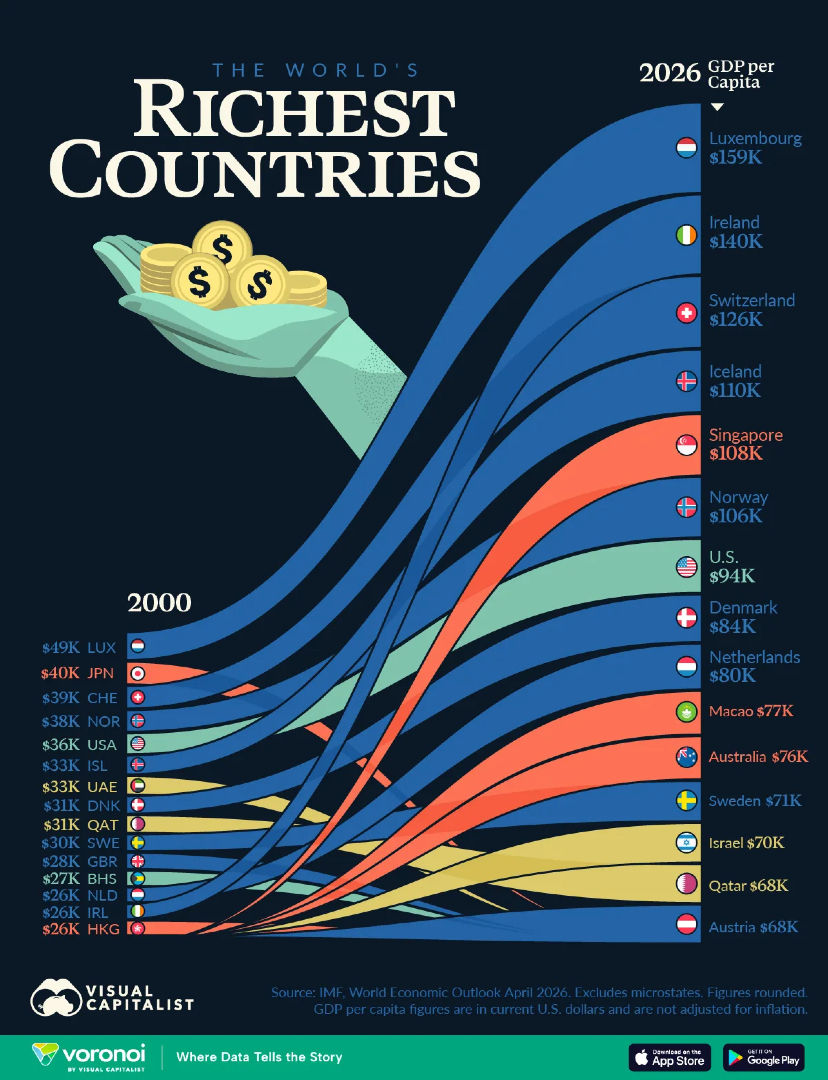
Jun 10
Ranked: The World’s Richest Countries by GDP Per Capita 💰
visualcapitalist.com/ranked-…
4
41
165
21,193
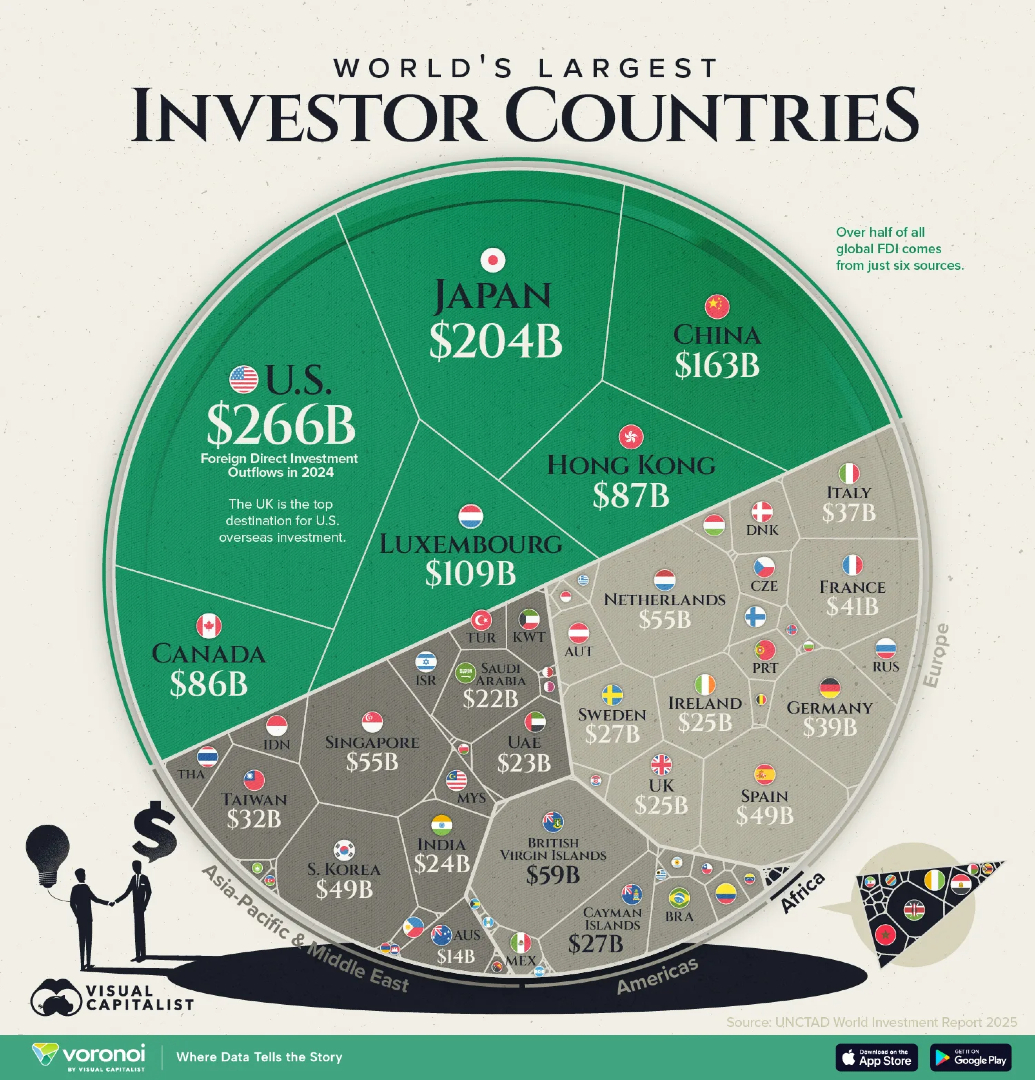
Jun 10
Ranked: The World’s Biggest Sources of Foreign Investment 💸
visualcapitalist.com/the-wor…
5
69
255
17,779