7,400 Photos and videos


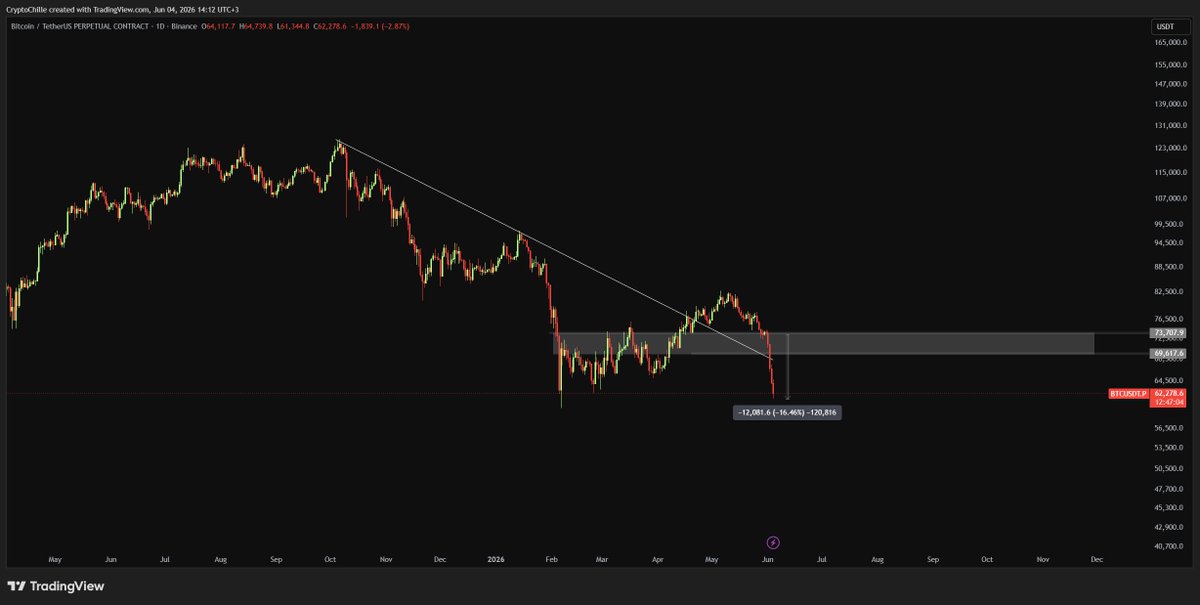


$BTC update.
-17%
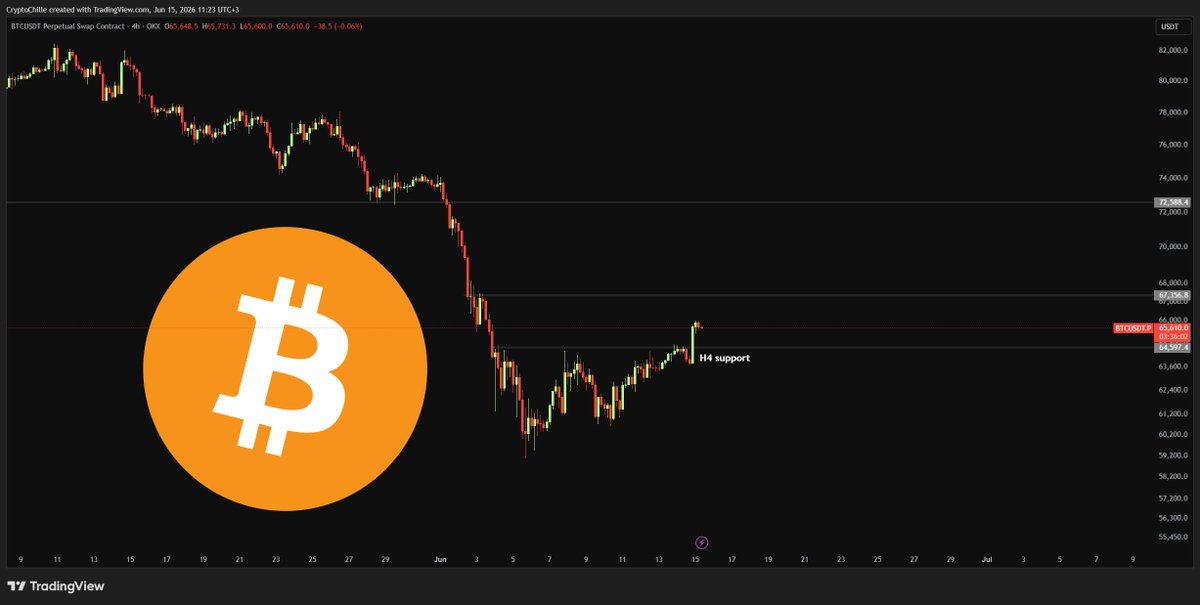
$btc holding above this support looks reassuring on the surface, but most altcoins have already lost their support levels. the broader market isn't inspiring confidence, so leaning too hard on this support would be a mistake.
one thing is clear though. if support is lost, the probability of bitcoin dropping below $59k increases significantly.
for a safer outlook, $77k needs to be cleared. sitting in a pretty neutral zone right now.
2
4
55
7,091
$btc holding above this support looks reassuring on the surface, but most altcoins have already lost their support levels. the broader market isn't inspiring confidence, so leaning too hard on this support would be a mistake.
one thing is clear though. if support is lost, the probability of bitcoin dropping below $59k increases significantly.
for a safer outlook, $77k needs to be cleared. sitting in a pretty neutral zone right now.
1
10
88
13,216
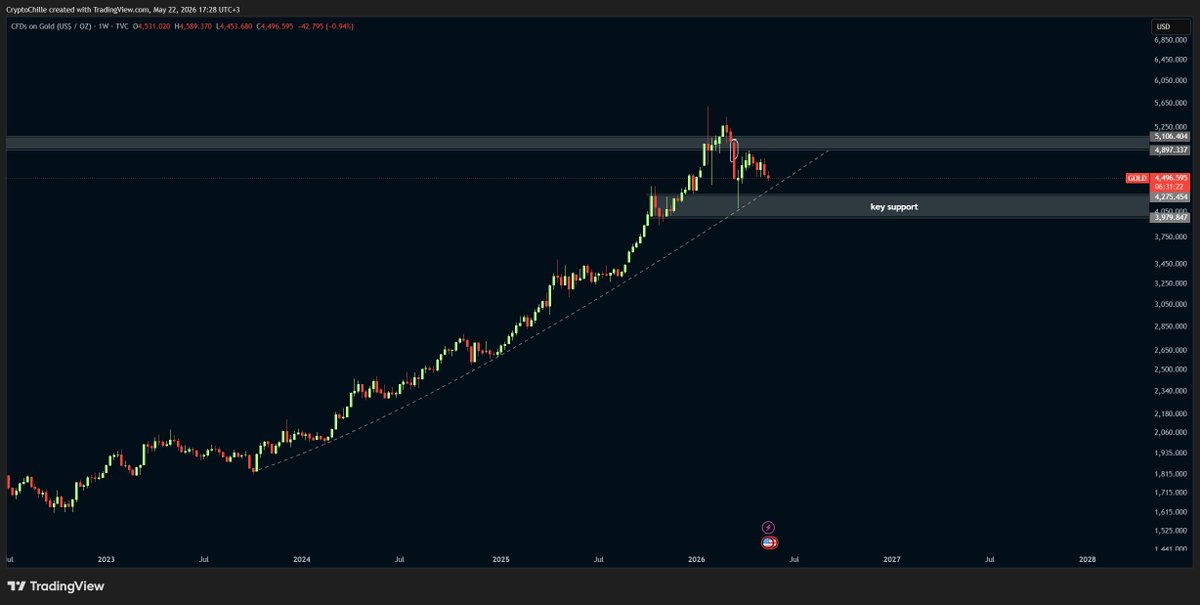
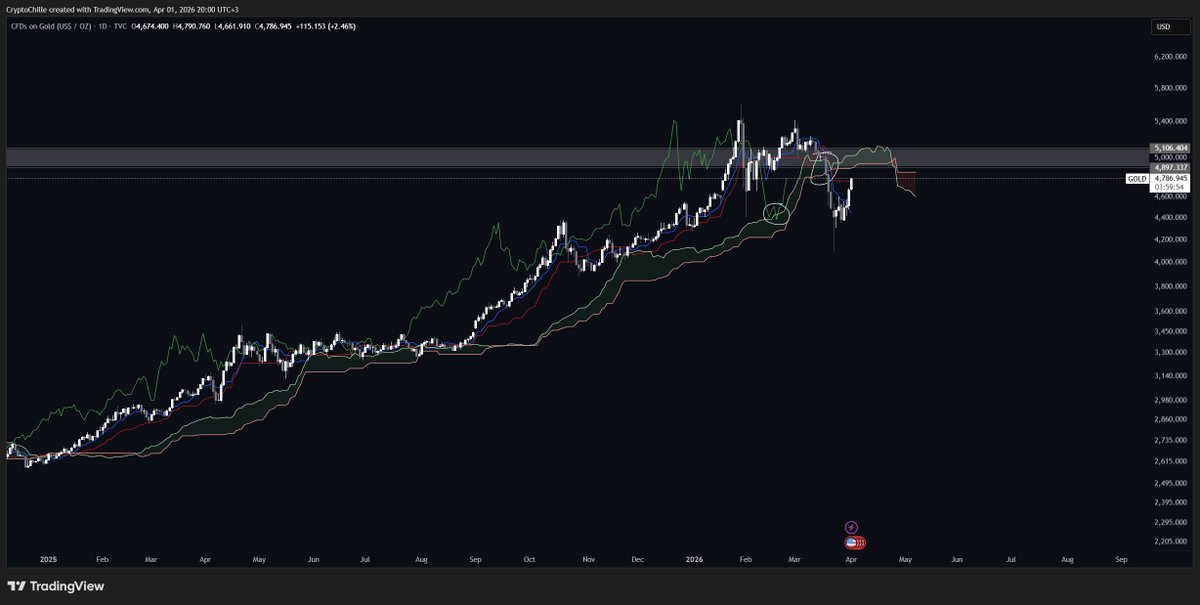
$GOLD update.
it’s been almost 2 months and gold still can’t move higher, the reason is right there on the chart.
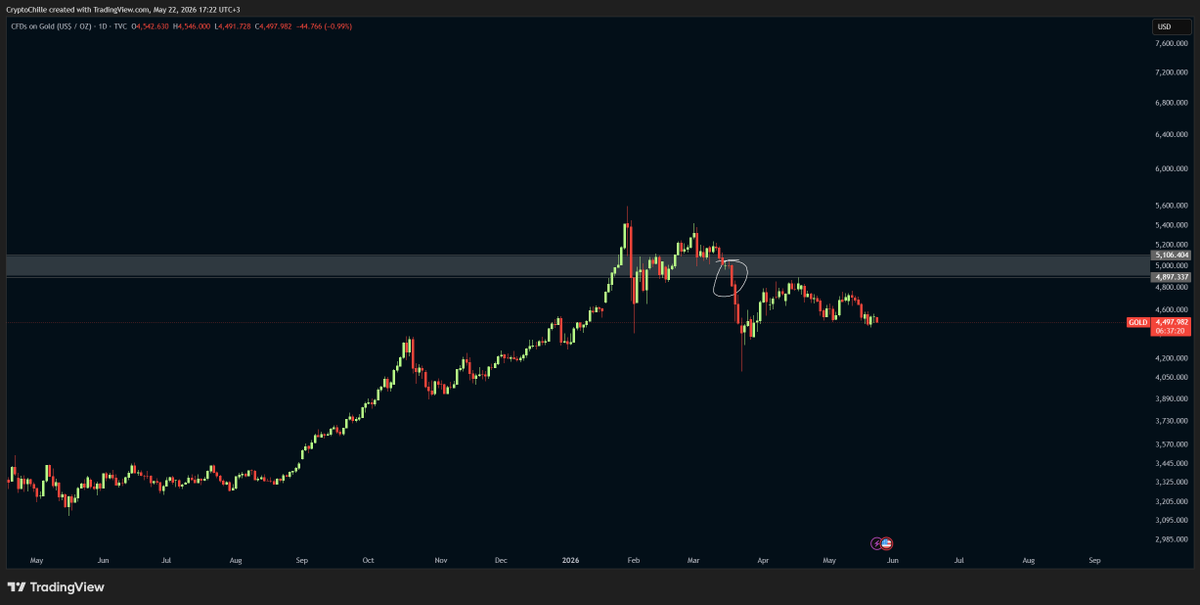
$GOLD
weekly and monthly charts still look positive, but on the daily, gold lost Kumo support for the first time in 2 years. that shifts the short-term picture to negative, and i'm now treating the Kumo as resistance.
if price reclaims it, the rally can continue from there.
the reason i'm not calling this a full breakdown is the green line, the Chikou span. as you can see on the chart, it hasn't lost the Kumo, which means even though price has slipped below, there's still enough reason to stay cautious rather than outright bearish.
bottom line: if the grey zone gets reclaimed, the rally resumes. until then, tread carefully.
5
2
56
11,334

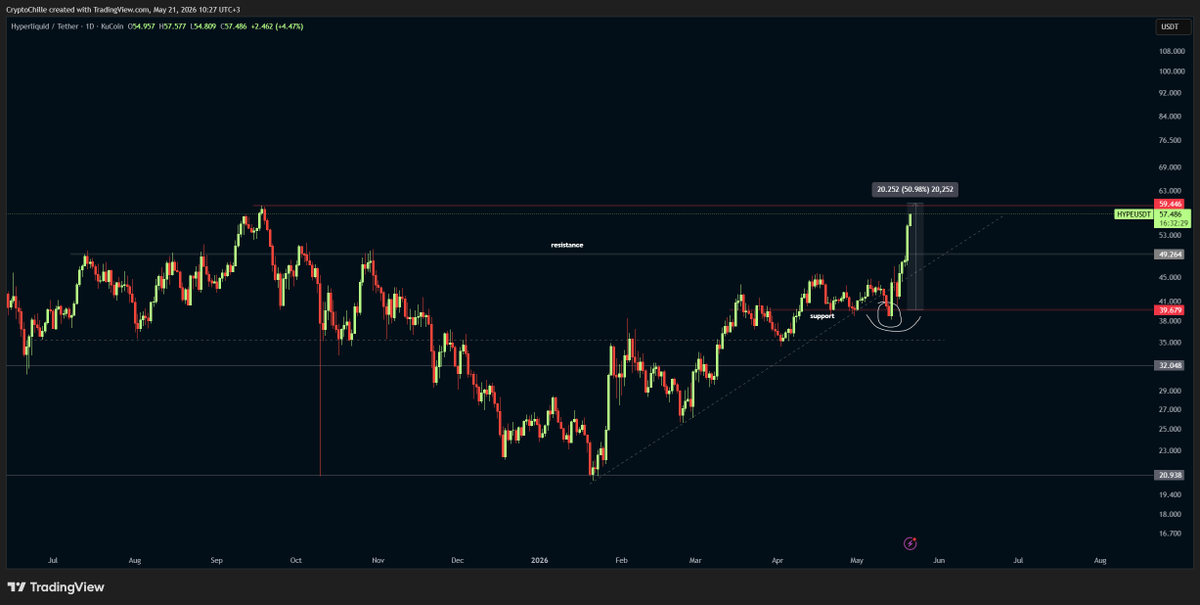
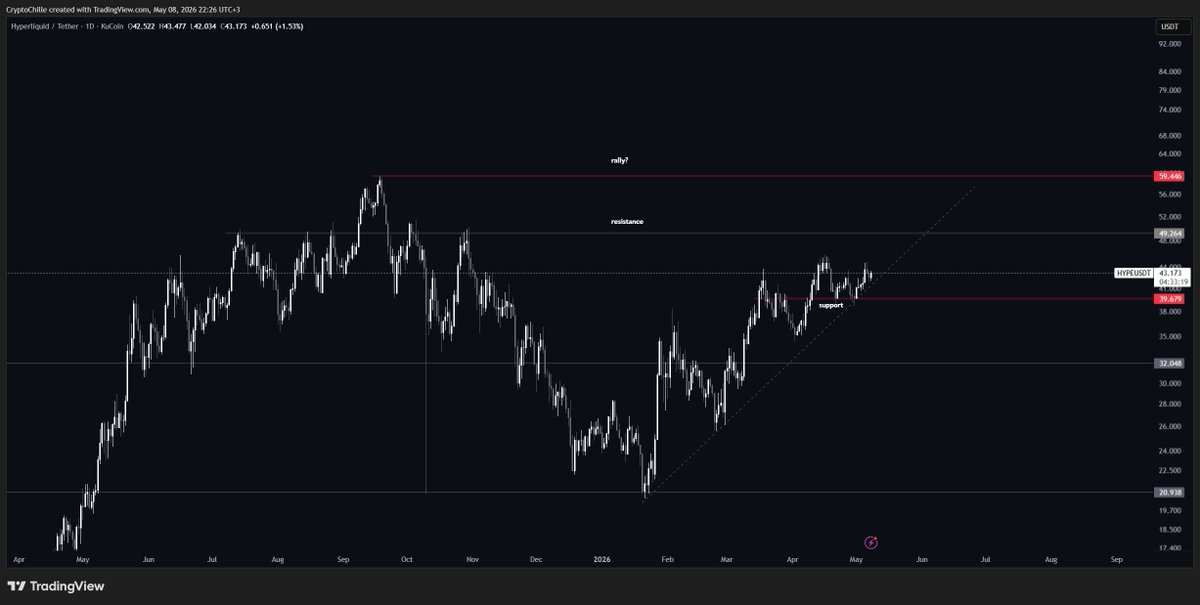
$HYPE 50%
even with a slight margin of error on the support level, it moved exactly as expected and came close to ath.
hyperliquid:native
sitting above a strong trend support. structure stays positive as long as it holds. could run toward resistance from here, and if that breaks, a rally becomes a real possibility. worth watching.
1
3
47
6,342
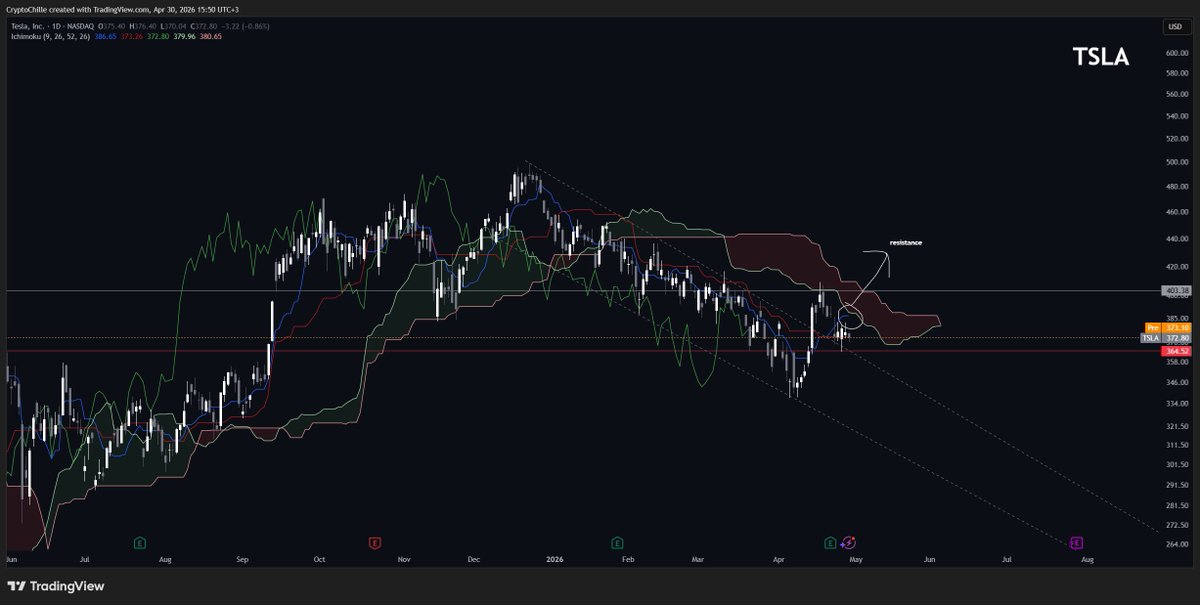
$TSLA 14%
crypto is a relatively easy market, but pulling these kinds of returns in a short time on nasdaq is a genuinely impressive achievement.
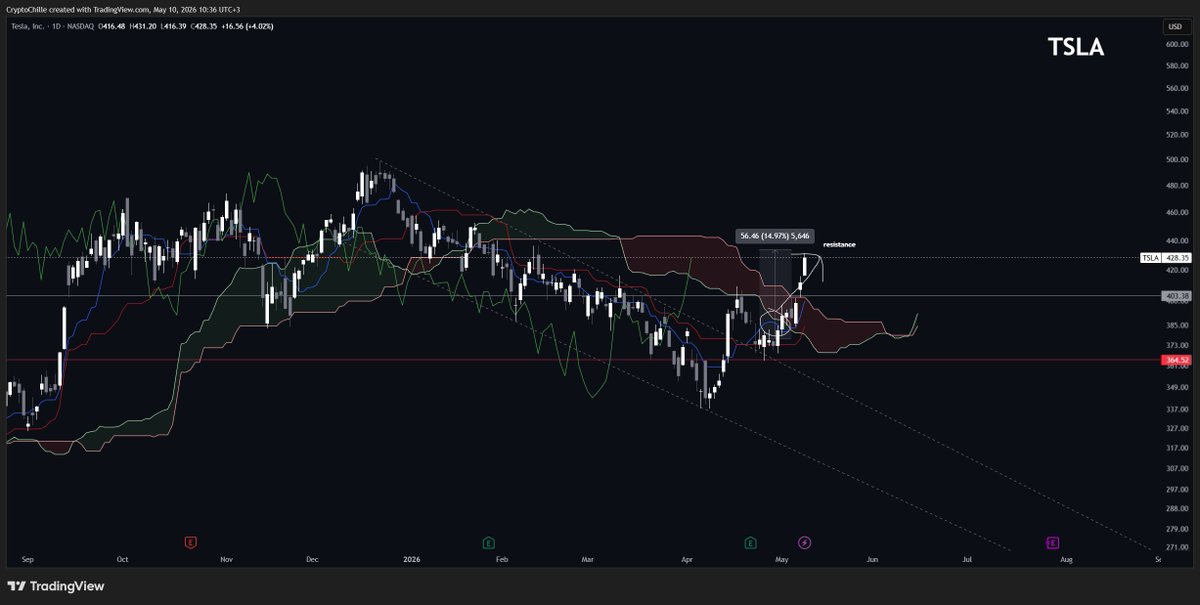
$TSLA
below resistance, structure is negative. but as long as price holds above the trend line, a breakout remains on the table. if that resistance breaks, the move could be sharp. worth watching.
2
40
7,891