
🔍 A platform for cryptocurrency order flow and futures contract data analysis. App download: coinank.com/download | Linktree: linktr.ee/coinank
Joined May 2021
- Tweets 4,610
- Following 227
- Followers 20,131
- Likes 2,524
2,164 Photos and videos


CoinAnk retweeted
#BTC Liquidation Map 1D
The expected $65,000 liquidation occurred quite forcefully at the start of the week, and the market will target strong liquidations at the $67,000 and $63,500 levels during the US market open.

#Bitcoin The entire area, which was 65 thousand dollars, was liquidated, this was clearly discussed before ✅

5
11
204
22,379
CoinAnk Pro Chart just got a new sidebar: Tutorial.
Every pattern. Every indicator. Every structure — explained in context, right next to your chart.
Candlesticks, Technical Indicators, ICT Structure, Order Flow, Volume.
Browse the category, read the definition, see the chart breakdown.
Then hit "Identify on chart" — and watch it find every matching pattern on your current chart automatically.
👉:coinank.com/proChart?exchang…
15
4
24
19,968
Before you look at the chart, look at this.
CoinAnk Contract Radar scans 80 symbols and surfaces the anomalies worth acting on.
CVD Reversal. OI Spike. Liquidation Cluster. Extreme Funding.
Ranked by strength. Updated in real time.
PROS signaling CVD Reversal at strength 100.
BTC liquidation cluster sitting 0.41% away.
The opportunity is already flagged.
18
5
36
3,292
CoinAnk retweeted

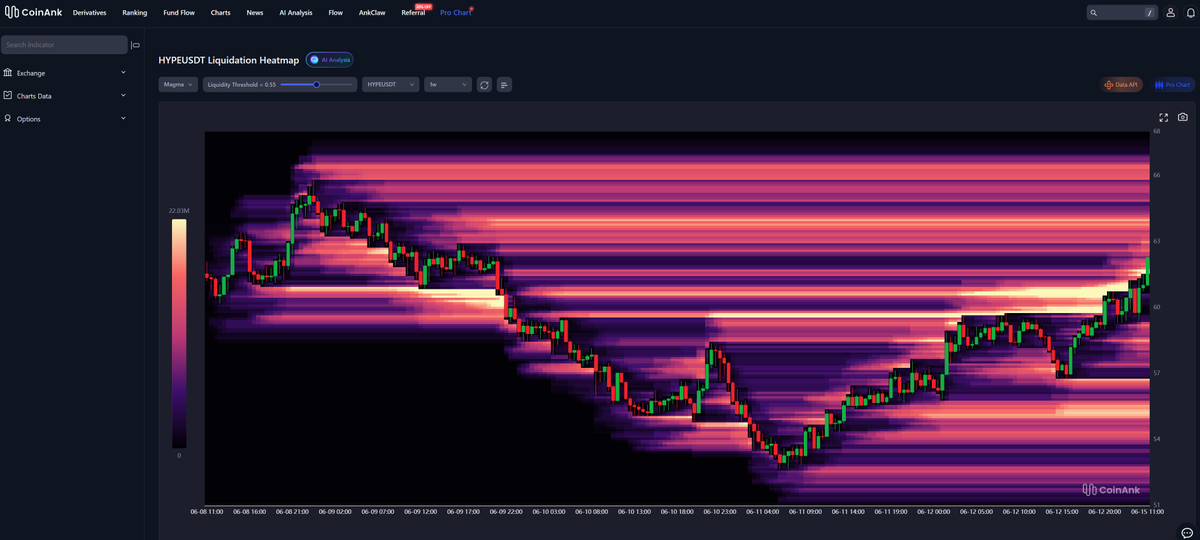
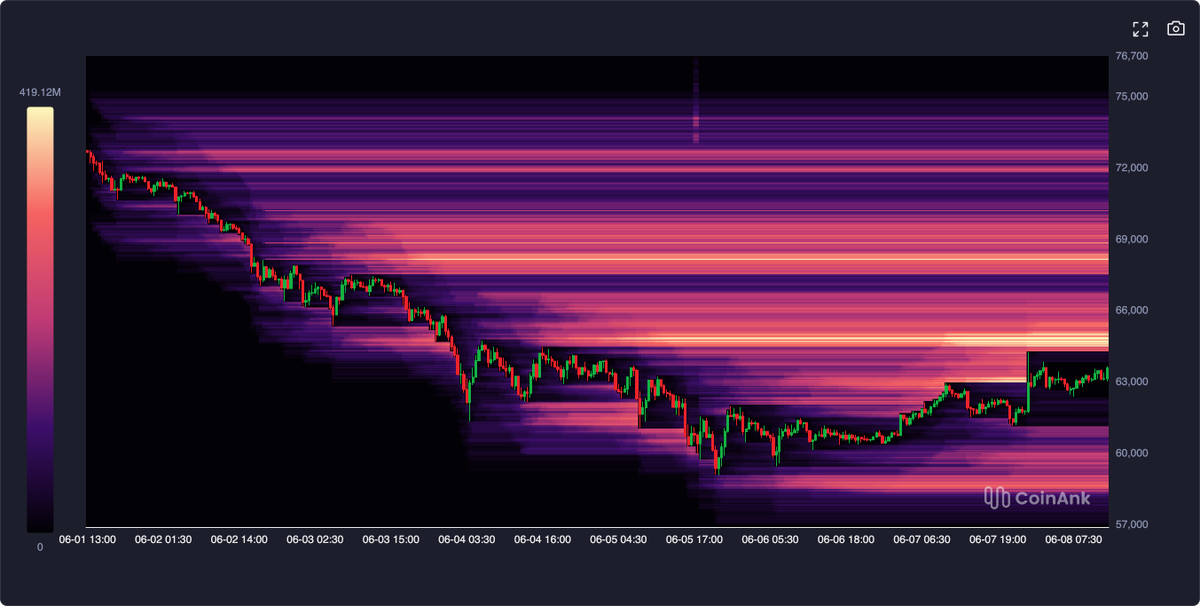
hyperliquid:native Liquidation Heatmap – Past 7 Days
Over the last week, hyperliquid:native saw a sharp correction from the $66 zone down to the $54 low, followed by a strong recovery that has now pushed price back above $62. The heatmap clearly highlights where the heaviest liquidations occurred — the bright yellow/white zones mark the exact price levels and time periods where leveraged positions were wiped out in large volumes.
Key takeaways from the chart:
Major liquidation cluster formed during the June 10–11 drop, acting as a temporary liquidity vacuum.
Price found strong support in the $54–$55 range where liquidation intensity peaked.
Current rebound is accompanied by thinning liquidation density above $60, suggesting the market has cleared a large portion of weak hands.
Liquidation heatmaps like this are powerful for spotting potential reversal zones and understanding where the next wave of liquidations could be triggered.
3
6
13
457
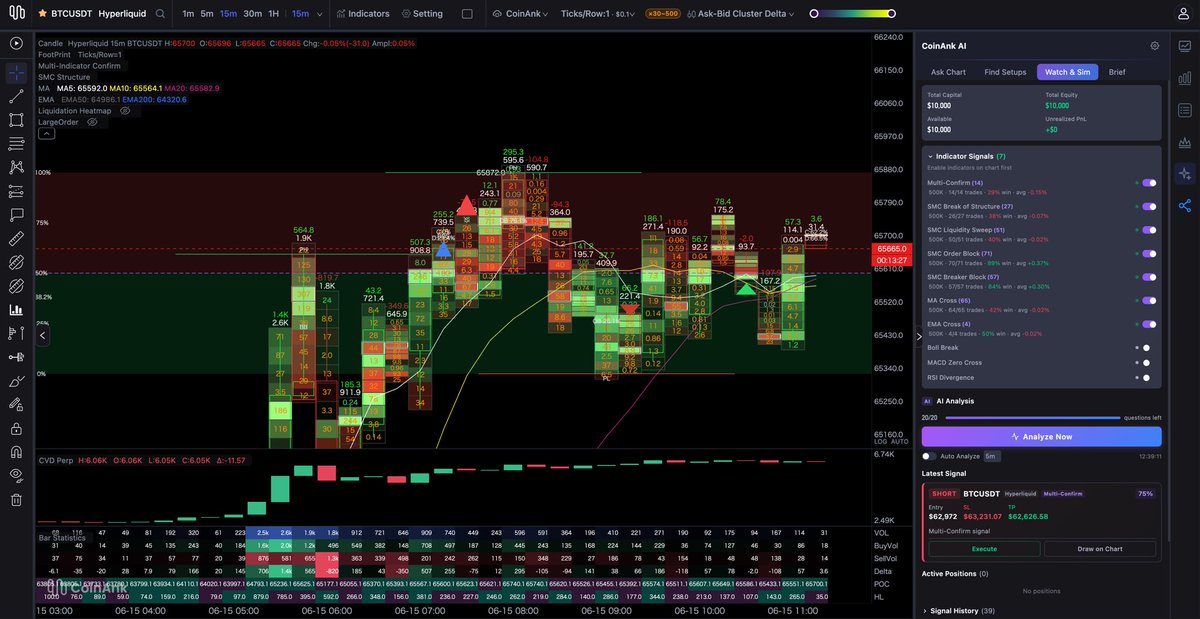
Today’s $BTC Footprint Chart
MAs compressed into a tight band at 65,564–65,592.
Price pressing into heavy sell clusters at 65,700–65,880.
CVD Perp holding positive at 6.06K.
Delta just turned negative. Buyers slowing down.
EMA200 at $64,320 — well below. Structure intact.
Compression at resistance. Something has to give.
16
3
27
3,744
Good data belongs everywhere the action is.
@okx @XLayerOfficial, CoinAnk is in!⚽
Jun 11

We’re pleased to welcome our partners as co-hosts for The Beautiful Game ⚽
Together, we’re expanding @OKX’s World Cup Outcomes campaign - bringing more rewards and broader global reach across product, social, and community channels.
More to come.

30
10
51
8,711
CoinAnk retweeted

Jun 11
All eyes are on the upside liquidity in BTC.
Around 64.6K, there is a 2.68B$ short liquidity cluster. The market usually does not ignore such a clear pool.
Downside risk is still there, but in the short term, the main magnet looks like the 64K–65K zone.
#BTC
Jun 11
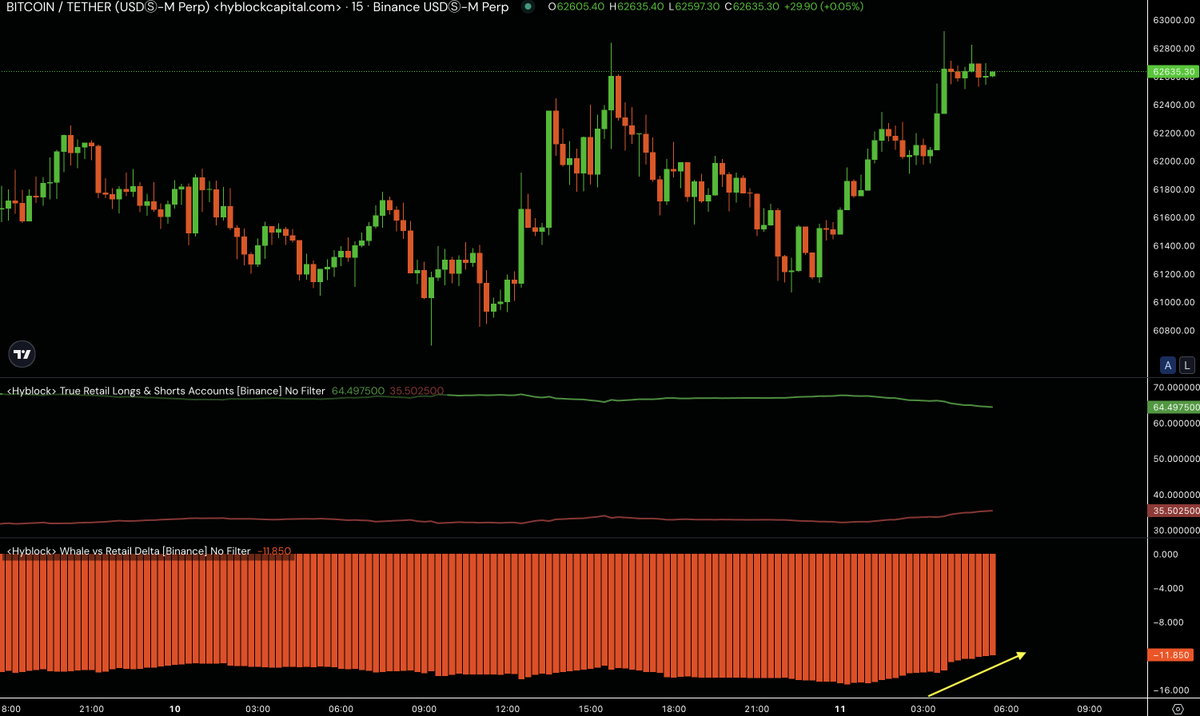
BTC is holding around the 62.6K zone while retail longs remain elevated: 64.5% long vs 35.5% short.
Despite that, the whale/retail delta is recovering from the negative zone. Price is compressing upward; the key question now is which side of liquidity gets cleared first. #BTC
11
9
196
18,234
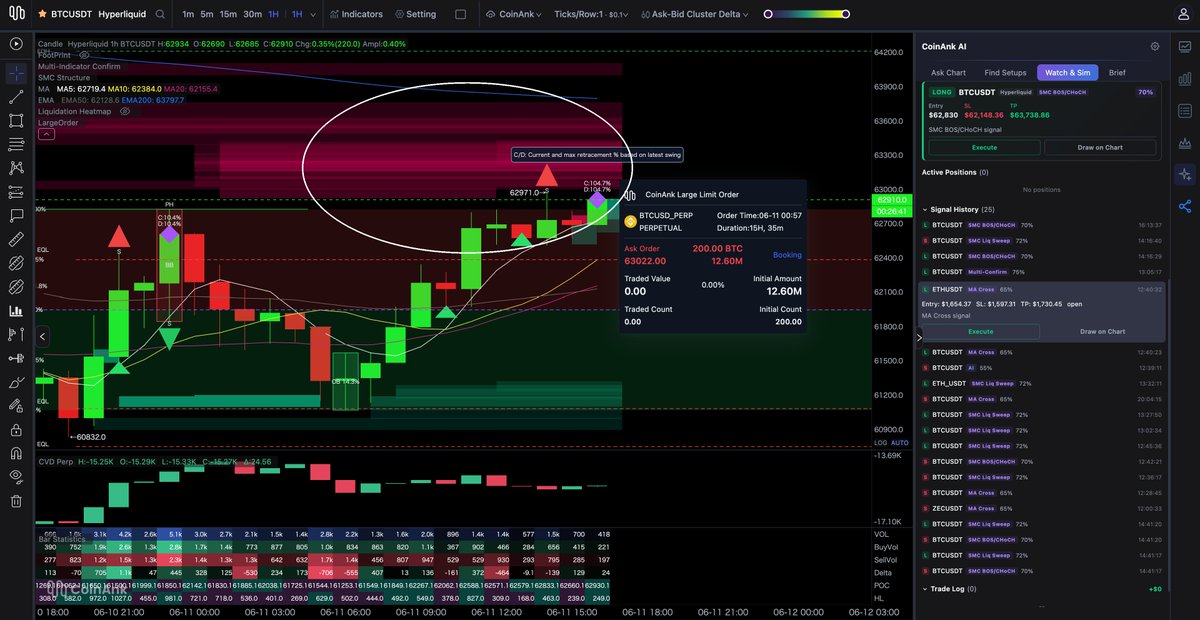
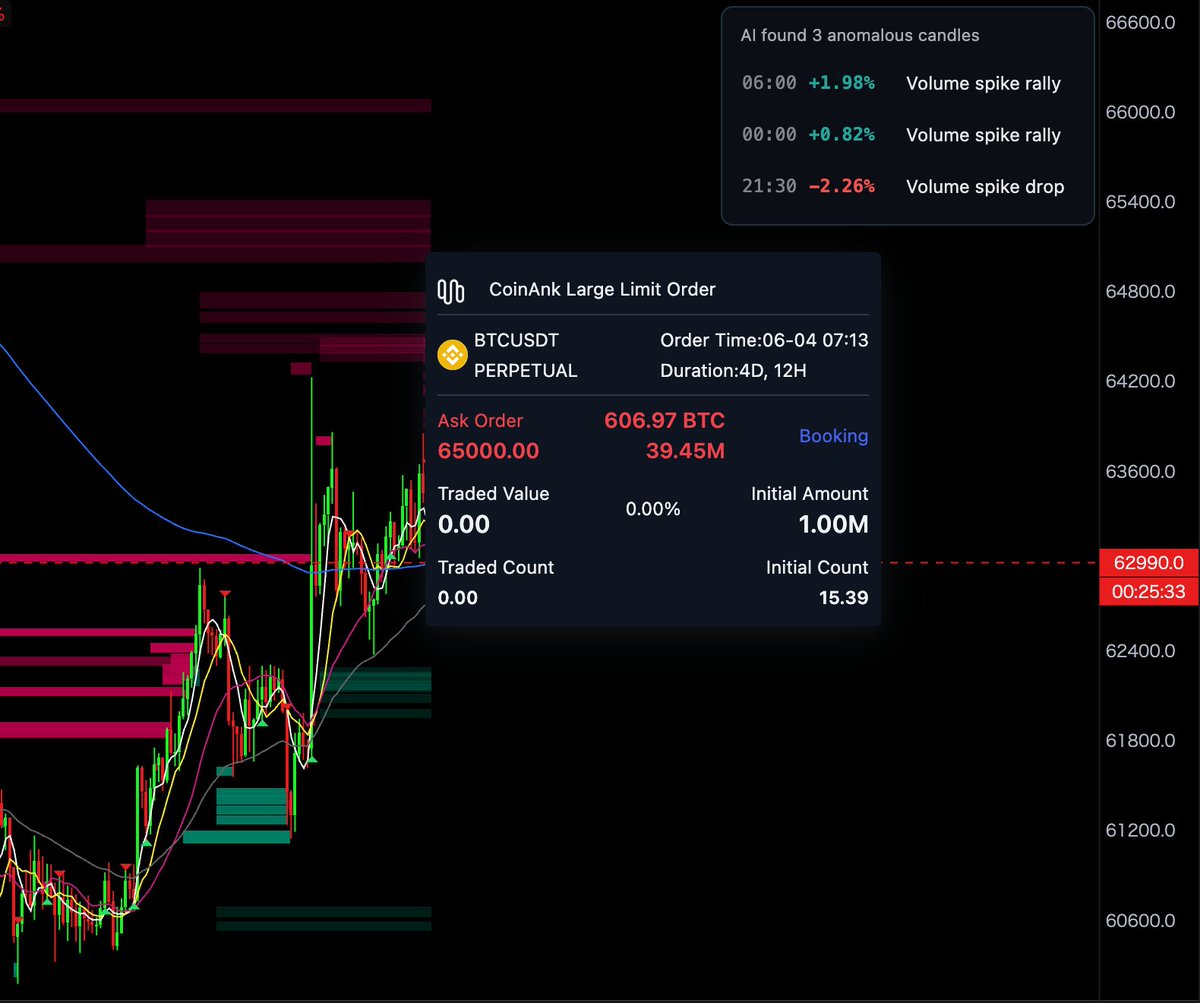
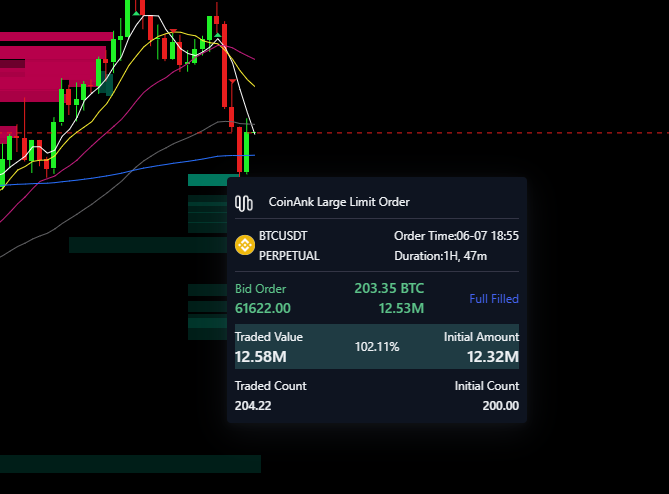
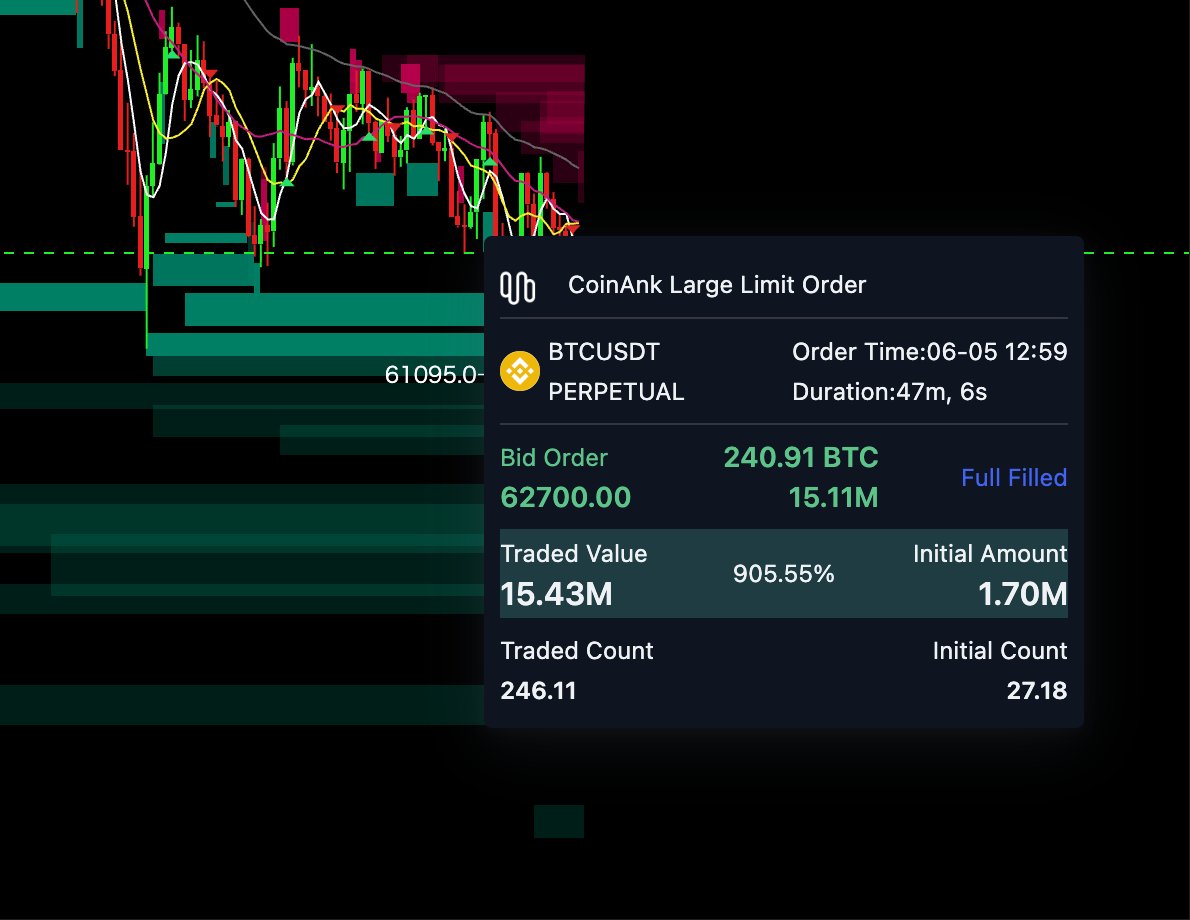
$BTC Large Limit Order Alert
A $12.60M ask wall sitting at 63,022 on Hyperliquid. Placed 15 hours ago — still 0% filled.
Look above it.
The liquidation heatmap shows a massive cluster stacked between 63,000–63,900. Stops, liquidations, orders — all piled into the same zone.
Price is at 62,910. One push away.
35
11
52
5,393
Today's $BTC Footprint Chart
Low printed at $60,733. Large buy clusters absorbed the drop. MA5/10/20 all flipped below price — short-term structure shifted.
CVD still negative. Sell pressure fading, not gone.
EMA200 at $63,843 remains the ceiling.
Bottom absorbed. Recovery in progress. Ceiling unchanged.
30
13
43
4,466
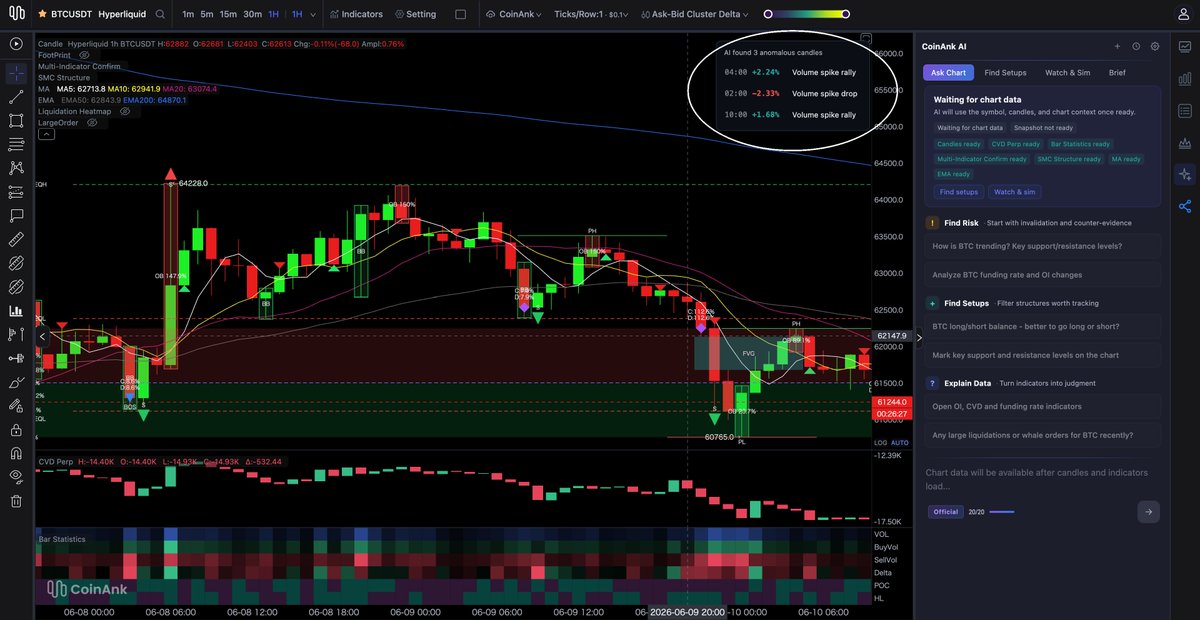
CoinAnk AI anomalous candle detection, now powered by Claude Fable 5
Sharper signals. Less noise. More precise reads on the candles that actually matter.
Fable 5 dropped yesterday. CoinAnk moved yesterday.
TRY NOW
coinank.com/proChart?exchang…
49
14
45
13,752
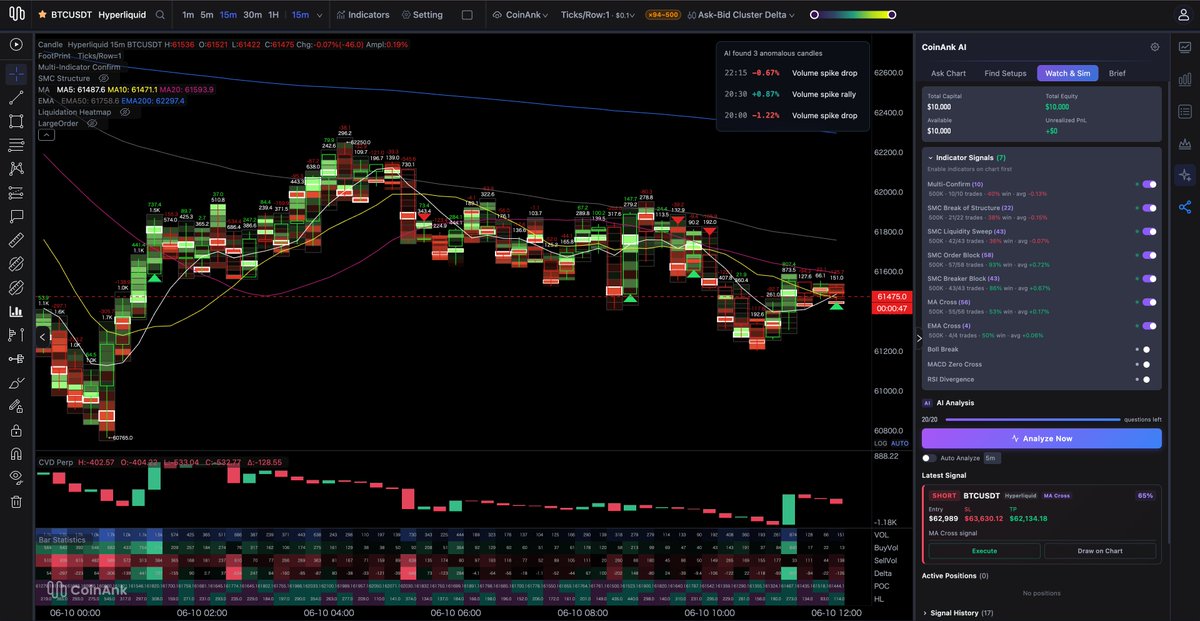
Today’s $BTC Footprint Chart
MAs compressed at 61,471–61,593. No direction — just pressure.
Sell clusters dominating every bounce attempt.
CVD Perp at -402. Delta still negative.
EMA200 at $62,297 — untouched from below.
Buyers showed up at $60,765. Didn’t hold.
Structure hasn’t changed.
30
9
44
2,769
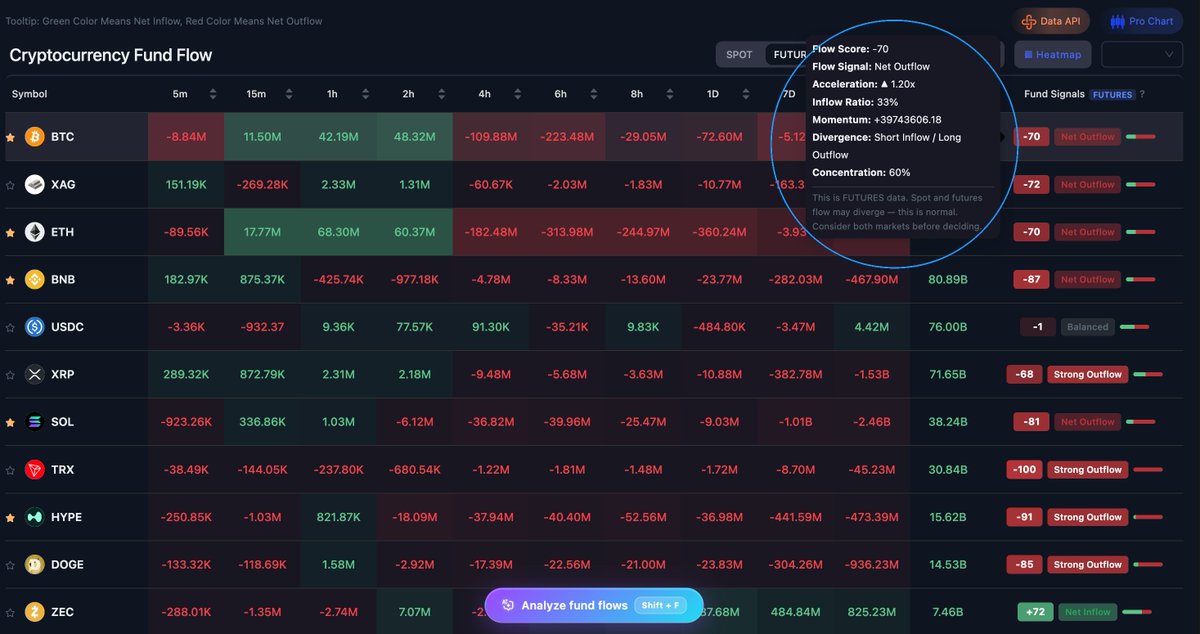
Most fund flow tools give you one number.
CoinAnk breaks it down.
Flow Score. Acceleration. Inflow Ratio. Momentum. Divergence. Concentration.
Six dimensions behind every signal.
$BTC showing Short Inflow / Long Outflow divergence at 60% concentration.
That’s not just outflow — that’s a specific kind of pressure.
30
17
46
2,922

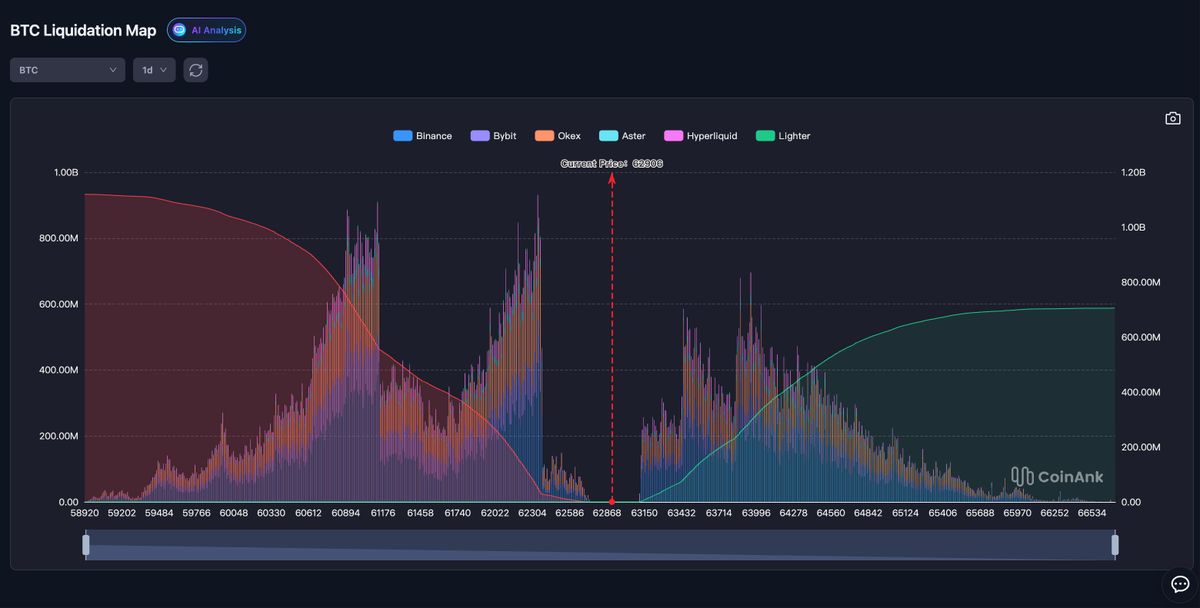
Last week $BTC was right in a liquidity vacuum around $69k-$70k.
This week price corrected sharply to $62,306, breaking through that support.
Updated BTC Liquidation Map: the heavy clusters have shifted lower. Dense multi-exchange spikes (Binance, Bybit, OKX leading) are now concentrated in the $60k-$62.3k zone below current price. Above $62.3k the density thins out noticeably, with only gradual building in the green (Lighter) area further up.
The focus is on the active zone around current levels.

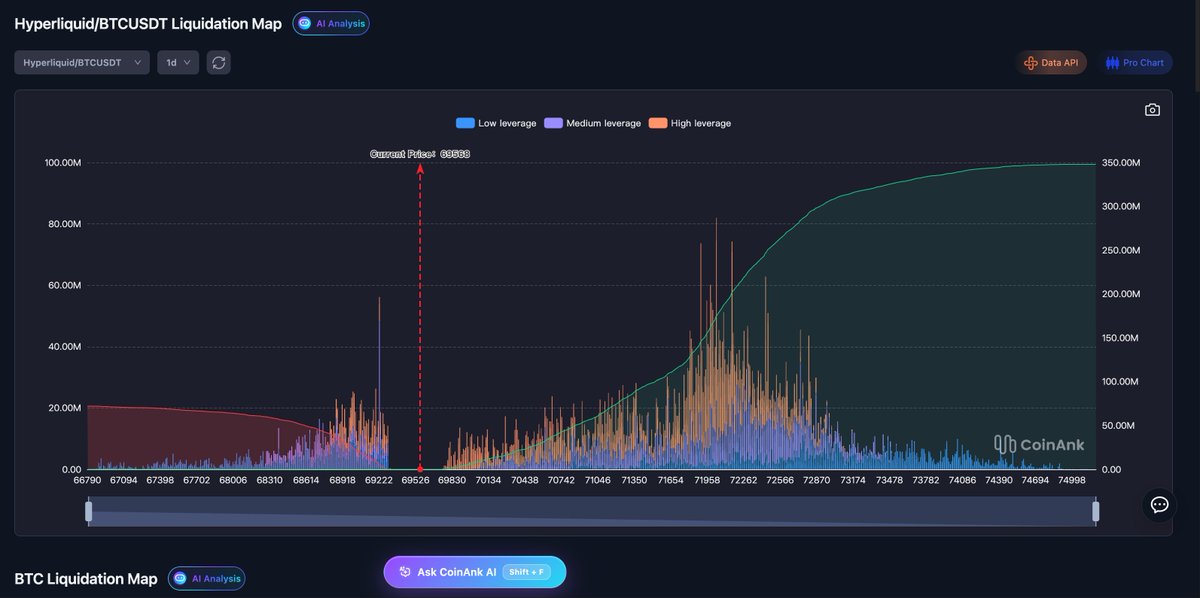
$BTC is right in a liquidity vacuum.
But above $69,830, high-leverage longs start stacking all the way to $74,998 — the densest cluster sits between $71,000 and $73,000.
CoinAnk AI read the map and flagged it directly: the upper zone has significantly more liquidation orders than the lower.
If the price breaks above $69,830, the cascade goes up.
Below, $68,900 is the nearest support cluster. If that gives way, momentum builds fast.
Ask CoinAnk AI yourself — Shift F, anywhere on the platform.
👉 coinank.com
31
13
44
4,711
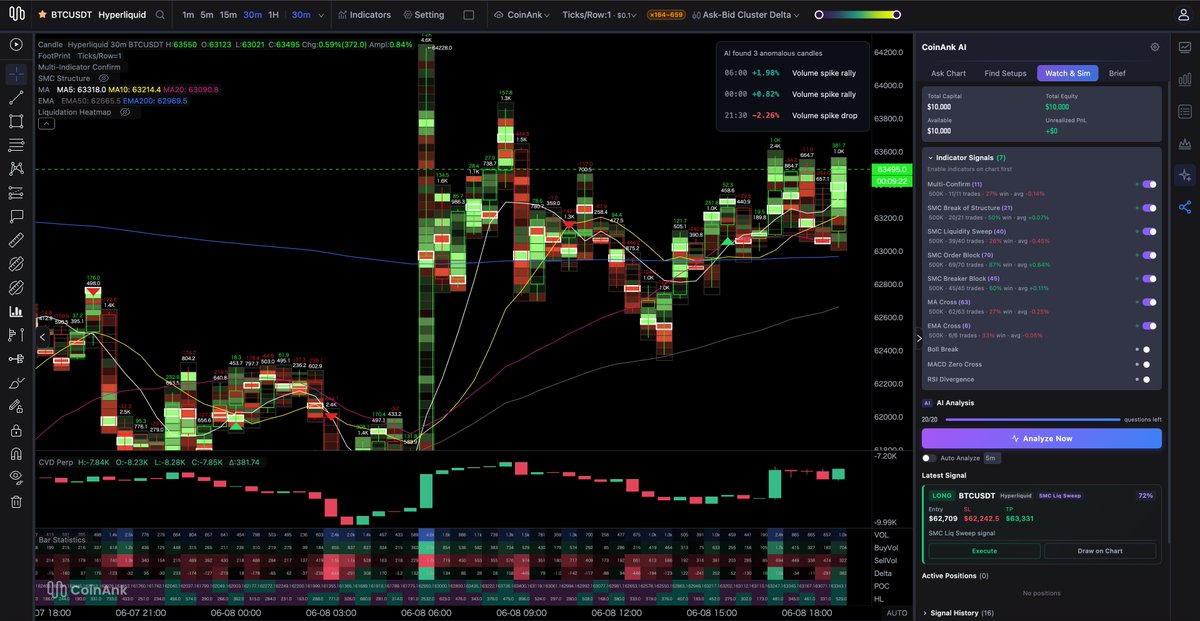
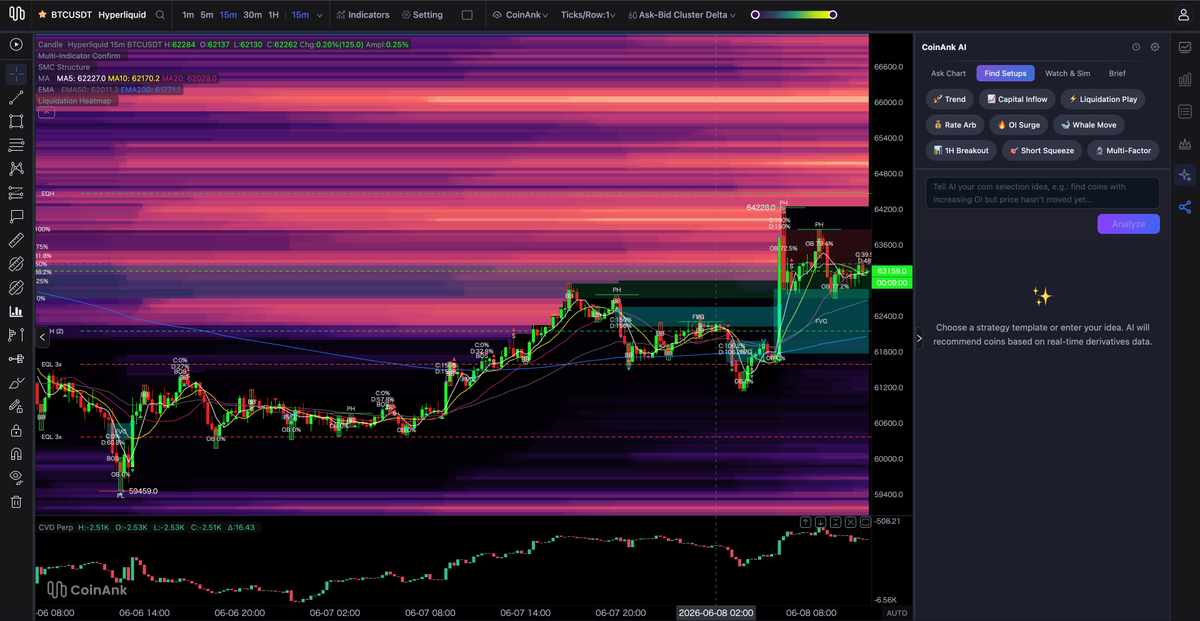
Most traders read the chart alone.
Open the Liquidation Heatmap — you see where the stops are.
Open CoinAnk AI — you see what setups are forming.
Same chart. Three layers of context.
That’s the difference
coinank.com/proChart?exchang…
25
34
72
4,351