
Joined November 2021
- Tweets 2,700
- Following 1,596
- Followers 32,098
- Likes 11,564
160 Photos and videos


Matt Cole retweeted
The purpose of the @HurdleRatePod is viewing the world through the lens of a Bitcoin hurdle rate, so all 61 episodes are relevant and build off each other.
In addition, @Strive and @unchained did a collaborative research report building a framework for viewing investments through a bitcoin lens using a bitcoin-denominated discounted cash flow (DCF) model.
Joe was at Unchained when the report was written, but now both of the primary authors, @IIICapital and @CNicholson1988, work at Strive.
The report can be found here:
unchained.com/go/repricing-t…
2
4
78
Fidelity and Robinhood:
x.com/west_linux/status/2067…

I had mine before open with Fidelity, I think Robinhood was mid day or end of day.
1
23
2,725
Matt Cole retweeted

20
65
10,396
Matt Cole retweeted

Welcome Back to The Hurdle Rate.
Episode 61: What’s Your Time Preference?
In this week's Hurdle Rate, the crew breaks down the latest corporate Bitcoin market activity and Strive's growing Bitcoin holdings, before turning to Strategy's Bitcoin sale and what the balance sheet math actually reveals about risk and permanent impairment. We dig into historical bear market scenarios, how to manage amplification ratios, and the product management and demand dynamics shaping the treasury company landscape. We close with a deeper look at what digital credit actually is, and why it matters for the road ahead.
Here's the latest with @ColeMacro, @PunterJeff, @Werkman and @TimKotzman.
00:00 Welcome to the Hurdle Rate Podcast
01:44 Market Acceleration and USD Reserves
06:04 Holistic Capital Structure Strategy
12:20 Designing Long-Term Capital Vehicles
17:21 Analyzing Recent Bitcoin Flows
18:11 SpaceX IPO and Major Capital Events
29:18 Bitcoin on Institutional Balance Sheets
36:51 Takeaways from Bitcoin Prague
41:20 Onboarding New Investors via Digital Credit
16
28
223
63,318

13h
GM


14
17
234
9,472

Matt Cole retweeted

Jun 15
$SATA Closed at $100.01
$77 million in volume
Probably nothing
The Daily Dividend Company ™️

52
96
1,463
40,833
Jun 15
I hereby declare the first day of daily dividends a success.
$SATA is…back at $100
Volume up 🎵
46
104
1,479
29,834
Matt Cole retweeted

If you’re struggling to understand how SATA and STRC work, watch the first episode of Roundtable Uncut with @Strive CEO Matt Cole (@ColeMacro)
Really excited to start this series off with such a great guest. Stay tuned for more.
WATCH NOW ON @RTB_io: roundtable.io/shortUrl/0aPc4…

5
19
79
10,069

Matt Cole retweeted
Jun 15
Inaccurate.
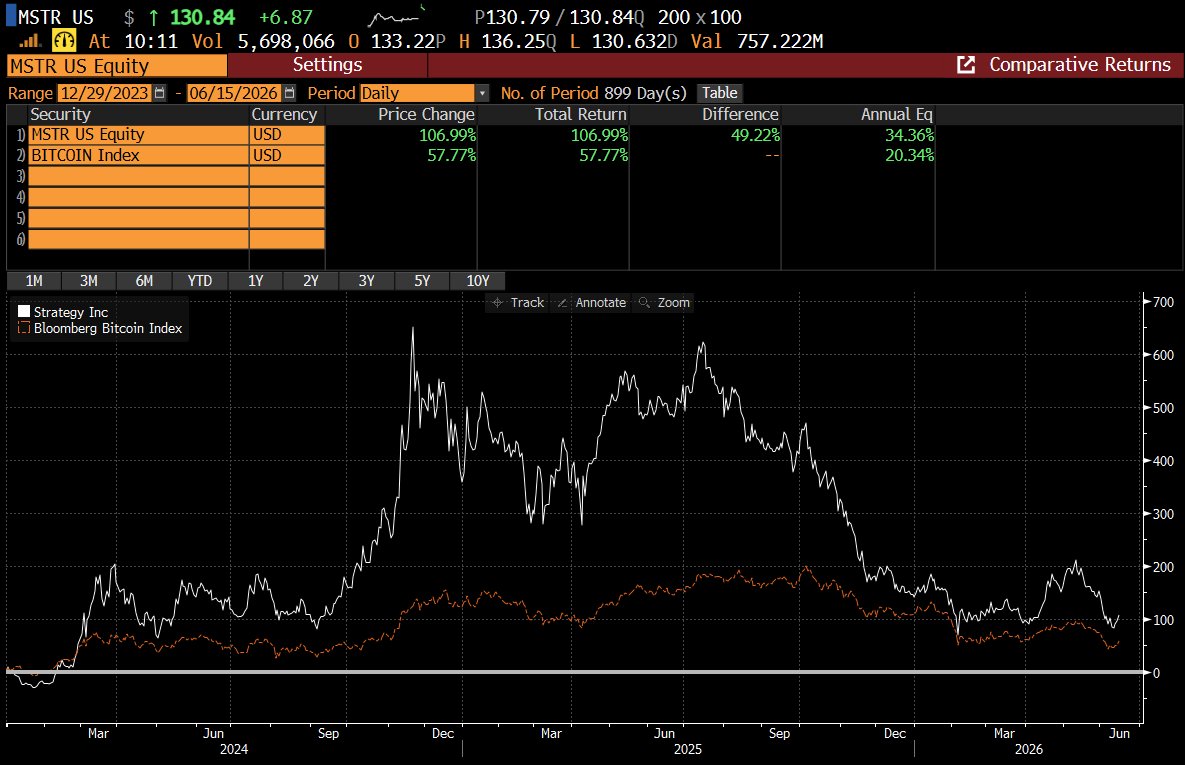
Since the start of 2024, $MSTR has outperformed Bitcoin by 49%, about ~1.7x of Bitcoin total return annualized.
Most importantly, MSTR has outperformed BTC since inception in 2020.
A well executed amplified BTC strategy is great for low time preference investors.
10
33
367
35,905


Next week is going to be a big one for $ASST.
Strive will become the first American company ever to pay a daily dividend.
The attention this will attract is hard to overstate.
Dividend investor communities, FIRE movement followers, income focused YouTubers and social media creators who have never touched Bitcoin in their lives are about to discover $SATA.
13% yield, paid daily.
The audience is enormous and they are about to find out this product exists.
38
49
602
24,119
Jun 14
No single metric tells a full financial picture. The key is understanding the differences and how to use them.
Strive’s two annual KPIs are:
1. Increase Bitcoin per common share before senior claims.
2. Pay all obligations on time, such as interest from $SATA.
We believe if we achieve those two KPIs annually the company will outperform Bitcoin over the long run, which is our long term and most important KPI.
The KPIs, when combined, require viewing the world both from the growth and risk perspective, but the core thesis behind this strategy requires believing in the debasement trade and Bitcoin. I believe focusing on the growth story while modeling the risks is better than focusing on the risks then modeling the growth story. You can achieve a complete view whether you start with standard BPS or CEBE BPS.
Like in any market, intelligent investors will disagree in what makes the best framework, which is why it’s important for the industry to provide raw data for investors to do their own analysis with their preferred way to view the data.
Lastly and importantly, if you finish the math, both analysis paths work and show how the strategy of amplification from Digital Credit can systematically outperform Bitcoin over time.
Jun 14

BPS measures Bitcoin per common share before senior claims. CEBE BPS measures Bitcoin per common share after senior claims. CEBE is the conservative risk metric. BPS is the common equity growth metric. BTC Yield measures BPS execution.
19
53
417
55,189
Jun 13
We debate mNAV, but never forget why we are here.
Consumer sentiment is at an all-time low, because the money is broken, but we can just fix that.
Building the human renaissance.
One team.
17
27
353
10,322