
1 Aug 2025
We had monitoring based on this:
learn.microsoft.com/en-us/az…
KQL starting point:
Usage
| where TimeGenerated > ago(30d)
| where IsBillable == true
| summarize BillableDataGB = sum(Quantity) / 1000 by bin(StartTime, 1d), DataType
| render columnchart
7
263

7 Jan 2025
This KQL query might be useful for some:
Event
| where TimeGenerated > ago(7d)
| where Computer contains "APOLLO"
| where EventLog == "System" or EventLog == "Application"
| project TimeGenerated, EventID=tostring(EventID)
| summarize Count=count() by EventID, bin(TimeGenerated, 1d)
| render columnchart
2
10
2,257
9 Oct 2024
detecting a password spray....
let's think: event ID 4625 to start with....
but this one gets complex! again I think there is a sentinel rule for this! the speed of the attackers matters... so does the source...
SecurityEvent
| where TimeGenerated > ago(90d)
| where EventID == '4625'
| summarize count() by bin(TimeGenerated, 1h)
| render columnchart
1
14
4,129
9 Oct 2024
Some more ADCS abuse:
This will show up on your domain controllers!
Event
| where TimeGenerated > ago(90d)
| where EventLog == 'System'
| where EventID == '39'
| summarize count() by bin(TimeGenerated, 1h), Computer
| render columnchart
1
18
3,886
9 Oct 2024
Now let's look for TGT requests:
SecurityEvent
| where TimeGenerated > ago(30d)
| where EventID == 4768
| summarize count() by bin(TimeGenerated, 1m)
| render columnchart
1
26
5,279
14 Mar 2024
SigninLogs
| where TimeGenerated > ago(90d)
| summarize AlertCount=count() by bin(TimeGenerated, 1d)
| sort by TimeGenerated desc
| render columnchart
4
738

8 Dec 2023
Got Azure Log Analaytics Workspace? Ingesting Domain Controller security event logs? Make NTLM password spray stand out like a sore thumb!
SecurityEvent
| where TimeGenerated < ago(24h)
| where EventID == "4625"
| where AuthenticationPackageName == "NTLM"
| render columnchart
2
12
88
12,292

24 Apr 2023
Another amazing @VizzuHQ chart! 🥰
Check out this new Vizzu template to create your next Stack column chart for analysis and survey results display: buff.ly/41AAOmL 😁
#data #visualization #chart #columnchart #stackedcolumnchart #vizzu

3
154
12 Apr 2023
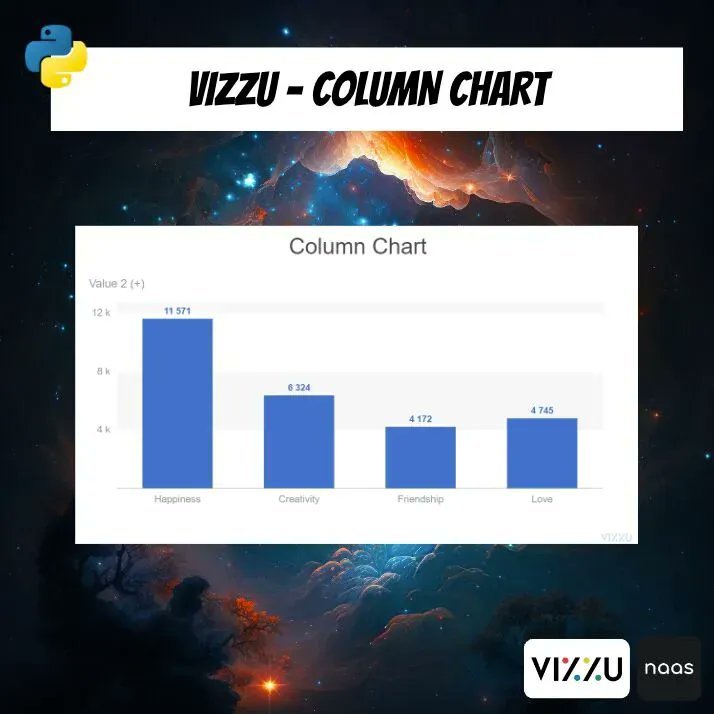
Create awesome column charts with @VizzuHQ! 😇
This script allows you to quickly create beautiful column charts with Vizzu for comparing data across different categories or groups.
Try it right now: buff.ly/3zQffD5
#columnchart #dataviz #visualization #dataanalytics
1
1
5
2,057

2 Feb 2023
Render columnchart from #KQL query in @AzDataExplorer
#365daysofADX Day33
Column charts are used for comparing specific subcategory items in a main category range, where the length of each line represents its value.
Learn more: learn.microsoft.com/en-us/az…
#Kusto #ADX #Azure #Data
1
2
109
10 Jan 2023
#####################
#Check Sucesss via country
###########################
IdentityLogonEvents
| where TimeGenerated > ago(90d)
| where ActionType != "LogonFailed"
| where LogonType == "OAuth2:Token"
| summarize count() by bin(TimeGenerated, 1d), Location
| render columnchart
1
2
12
2,437
10 Jan 2023
# Check you haven't been brute forced
####################
IdentityLogonEvents
| where TimeGenerated > ago(90d)
| where ActionType != "LogonFailed"
| where LogonType == "OAuth2:Token"
| summarize count() by bin(TimeGenerated, 1d), AccountName
| render columnchart
1
4
20
2,591
10 Jan 2023
anyone wanna check something for me? #Office365 #threats
IdentityLogonEvents
| where TimeGenerated > ago(90d)
| where ActionType == "LogonFailed"
| where LogonType == "OAuth2:Token"
| summarize count() by bin(TimeGenerated, 1d), AccountName
| render columnchart
20
48
235
77,163

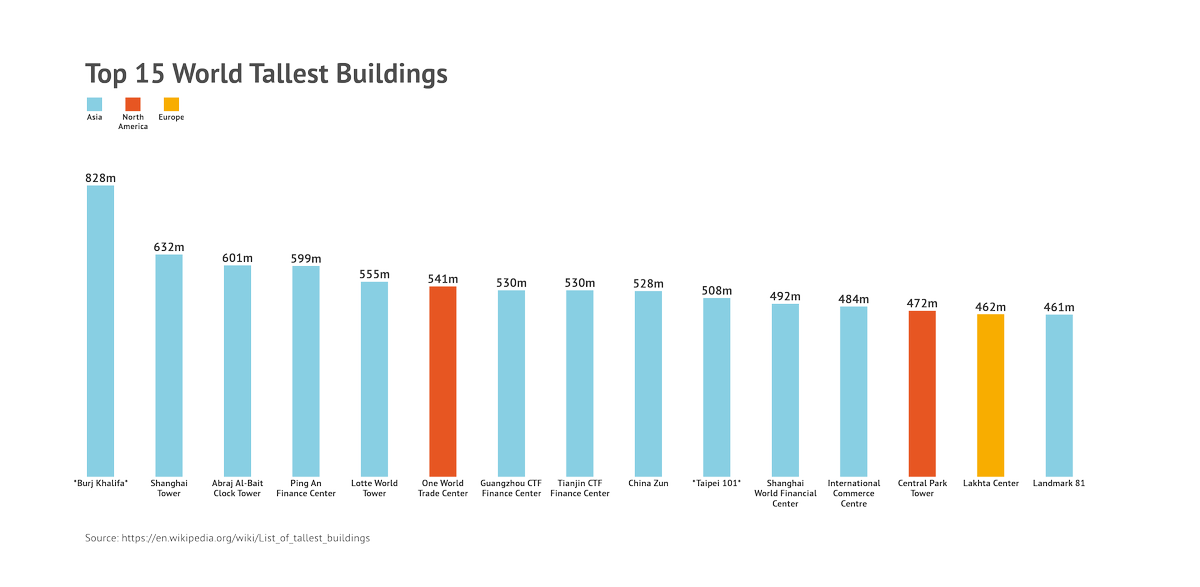
'Top 15 World tallest buildings.' 🌇
🔎 insights.datylon.com/stories…
The design was created with Datylon for Illustrator, a chart maker AI plug-in for dataviz & graphic designers.
#designthinking #datavisualization #columnchart #bargraph #dataviz #chartmaker #graphicdesign
1
2

14 Jun 2022
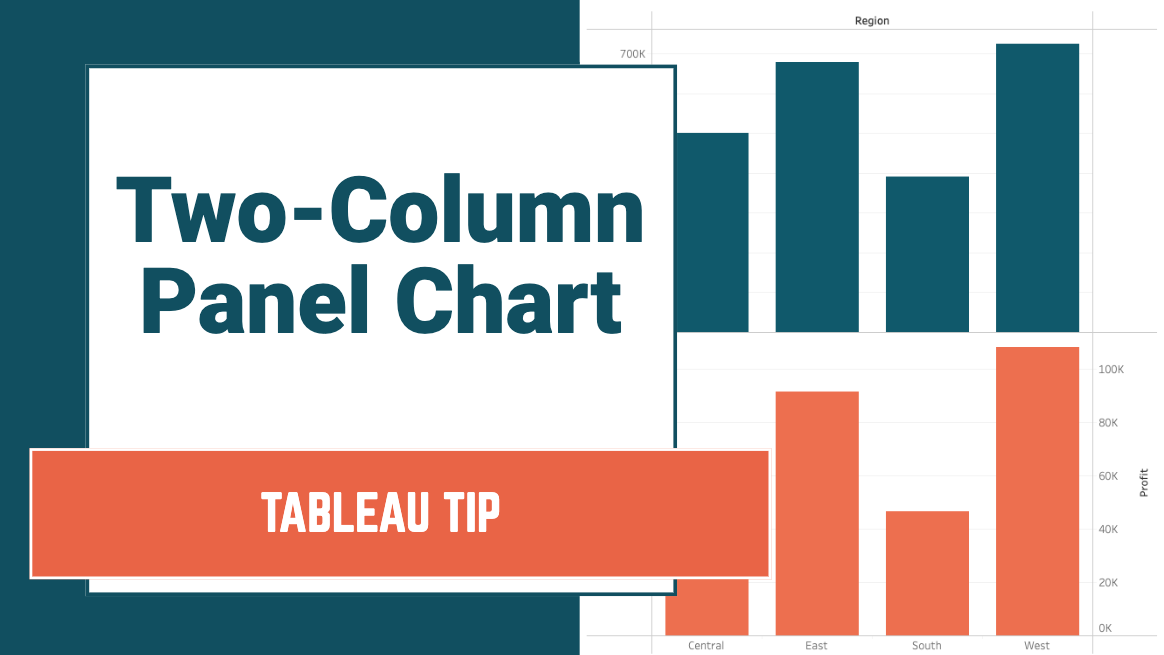
#TableauTip: How to create a column chart that displays one data series on the primary axis in one row and another data series on the secondary axis on the second row
youtu.be/Tabu0Uut9Mw
#tableau #tip #dualaxis #columnchart #barchart
3
16

19 Apr 2022
Advanced render option with #kql
Example:
| render columnchart
with (
kind=unstacked,
xtitle="Day", // x-axis of chart
ytitle="Count", // y-axis of chart
title="TITLE")
#Azuresentinel #MSSentinel #Sentinel #Kustoquery #KQL
3
12

26 Aug 2021
With so many ways to visualize and analyze data in BI dashboards, it can be difficult to decide the best approach for the final result.
Learn how to create and customize 4 types of column charts in a Wyn Enterprise dashboard: bit.ly/2WlEEVe
#bidashboards #columnchart

1
2


17 Mar 2021
file('%SystemDrive%\users\*\AppData\Local\Microsoft\Teams\current\teams.exe')
| summarize count() by Version
| order by version
| render columnchart with(title='Teams versions', ytitle='Count')
1
3
10 Mar 2021
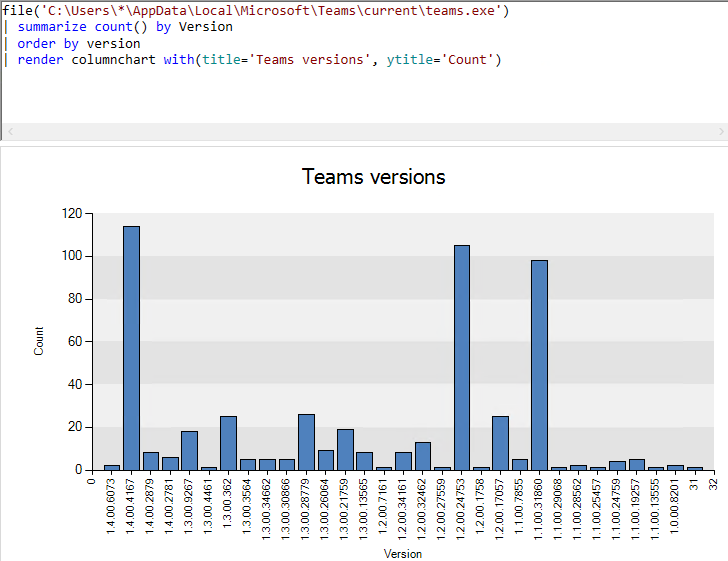
Here is a simple #MEMCM CMPivot query to find installed #MSTeams versions (only online devices):
file('C:\Users\*\AppData\Local\Microsoft\Teams\current\teams.exe')
| summarize count() by Version
| order by version
| render columnchart with(title='Teams versions', ytitle='Count')
7
37
123