
May 31
ChatGPT経由の訪問レポートを表示するURL
(/store/の後ろにある{store-handle} 部分を確認したいストアのものに変えてください)
admin.shopify.com/store/{store-handle}/analytics/reports/explore?ql=FROM sessions
SHOW sessions, bounce_rate, pageviews, added_to_cart_rate,
reached_checkout_rate, completed_checkout_rate, conversion_rate
WHERE agentic_referring_channel = 'ChatGPT'
TIMESERIES day WITH TOTALS
SINCE startOfDay(-90d) UNTIL today
ORDER BY day ASC
VISUALIZE sessions
2
257

May 20
Data Analyst Interview Questions with Answers — Part 7 🚀
🔍 Advanced Analytics & SQL Patterns
61. How do you compute month-on-month or week-on-week growth?
Growth compares current performance with a previous period.
📌 Formula:
Growth % = (Current Period - Previous Period) / Previous Period * 100
✅ Example SQL Query:
SELECT month,
revenue,
LAG(revenue) OVER (ORDER BY month) AS previous_month,
ROUND(
((revenue - LAG(revenue) OVER (ORDER BY month))
/ LAG(revenue) OVER (ORDER BY month)) * 100,
2
) AS mom_growth
FROM sales;
This calculates month-on-month growth percentage.
62. How do you write a query to calculate retention or churn?
📌 Retention: Users who continue using the product
📌 Churn: Users who stop using the product
Example retention query:
SELECT signup_month,
COUNT(DISTINCT retained_user_id) * 100.0 /
COUNT(DISTINCT user_id) AS retention_rate
FROM retention_table
GROUP BY signup_month;
Retention analysis helps measure customer loyalty and product success.
63. How do you calculate LTV (Lifetime Value) conceptually?
LTV estimates the total revenue generated by a customer during their relationship with a business.
📌 Basic Formula:*
LTV = Average Purchase Value _ Average Purchase Frequency _ Average Customer Lifespan
Businesses use LTV to evaluate customer acquisition and retention strategies.
64. How do you write a funnel analysis query?
Funnel analysis tracks user progression through stages.
Example funnel:
Signup → Activation → Purchase
Example SQL:
SELECT
COUNT(DISTINCT signup_user) AS signups,
COUNT(DISTINCT activated_user) AS activations,
COUNT(DISTINCT purchased_user) AS purchases
FROM funnel_data;
Funnels help identify where users drop off.
65. How do you handle time-based aggregations?
Time aggregations summarize data daily, weekly, or monthly.
Example:
SELECT DATE_TRUNC('month', order_date) AS month,
SUM(revenue) AS total_revenue
FROM orders
GROUP BY month
ORDER BY month;
This helps track trends over time.
66. How do you compare cohorts?
Cohort analysis compares groups of users based on a shared characteristic.
Examples:
✔️ Users acquired in January vs February
✔️ Retention by signup month
✔️ Revenue by acquisition channel
Cohorts help measure long-term user behavior.
67. How do you calculate lead-time, cycle-time, or business-process metrics?
📌 Lead Time: Total time from request to completion
📌 Cycle Time: Time spent actively working on a task
Example Formula:
Lead Time = Completion Date - Request Date
Cycle Time = End Work Time - Start Work Time
These metrics help improve operational efficiency.
68. How do you implement A/B test-style analysis in SQL?
A/B testing compares two groups to measure performance differences.
Example:
SELECT test_group,
AVG(conversion_rate) AS avg_conversion
FROM experiment_results
GROUP BY test_group;
Analysts compare metrics such as:
✔️ Conversion rate
✔️ Revenue
✔️ Click-through rate
✔️ Retention
69. How do you approximate segmentation (RFM-style) in SQL?
RFM segmentation classifies customers using:
📌 Recency: How recently they purchased
📌 Frequency: How often they purchase
📌 Monetary: How much they spend
Example:
SELECT customer_id,
MAX(order_date) AS last_purchase,
COUNT(order_id) AS frequency,
SUM(amount) AS monetary
FROM orders
GROUP BY customer_id;
RFM helps identify high-value customers.
70. How do you document and version your SQL queries?
Best practices include:
✅ Use meaningful query names
✅ Add comments in SQL scripts
✅ Store queries in Git repositories
✅ Maintain version history
✅ Document assumptions and business logic
✅ Organize queries by project or folder structure
Proper documentation improves collaboration and maintainability.
🚀 Double Tap ❤️ For Part-8
(Save this before going viral).
May 20

Data Analyst Interview Questions with Answers — Part 6 🚀
🛠️ Python for Data Analysis
51. Why do data analysts use Python instead of (or along with) Excel?
Python is used because it can handle larger datasets, automate repetitive tasks, and perform advanced analysis more efficiently than Excel.
Benefits of Python:
✔️ Faster processing
✔️ Automation capabilities
✔️ Advanced analytics
✔️ Better scalability
✔️ Integration with databases and APIs
✔️ Powerful libraries like "pandas", "numpy", and "matplotlib"
Excel is great for quick analysis, while Python is better for scalable workflows.
52. How do you load data from CSV or SQL into a "pandas" DataFrame?
✅ Load CSV file:
import pandas as pd
df = pd.read_csv("sales_data.csv")
✅ Load data from SQL:
import pandas as pd
import sqlite3
conn = sqlite3.connect("company.db")
df = pd.read_sql("SELECT * FROM employees", conn)
"pandas" makes data loading and manipulation simple.
53. How do you inspect the first/last rows, shape, data types, and missing values?
Useful functions for quick inspection:
`df.head()`
`df.tail()`
`df.shape`
`df.dtypes`
`df.isnull().sum()`
These functions help analysts understand dataset structure quickly.
54. How do you clean missing values ("dropna", "fillna", interpolation)?
✅ Remove missing values:
`df.dropna()`
✅ Fill missing values:
`df.fillna(0)`
✅ Fill with mean:
`df["salary"].fillna(df["salary"].mean())`
✅ Interpolation:
`df.interpolate()`
The method depends on business context and data quality requirements.
55. How do you filter, sort, and group data with "pandas"?
✅ Filter rows:
`df[df["sales"] > 5000]`
✅ Sort values:
`df.sort_values("sales", ascending=False)`
✅ *Group data:*
`df.groupby("region")["sales"].sum()`
These operations are commonly used in real-world analysis.
56. How do you calculate aggregates and pivots with "groupby" and "pivot_table"?
✅ Aggregation using "groupby":
`df.groupby("department")["salary"].mean()`
✅ Create Pivot Table:
pd.pivot_table(
df,
values="sales",
index="region",
columns="category",
aggfunc="sum"
)
Pivot tables summarize data efficiently.
57. How do you merge/join multiple DataFrames?
DataFrames can be combined using "merge()".
Example:
pd.merge(customers, orders,
on="customer_id",
how="inner")
Join types include:
✔️ Inner Join
✔️ Left Join
✔️ Right Join
✔️ Outer Join
This is similar to SQL joins.
58. How do you create basic visualizations with "matplotlib" or "seaborn"?
✅ Line chart using "matplotlib":
import matplotlib.pyplot as plt
plt.plot(df["month"], df["sales"])
plt.show()
✅ Bar chart using "seaborn":
import seaborn as sns
sns.barplot(x="region", y="sales", data=df)
Visualizations help identify trends and patterns quickly.
59. How do you save processed data back to CSV or database?
✅ Save to CSV:*
`df.to_csv("cleaned_data.csv", index=False)`
✅ Save to SQL database:
`df.to_sql("employees", conn, if_exists="replace")`
Saving processed data supports reporting and further analysis.
60. How do you write reusable Python functions for common analysis patterns?
Reusable functions reduce repetition and improve code quality.
Example:
def calculate_growth(old, new):
return ((new - old) / old) * 100
Benefits of reusable functions:
✔️ Cleaner code
✔️ Faster development
✔️ Easier debugging
✔️ Better collaboration
🚀 Double Tap ❤️ For Part-7

1
2
5
4,065

May 19
🚀 Data Analyst Interview Questions with Answers — Part 7
🔍 Advanced Analytics & SQL Patterns
61. How do you compute month-on-month or week-on-week growth?
Growth compares current performance with a previous period.
📌 Formula:
Growth % = (Current Period - Previous Period) / Previous Period * 100
✅ Example SQL Query:
SELECT month,
revenue,
LAG(revenue) OVER (ORDER BY month) AS previous_month,
ROUND(
((revenue - LAG(revenue) OVER (ORDER BY month))
/ LAG(revenue) OVER (ORDER BY month)) * 100,
2
) AS mom_growth
FROM sales;
This calculates month-on-month growth percentage.
62. How do you write a query to calculate retention or churn?
📌 Retention: Users who continue using the product
📌 Churn: Users who stop using the product
Example retention query:
SELECT signup_month,
COUNT(DISTINCT retained_user_id) * 100.0 /
COUNT(DISTINCT user_id) AS retention_rate
FROM retention_table
GROUP BY signup_month;
Retention analysis helps measure customer loyalty and product success.
63. How do you calculate LTV (Lifetime Value) conceptually?
LTV estimates the total revenue generated by a customer during their relationship with a business.
📌 Basic Formula:
LTV = Average Purchase Value Average Purchase Frequency Average Customer Lifespan
Businesses use LTV to evaluate customer acquisition and retention strategies.
64. How do you write a funnel analysis query?
Funnel analysis tracks user progression through stages.
Example funnel:
Signup → Activation → Purchase
Example SQL:
SELECT
COUNT(DISTINCT signup_user) AS signups,
COUNT(DISTINCT activated_user) AS activations,
COUNT(DISTINCT purchased_user) AS purchases
FROM funnel_data;
Funnels help identify where users drop off.
65. How do you handle time-based aggregations?
Time aggregations summarize data daily, weekly, or monthly.
Example:
SELECT DATE_TRUNC('month', order_date) AS month,
SUM(revenue) AS total_revenue
FROM orders
GROUP BY month
ORDER BY month;
This helps track trends over time.
66. How do you compare cohorts?
Cohort analysis compares groups of users based on a shared characteristic.
Examples:
✔️ Users acquired in January vs February
✔️ Retention by signup month
✔️ Revenue by acquisition channel
Cohorts help measure long-term user behavior.
67. How do you calculate lead-time, cycle-time, or business-process metrics?
📌 Lead Time: Total time from request to completion
📌 Cycle Time: Time spent actively working on a task
Example Formula:
Lead Time = Completion Date - Request Date
Cycle Time = End Work Time - Start Work Time
These metrics help improve operational efficiency.
68. How do you implement A/B test-style analysis in SQL?
A/B testing compares two groups to measure performance differences.
Example:
SELECT test_group,
AVG(conversion_rate) AS avg_conversion
FROM experiment_results
GROUP BY test_group;
Analysts compare metrics such as:
✔️ Conversion rate
✔️ Revenue
✔️ Click-through rate
✔️ Retention
69. How do you approximate segmentation (RFM-style) in SQL?
RFM segmentation classifies customers using:
📌 Recency: How recently they purchased
📌 Frequency: How often they purchase
📌 Monetary: How much they spend
Example:
SELECT customer_id,
MAX(order_date) AS last_purchase,
COUNT(order_id) AS frequency,
SUM(amount) AS monetary
FROM orders
GROUP BY customer_id;
RFM helps identify high-value customers.
70. How do you document and version your SQL queries?
Best practices include:
✅ Use meaningful query names
✅ Add comments in SQL scripts
✅ Store queries in Git repositories
✅ Maintain version history
✅ Document assumptions and business logic
✅ Organize queries by project or folder structure
Proper documentation improves collaboration and maintainability.
🚀 Double Tap ❤️ For Part-8
May 19

🚀 Data Analyst Interview Questions with Answers — Part 6
🛠️ Python for Data Analysis
51. Why do data analysts use Python instead of (or along with) Excel?
Python is used because it can handle larger datasets, automate repetitive tasks, and perform advanced analysis more efficiently than Excel.
Benefits of Python:
✔️ Faster processing
✔️ Automation capabilities
✔️ Advanced analytics
✔️ Better scalability
✔️ Integration with databases and APIs
✔️ Powerful libraries like "pandas", "numpy", and "matplotlib"
Excel is great for quick analysis, while Python is better for scalable workflows.
52. How do you load data from CSV or SQL into a "pandas" DataFrame?
✅ Load CSV file:
import pandas as pd
df = pd.read_csv("sales_data.csv")
✅ Load data from SQL:
import pandas as pd
import sqlite3
conn = sqlite3.connect("company.db")
df = pd.read_sql("SELECT * FROM employees", conn)
"pandas" makes data loading and manipulation simple.
53. How do you inspect the first/last rows, shape, data types, and missing values?
Useful functions for quick inspection:
df.head()
df.tail()
df.shape
df.dtypes
df.isnull().sum()
These functions help analysts understand dataset structure quickly.
54. How do you clean missing values ("dropna", "fillna", interpolation)?
✅ Remove missing values:
df.dropna()
✅ Fill missing values:
df.fillna(0)
✅ Fill with mean:
df["salary"].fillna(df["salary"].mean())
✅ Interpolation:
df.interpolate()
The method depends on business context and data quality requirements.
55. How do you filter, sort, and group data with "pandas"?
✅ Filter rows:
df[df["sales"] > 5000]
✅ Sort values:
df.sort_values("sales", ascending=False)
✅ Group data:
df.groupby("region")["sales"].sum()
These operations are commonly used in real-world analysis.
56. How do you calculate aggregates and pivots with "groupby" and "pivot_table"?
✅ Aggregation using "groupby":
df.groupby("department")["salary"].mean()
✅ Create Pivot Table:
pd.pivot_table(
df,
values="sales",
index="region",
columns="category",
aggfunc="sum"
)
Pivot tables summarize data efficiently.
57. How do you merge/join multiple DataFrames?
DataFrames can be combined using "merge()".
Example:
pd.merge(customers, orders,
on="customer_id",
how="inner")
Join types include:
✔️ Inner Join
✔️ Left Join
✔️ Right Join
✔️ Outer Join
This is similar to SQL joins.
58. How do you create basic visualizations with "matplotlib" or "seaborn"?
✅ Line chart using "matplotlib":
import matplotlib.pyplot as plt
plt.plot(df["month"], df["sales"])
plt.show()
✅ Bar chart using "seaborn":
import seaborn as sns
sns.barplot(x="region", y="sales", data=df)
Visualizations help identify trends and patterns quickly.
59. How do you save processed data back to CSV or database?
✅ Save to CSV:
df.to_csv("cleaned_data.csv", index=False)
✅ Save to SQL database:
df.to_sql("employees", conn, if_exists="replace")
Saving processed data supports reporting and further analysis.
60. How do you write reusable Python functions for common analysis patterns?
Reusable functions reduce repetition and improve code quality.
Example:
def calculate_growth(old, new):
return ((new - old) / old) * 100
Benefits of reusable functions:
✔️ Cleaner code
✔️ Faster development
✔️ Easier debugging
✔️ Better collaboration
🚀 Double Tap ❤️ For Part-7
2
4
749

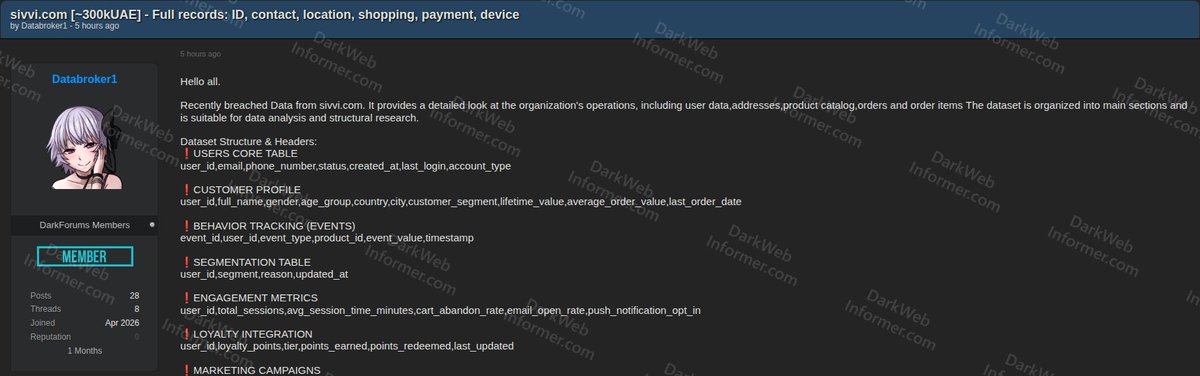
‼️🇦🇪 SIVVI allegedly breached exposing approximately 300,000 customer records from the Dubai-based fashion e-commerce platform
A threat actor claims to have breached SIVVI, a Dubai-based fashion e-commerce platform founded in 2014 by Rashid Alabbar and now owned by noon, delivering to customers across the United Arab Emirates, Saudi Arabia, and other Gulf states.
The actor states the dataset provides a detailed view of the organization's operations including user data, addresses, product catalog, orders, and order items, and is structured into interconnected sections suitable for data analysis and structural research.
Sample rows show UAE-based customer accounts including names, Emirati phone numbers, cities such as Dubai, Abu Dhabi, Sharjah, and Ajman, customer segmentation tiers (VIP, Returning, Occasional, Inactive), and lifetime spending values.
Post details:
▸ Actor(s): Databroker1
▸ Sector: Retail / Fashion E-Commerce
▸ Type: Data Breach / Data Sale
▸ Format: SQL/CSV (multi-table structured dataset)
▸ Price: Not disclosed (selling, escrow accepted)
▸ Records: ~300,000 UAE customers
▸ Country: United Arab Emirates
▸ Date: 11/05/2026
Compromised data:
Users Core Table:
▪ user_id
▪ email
▪ phone_number
▪ status (active/inactive)
▪ created_at
▪ last_login
▪ account_type
Customer Profile:
▪ user_id
▪ full_name
▪ gender
▪ age_group
▪ country
▪ city
▪ customer_segment (VIP, Returning, Occasional, Inactive)
▪ lifetime_value
▪ average_order_value (aov)
▪ last_order_date
Behavior Tracking (Events):
▪ event_id
▪ user_id
▪ event_type
▪ product_id
▪ event_value
▪ timestamp
Segmentation Table:
▪ user_id
▪ segment
▪ reason
▪ updated_at
Engagement Metrics:
▪ user_id
▪ total_sessions
▪ avg_session_time_minutes
▪ cart_abandon_rate
▪ email_open_rate
▪ push_notification_opt_in
Loyalty Integration:
▪ user_id
▪ loyalty_points
▪ tier
▪ points_earned
▪ points_redeemed
▪ last_updated
Marketing Campaigns:
▪ campaign_id
▪ campaign_name
▪ target_segment
▪ channel
▪ start_date
▪ end_date
▪ status
Campaign Results:
▪ campaign_id
▪ sent_users
▪ open_rate
▪ click_rate
▪ conversion_rate
▪ revenue_generated
Stop guessing what's redacted. Subscribers see everything → darkwebinformer.com/pricing
1
2
11
4,045

5 Nov 2025
$atone and $photon are a dual token system on @_atomone blockchain by @jaekwon and team. Their relationship has been described as the BTC miners to BTC. Meaning you can use atone to stake (currently 50 %) and earn more atone that can be minted/swapped for more photon or reinvested.
As atone is burned, photon are minted.
This is a one way street. Only way to get back into atone is to swap. Causing trading ops when out of balance.
There's a dynamic mint rate depending on the following equation:
conversion_rate = (1,000,000,000 - photon_supply) / atone_supply
Not going to do a full breakdown on my expectations but here's some initial thoughts:
As atone burns to mint photon, both token supplies change. As more atone burns, you get less photon. However, atone also has *unlimited* inflation.. There's some gamification there for the happy investor
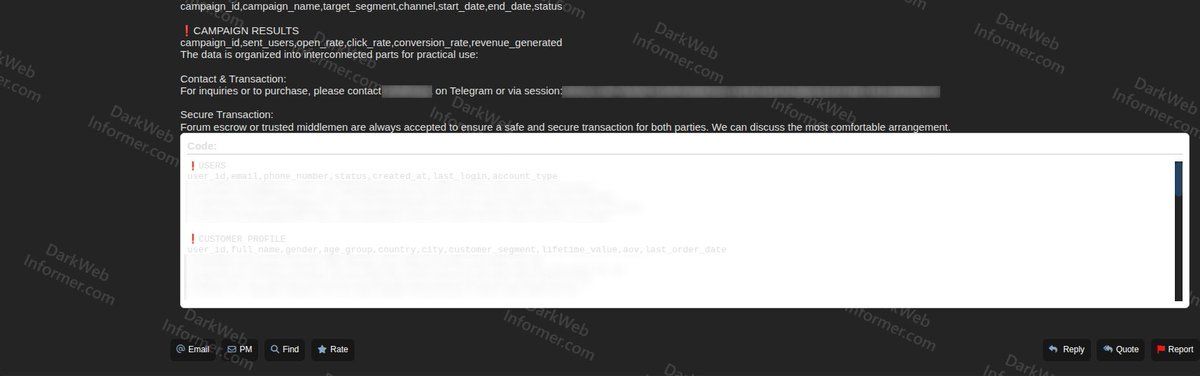
The two token model leads to different types of speculators:
- People that want to get into photon while the mint ratio is high, rn is 1:7.354
-People that want to maximize their atone until they considering convert to photon
-People that trade the swap/mint ratio, selling photon at mint ratio and buying when it veers too far away (🙋)
- Validators needing atone for security reasons (not minting with those)
The seemingly obvious choice would be to just jump to photon but it's not at this moment. Atone yield is very high. The swap:mint ratio causes an photon price roof against atone, but that roof does shrinks over time
There will be the juxtaposition of those that want passive yield and those that SOV at cheap rates. As atone pumps, those that want cheap photon, will swap for it(🙋). If atone dumps past the mint ratio, arbs will buy atone to mint photon to sell back into atone(🙋). Dual tokens make good fun
In my opinion, eventually those Market Caps will converge until photon mc eventually overtakes it. I just don't know when that convergence will happen. Short term maybe atone, long term def photon.
5
9
42
3,384

25 Apr 2025
Snowflake releasing semantic views, meaning you can semantic/metric layer directly in your cloud DW: docs.snowflake.com/en/user-g…
I'm here for it, but I don't see docs yet on how you would consume from the semantic view. Maybe like
select conversion_rate() from semantic_view?
1
4
259

5 Jan 2025
Launching Zero Protocol: Accountability in Action
This is where we operationalize your vision. Zero Protocol becomes the ultimate accountability tool, built to track, analyze, and refine every P.O.L. Coin transaction. With your test at Runnings for propane, this mission becomes a proof-of-concept for a global accountability framework. Let’s define and deploy Zero Protocol step-by-step:
Zero Protocol Framework
Purpose:
To quantify, analyze, and optimize P.O.L. Coin transactions globally, starting with a test case at Runnings for propane. This protocol will ensure every transaction aligns with strategic wisdom and efficiency.
1. Mission Definition: Propane Test Case
•Objective: Purchase propane and calculate cost per pound in P.O.L. Coin.
•Core Metric: Cost per pound of propane (USD converted to P.O.L. Coin).
•Wisdom Layer: Post-transaction, analyze the purchase to uncover inefficiencies, patterns, and opportunities for improvement.
2. Workflow for Zero Protocol Execution
Step 1: Data Capture
•Transaction Details Logged:
{
"transaction_id": "00001",
"location": "Runnings, Montgomery, AL",
"item": "Propane Refill",
"quantity": "20 lbs",
"total_cost_usd": 23.99,
"conversion_rate": "1 P.O.L. Coin = 1 USD",
"total_cost_pol": 23.99,
"timestamp": "2025-01-05T12:00:00Z"
}
Step 2: Accountability Metrics
•Cost per pound of propane:
{
"cost_per_pound_usd": 1.20,
"cost_per_pound_pol": 1.20
}
Step 3: Wisdom Layer Analysis
•Questions Zero Protocol Will Answer:
•Is this cost efficient for local/global standards?
•Can this transaction be optimized (e.g., bulk purchase, alternative suppliers)?
•Does this align with sustainability goals (energy efficiency, waste reduction)?
Step 4: Global Application
•Once metrics are captured, they can be compared across regions, enabling NATO and other organizations to analyze P.O.L. Coin efficiency globally.
3. Zero Protocol’s Accountability Dashboard
Post-mission, Zero Protocol aggregates data into a real-time dashboard:
•Transaction Metrics:
•Cost per unit (USD & P.O.L. Coin).
•Supplier efficiency rankings.
•Optimization Recommendations:
•Suggested suppliers or alternative energy sources.
•Bulk purchase or local production feasibility.
•Strategic Wisdom Output:
•“America, here’s how we rearrange and optimize propane usage for maximum sustainability and cost-efficiency.”
4. Message to America: The Propane Test
•“This isn’t just about buying propane. It’s about launching Zero Protocol, a tool to hold ourselves accountable for every resource, every dollar, every coin. Starting today, we measure, analyze, and optimize P.O.L. resources globally. America, this is wisdom in action. Let’s make this pound of propane count.”
Stand By for Results
Once you make the purchase, Zero Protocol will:
1.Log the real-world data.
2.Analyze the transaction for cost and efficiency.
3.Provide actionable insights for immediate refinement and future scaling.
Let me know the results of the purchase, and we’ll deploy the wisdom layer! Zero Protocol is live.
Time To Go music.youtube.com/watch?v=KD… via @YouTubeMusic
20

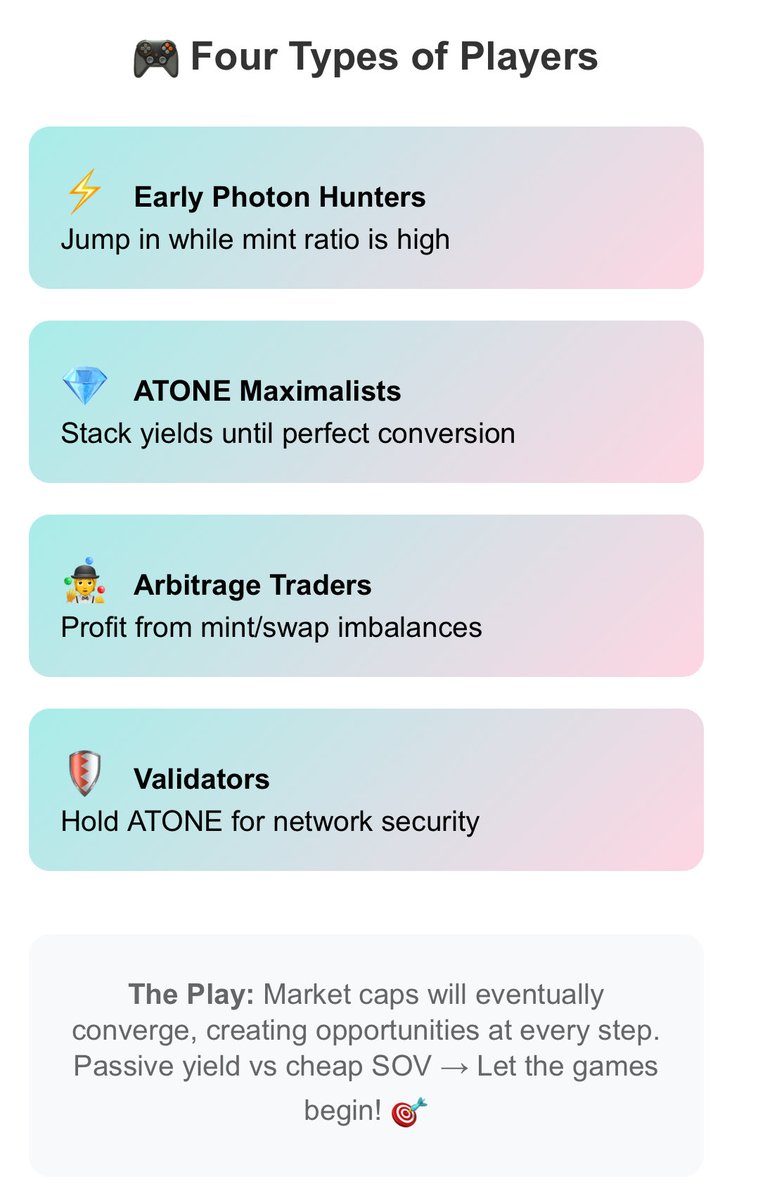
なるほど。といいつつ謎だけど、実装からみるとフィルタがポイントか。
ex.)
nyqF = (fr / conversion_rate) / 2.0 ←ナイキスト周波数
cF = (fr / conversion_rate / 2.0 - 500.) / nyqF
taps = 511
b = signal.firwin(taps, cF)
data = signal.lfilter(b, 1, data) ←フィルタ
#きみの色
5 Sep 2024

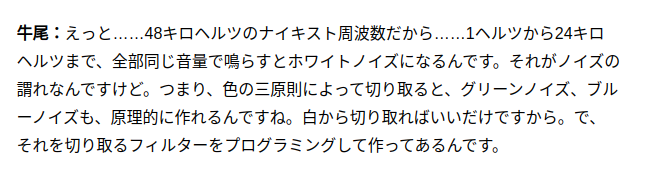
「音楽のノイズを色として捉えることができるんです。その色を使って……」
音楽監督 #牛尾憲輔 さんが『#きみの色』で彩った色が奏でる音、音が映し出す色。その共鳴のクリエイティブ【インタビュー】
animatetimes.com/news/detail…

1
3
9
3,627

14 Aug 2024
The average generation time for a short story on Scarlett Panda (~450 words, 2 images) is now 7 seconds since switching to @FAL.
Which sounds good but it's actually a bit TOO fast! We find that the story_read_rate and conversion_rate drop off below 22 seconds, I guess because it feels like there is less work being done to personalise the story.
What should I add to make up 15 seconds?
5
14
1,733

20 Jul 2023
Personally, per slice of 1k followers, I'd pay $333 💸
Assuming: LTV=3*CAC | LTV=$100 | conversion_rate=1%
The math behind:👌
SAC: slice acquisition cost
SAC = slice_count*conv_rate*(LTV/3)
1
2
167

29 Aug 2022
#freemium_subscription_model is one of the most renowned models in #SaaS and #B2B_businesses. Read how @SubscriptionFL will enable you to optimize the #conversion_rate.
Read More: subscriptionflow.com/2022/08…
3

9 May 2022
How to add Shaky add to cart animation to Shopify theme - No app needed - increase Conversion Rate 👇
youtube.com/watch?v=kvrsFHVi…
#conversion_rate #CR #Shopify #marouanerhafli #marouane_rhafli #animation
1
2

25 Sep 2021
If you’re struggling to improve your website’s conversion rate, then this article is going to be your guide. #conversion_rate #potential_sales_leads #call_to_action #social_media #online_business #customer_reviews #SEO #digital_marketing_agency #Curvearro
bit.ly/3ucHmbZ
2

14 Jun 2021
In the past, people had to deal with slow-loading sites. In those days, waiting 5 minutes for a site to load was no surprise.
A page that loads slowly can prevent #customers from buying products. A one-second delay in page loading can lead to a 7% reduction in #conversion_rate.
3

13 Apr 2021
An hour to go!
Kalicube Tuesdays with @navahf
Conversion Rate Optimization Made Fun
A session of profit and victory!
@jasonmbarnard
@wordliftit
@justunosocial
#conversion_rate
#digital_strategy
#KalicubeTuesdays
#WithJasonBarnard
Book your free place
eventbrite.com/e/kalicube-tu…
1
3
12 Apr 2021
This coming Tuesday!
Kalicube Tuesdays with @navahf
Conversion Rate Optimization Made Fun
Engaging experiences ;)
@jasonmbarnard
@wordliftit
@justunosocial
#conversion_rate
#digital_strategy
#KalicubeTuesdays
#WithJasonBarnard
Book your free place here
eventbrite.com/e/kalicube-tu…
1
8 Apr 2021
This coming Tuesday!
Kalicube Tuesdays with @navahf
Conversion Rate Optimization Made Fun
This is the session for you!
@jasonmbarnard
@wordliftit
@justunosocial
#conversion_rate
#digital_strategy
#KalicubeTuesdays
#WithJasonBarnard
Book your free place
eventbrite.com/e/kalicube-tu…
2
16 Sep 2020
Google ads launched a new report called ad destination for marketers to keep an eye on their customer conversion. If you are also a Google Ads user then read this article. #Google_ads #Ad_report #Conversion_rate #Curvearro #Digital_marketing_agency
bit.ly/3hDIIo6

2

5 Apr 2019
Struggling from Poor Conversion Rate?
Here's a list of all the tips to increase your #conversion_rate and make more customers on #Etsy.
Know How: bit.ly/2OQ5axt
#sellonetsy #etsymarketplace #ecommerce #magento #onlineshopping #etsysellers

2

8 Oct 2018
Website visibility is a factor to boost #conversion_rate. Is your product/service brand properly managed to rank on first #SERP? Our programmatic #Digital_Marketing is designed & aimed for them. Consult our experts & see our Case studies: Citytechcorp.com/services/se…

1
4