
Jun 9
Fast
Jun 9

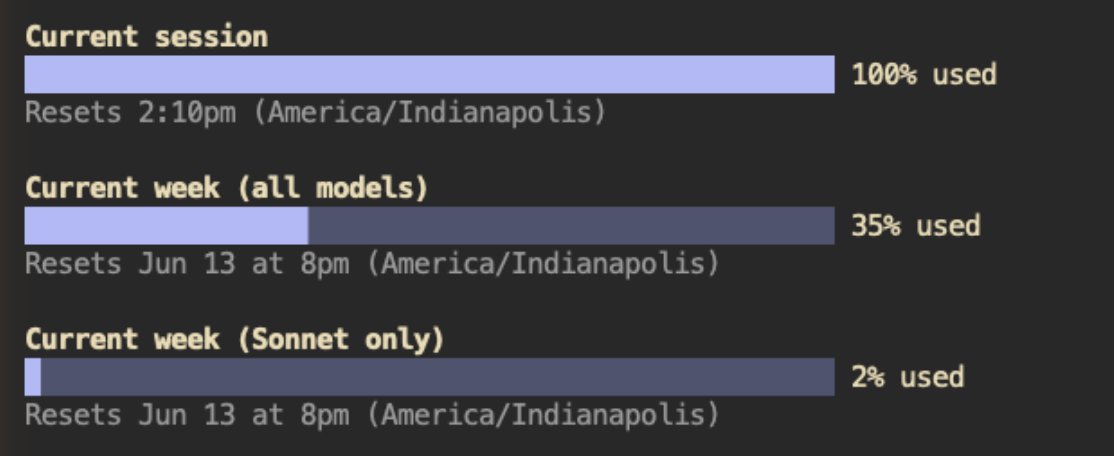
I hit my usage limits on my $200/month Claude Max subscription in less than 30 minutes using Claude Fable 5.
142


May 26
DRAM latency isn't fixed! 🤯 A single L3 cache miss can hit main memory anywhere from ~60ns to 300ns (2-5x fluctuation). Unpredictable perf killer under contention. #PerfEng #CPUCache #HardcoreDev 🚀
1

Mar 12
L1, L2, L3: not just jargon—they’re the heartbeat of performance. Each cache level is bigger & slower than the last. Miss all three? It’s a long walk to RAM. How often do your programs make that trip? Read more: iam.slys.dev/p/cpu-caches-wh…
#CPUCache #Programming #Computing #CodingMindset
iam.slys.dev/p/cpu-caches-wh…
14
Feb 8
Not all cache is created equal. Private L1/L2, shared L3, shifting policies—design matters, especially for concurrency. When did you last tune for hardware quirks? Read more: iam.slys.dev/p/cpu-caches-wh…
#CPUCache #Concurrency #Optimization #Tech
iam.slys.dev/p/cpu-caches-wh…
13
30 Dec 2025
Associativity—Zen of cache line placement! Direct-mapped is simple but suffers conflict misses. Set-associative is the middle ground. Reflect on what makes your code cache-friendly. Read more: iam.slys.dev/p/cpu-caches-wh…
#CPUCache #CodeOptimization #SoftwareEngineering #TechTalk
iam.slys.dev/p/cpu-caches-wh…
16