
OI tape fully backs this close. Advancers led decliners 183 to 32, and the wider F&O universe ran 52 long-side reads to just 1 short.
One thing into tomorrow: the 24,000 call wall is more than double the 23,800 put wall. Spot closed pressing right into that ceiling.
Strong breadth, real overhead supply.
2

Here’s a quick look at last week’s top performers, decliners, and the stocks to watch for this week, June 15, 2026.
Are you looking to invest more this year?
Visit: invest.avacapitalgroup.com to sign up or call 0700-0000-AVA for more info.
1
8

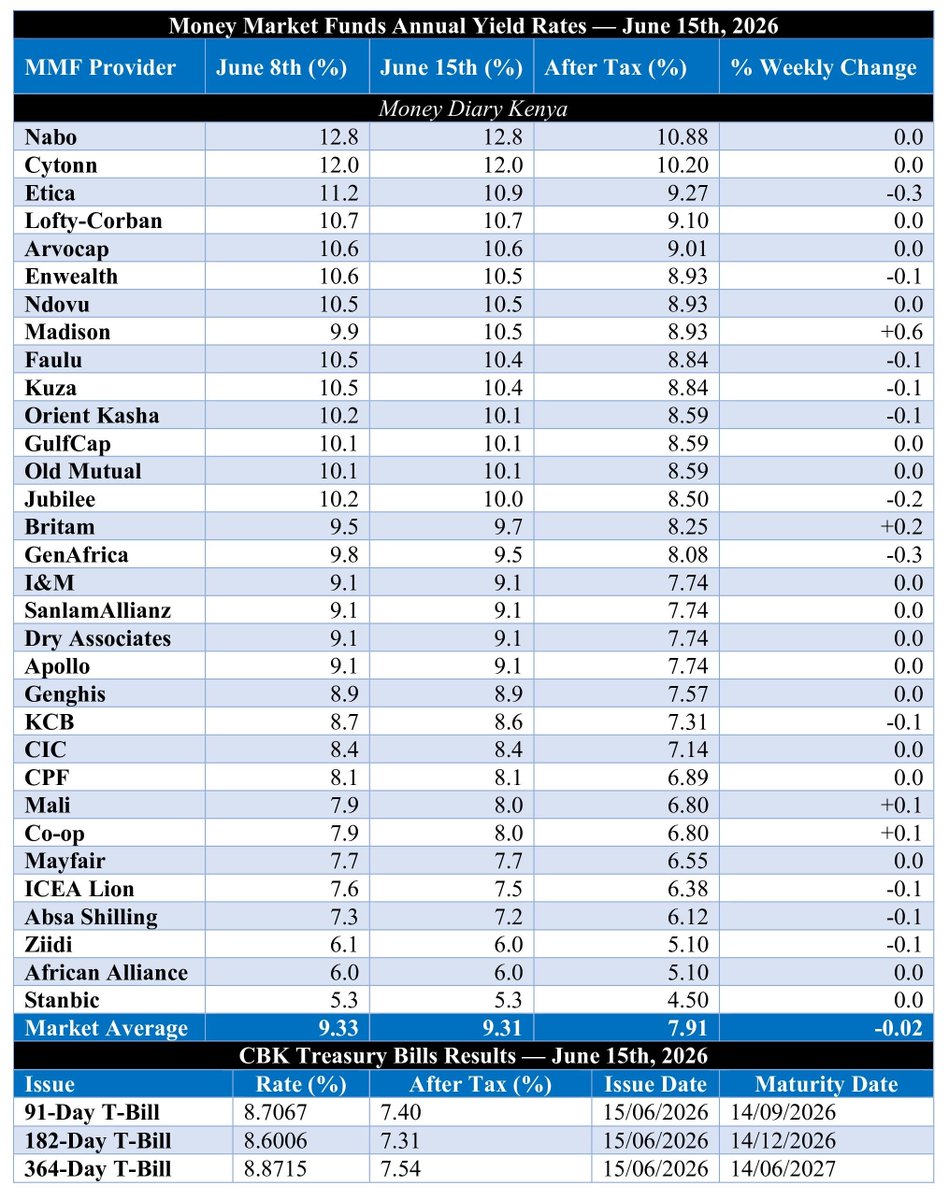
𝐌𝐃𝐊 𝐌𝐌𝐅 𝐀𝐍𝐍𝐔𝐀𝐋 𝐘𝐈𝐄𝐋𝐃 𝐑𝐀𝐓𝐄𝐒 | 𝐉𝐔𝐍𝐄 𝟏𝟓, 𝟐𝟎𝟐𝟔
MMFs market average eased to 9.31%, but remained above the 364-Day T-Bill yield of 8.87%.
🟢 Top Gainer (WoW): Madison ( 0.6%)
🔴 Top Decliners (WoW): Etica (−0.3%) and GenAfrica (−0.3%)
15

Red Leaf Market Wrap | Mon 15 Jun 2026
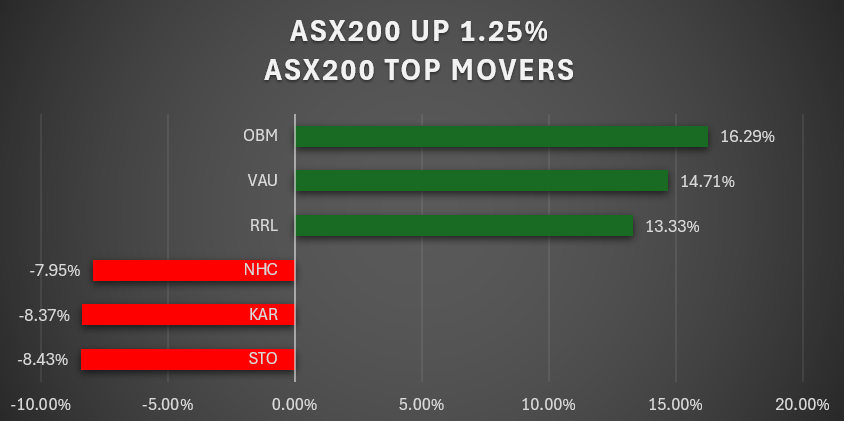
ASX 200 1.25% to 8,914, extending gains for a second session and posting its strongest 2-day advance since April. Sentiment lifted after US–Iran agreed to extend the ceasefire and reopen the Strait of Hormuz, easing near-term energy disruption risk.
Gainers
$OBM 16.29% — $233m EPC awarded to $GNG for Davyhurst expansion
$VAU 14.71% — FY26 capex $278m; production guidance maintained
$RRL 9.82% — gold strength, no news
Decliners
$STO -8.43% — energy weakness as geopolitical risk premium fades
$KAR -8.37% — sector-driven selling
$NHC -7.95% — commodity rotation continues

62
Red Leaf Market Wrap | Mon 15 Jun 2026
ASX 200 1.25% to 8,914
Strong 2nd straight gain, best 2-day run since April. Sentiment lifted after US–Iran agreed to extend ceasefire and reopenRed Leaf Market Wrap | Mon 15 Jun 2026
ASX 200 1.25% to 8,914, posting its strongest 2-day gain since April. Sentiment boosted after US–Iran agreed to extend ceasefire and reopen the Strait of Hormuz, easing near-term energy risk.
Gainers
$OBM 16.29% — $233m EPC awarded to $GNG for Davyhurst expansion
$VAU 14.71% — FY26 capex $278m; production guidance steady
$RRL 9.82% — gold strength, no news
Decliners
$STO -8.43% — energy weak as risk premium fades
$KAR -8.37% — sector pressure
$NHC -7.95% — commodity rotation
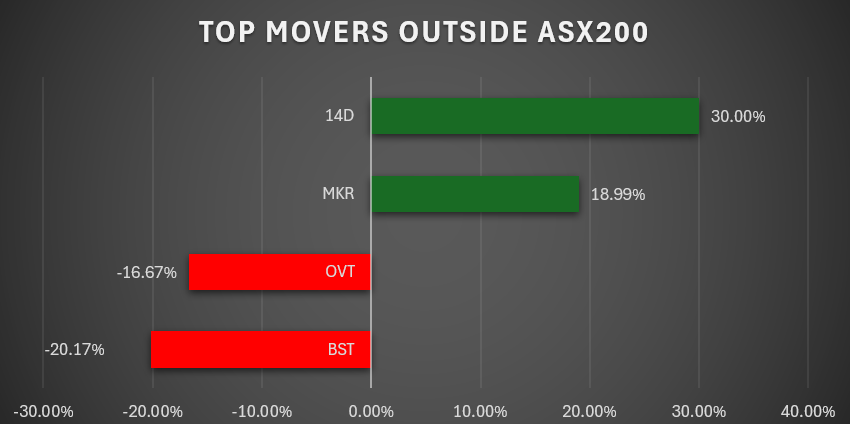
Notables
$14D 30.00% — AEMO clearance advances Aurora BESS project
$MKR 18.99% — no news
$BST -20.17% — post-IPO profit taking
$OVT -16.67% — fell despite OMINARI platform launch targeting 2026 World Cup markets
ICYMI
Small caps remain mixed post-budget; ongoing strength in data centres and defence themes.
Watch: $KPO, $VNL (recent $2.4m raise; Time Out/Pedestrian TV acquisitions)
Interview: ausbiz.com.au/media/up-110-i… of Hormuz, easing immediate energy supply risk. Markets still awaiting confirmation of durability.
ASX 200 Gainers
$OBM 16.29% — $233m EPC contract awarded to $GNG for Davyhurst expansion, de-risking execution path
$VAU 14.71% — FY26 capex guided to $278m; production 332–360koz maintained, solid operational momentum
$RRL 9.82% — gold strength, no fresh news
ASX 200 Decliners
$STO -8.43% — energy softens as geopolitical risk premium unwinds
$KAR -8.37% — sector-led weakness
$NHC -7.95% — commodity rotation continues
Notable Movers
$14D 30.00% — Aurora BESS Stage 1 clears final AEMO technical requirements; moves into ElectraNet commercial access negotiations
$MKR 18.99% — momentum buying, no announcement
$BST -20.17% — post-IPO profit-taking after sharp debut rally
$OVT -16.67% — under pressure despite launch of OMINARI prediction market platform targeting 2026 World Cup engagement
ICYMI
On ausbiz: small caps still mixed post-budget, but liquidity and sentiment improving in data centres defence-adjacent names. Continued thematic focus on AI infrastructure, sovereign capability, and energy demand growth.
Watchlist: $KPO, $VNL
$VNL recently completed $2.4m raise via Red Leaf Securities; portfolio expanding via Time Out Pedestrian TV acquisitions, with platform leverage and cost synergy optionality.
Interview:
ausbiz.com.au/media/up-110-i…
85
Jason EastCoastTrader retweeted

$21.61B was traded in the OTC market from Jun 8 – Jun 12, with breadth net BEARISH at 1.06 decliners for every advancer. The peak dollar volume occurred on Thursday at $6.64B, which was 53.6% above the 5-session average.
The week showed a volume-by-bias split where 53.4% of dollar volume settled on bearish sessions, indicating a distribution dynamic despite Thursday's bullish close. The largest breadth swing was observed between Wednesday and Thursday, improving from 1:1.51 to 1:0.70, suggesting some late-session strength. However, the overall dollar volume ranged from $3.44B to $6.64B, a significant 74.0% spread, which indicates inconsistent participation. The average price per share traded was $1.7463, reflecting a mix that did not shift significantly toward either end of the spectrum.
These sessions collectively reveal a market struggling with bearish pressure, despite intermittent spikes in volume and breadth. Observers should monitor whether Thursday's gains lead to sustained buying or if the underlying bearish sentiment prevails in future sessions.

1
1
74

.
*********************************************************
CORRUPTION PERCEPTIONS INDEX 2025
**********************************************************
.
Transparency International —182 countries ranked 0 (highly corrupt) to 100 (very clean)
Every year, Transparency International publishes its Corruption Perceptions Index —the most widely used global corruption ranking in the world. It measures perceived levels of public-sector corruption in 182 countries and territories, drawing on 13 independent data sources. The scale runs from 0, meaning a country's public sector is perceived as highly corrupt, to 100, meaning it is perceived as very clean.
The 2025 index, published February 10, 2026, delivered a stark finding: the global average dropped to 42 —its lowest point in more than a decade. 122 out of 182 countries score below 50. The number of countries scoring above 80 has shrunk from 12 a decade ago to just 5. The United States scored 64 —a decline of 12 points over the previous decade, placing it among established democracies identified by Transparency International as experiencing rising corruption perception rather than improving.
THE RANKINGS
1. Denmark —89
2. Finland —88
3. Singapore —84
4. New Zealand —81
4. Norway —81
6. Sweden —80
7. Switzerland —79
8. Netherlands —78
9. Germany —77
9. Luxembourg —77
11. Iceland —76
11. Estonia —76
13. Ireland —75
13. Australia —75
15. Canada —75
16. Belgium —73
17. Japan —72
17. Austria —72
19. United Kingdom —70
20. Hong Kong —69
21. Uruguay —68
21. Seychelles —68
23. France —66
24. United States —64
25. Chile —63
26. South Korea —63
27. Portugal —62
28. Taiwan —61
29. Bhutan —71
30. Israel —61
31. Spain —60
32. Slovenia —58
33. Qatar —58
34. Lithuania —57
34. Costa Rica —57
36. Latvia —56
37. Czech Republic —56
38. Poland —54
38. United Arab Emirates —54
40. Cyprus —53
41. Georgia —52
42. Italy —52
43. Saudi Arabia —51
44. Cabo Verde —50
44. Greece —50
46. Jordan —50
47. Botswana —55
48. Armenia —46
49. Malaysia —47
50. Namibia —47
51. Cuba —47
52. Slovakia —46
53. Senegal —46
54. South Africa —44
55. Ghana —43
55. Cote d'Ivoire —43
57. Tunisia —43
58. Romania —43
59. Hungary —40
60. Kosovo —40
61. China —42
62. Oman —42
63. Albania —39
64. India —39
65. Serbia —37
66. Vietnam —37
67. Argentina —37
68. Colombia —37
69. Turkey —36
70. Ukraine —36
71. Peru —36
72. Morocco —38
73. Brazil —38
74. Egypt —33
75. Philippines —33
76. Indonesia —34
77. Bosnia —34
78. Kenya —31
79. Pakistan —27
80. Bolivia —28
81. Mexico —30
82. Guatemala —25
83. Nigeria —25
84. Iran —24
85. Honduras —23
86. Russia —22
87. Iraq —21
88. Myanmar —20
89. Congo DR —20
90. Libya —18
91. Haiti —17
92. Afghanistan —17
93. Turkmenistan —17
94. Yemen —15
95. North Korea —15
96. Syria —13
97. Sudan —13
98. Venezuela —10
99. Somalia —9
99. South Sudan —9
WHAT THE NUMBERS SHOW
Denmark tops the index for the eighth consecutive year. Only 5 countries score above 80. The bottom of the index is dominated by conflict zones, authoritarian states, and collapsed governments —Somalia and South Sudan share last place at 9, with Venezuela, Syria, and Sudan not far above them.
Several findings from the 2025 index deserve particular attention.
The United States scored 64 —its lowest score in years, representing a 12-point decline over the previous decade. Transparency International specifically identified the US alongside the UK and New Zealand as established democracies where corruption perception is worsening. The report cited attacks on independent oversight, the use of public office for private gain, and the erosion of judicial independence as drivers of the decline.
Hungary scored 40 —among the lowest in the European Union, reflecting a decade of systematic institutional capture by the Orban government, including the diversion of EU funds to political cronies, the undermining of judicial independence, and the restriction of civil society and press freedom. The report uses Hungary as a primary case study in how democratic backsliding and corruption reinforce each other.
Albania scored 39 —placing it in the tier of countries with serious corruption problems, alongside India, Serbia, and Vietnam. That score provides direct context for the events currently unfolding on Albania's Adriatic coast, where the government passed bespoke legislation exempting five-star hotel development from protected area restrictions, transferred military island assets to private investors, and is now facing its largest street protests in years over a luxury resort development linked to Jared Kushner's Affinity Partners. A country that scores 39 on the Corruption Perceptions Index does not pass legislation for foreign investors by accident.
Russia scored 22. It has never scored higher than 28 in the index's history.
The global average of 42 —its lowest in more than a decade —is the index's most significant headline finding. Transparency International's conclusion is unambiguous: corruption is worsening globally, democratic institutions are weakening rather than strengthening, and the countries that once anchored the top of the index are themselves beginning to slip.
36 of the 50 biggest CPI decliners over the past decade restricted civic freedoms. Over 90 percent of journalists murdered for covering corruption lived in low-scoring countries. The connection between corruption, restricted press freedom, and violence against journalists is not theoretical. It is documented and consistent across every region of the world.
.
SOURCE
Transparency International. Corruption Perceptions Index 2025. Published February 10, 2026. Berlin, Germany. Available at transparency.org/en/cpi/2025.
.
Copyright © 2026 by Robin Riley Reynolds / All Rights Reserved
.

3
5
121
Success Trades📊 retweeted

Jun 13
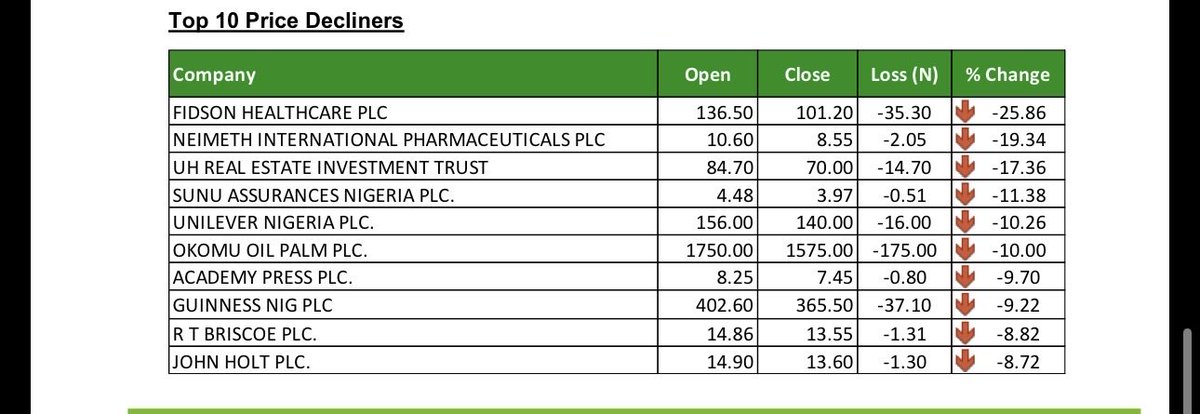
FIDSON crashed 25.86% in one week. Here is what the sell-off tells us.
FIDSON led decliners with a 25.86% weekly drop, followed by UHOMREIT at 17.36%, Unilever at 10.26% and Okomu Oil at 10%. Guinness fell 9.22%. Fifty-two stocks declined this week against forty gainers, showing that despite the index gain, the market remains uneven.
3
6
70
6,330


Jun 13
@mcuban Exactly. Broad equity indices are active by design: they automatically overweight growing winners and shed decliners.
That’s why they outperform GDP growth and deliver ~7% real returns — powering the very wealth creation you described. Creative destruction, built in.
1
1
5,251

Weekly Player Spotlight — 2026 Risers & Decliners
Biggest expected riser: Sandy León (0.166 → 0.358 EB/PA)
Biggest expected decliner: Griffin Conine (0.695 → 0.483)
Full rankings: dtw-str.streamlit.app

5
611

Jun 13
Everyone's calling it a pullback. Fine. But the internals are telling a different story right now.
Been watching breadth data all week - advancers vs decliners, new highs vs new lows, percent of names above their 20-day. None of it looks like distribution. It looks like rotation. Big difference.
When a market drops but the percentage of $SPY components holding above their 50-day actually climbs, that's not a market that wants to go lower. That's a market shedding the crowded trades and quietly building a base underneath. Tamarisk's read on this is correct - ngl, improving breadth under a nominal pullback is one of the more reliable setups I've seen in the past two years. The VIX headline number is doing a lot of work to distort the picture.
Here's how I'm framing it: the visible pain - QQQ lagging, VIX ticking up, every financial account screaming correction - is masking what's happening in the mid and small caps. Those names are quietly grinding higher. The breadth expansion is real, and it's the kind of move that doesn't make headlines until it already ran.
I added exposure mid-week when everyone was pressing shorts on the index. Not because I'm a bull - I'm not. I'm a momentum trader. But momentum doesn't care about your macro narrative. It follows the internals, and right now the internals say the bid is still there underneath.
Stop is tight. If breadth starts rolling over - advancers collapse, new lows start expanding - I'm out same day. No thesis-holding. The whole premise evaporates if the internals flip, and I'm not riding a narrative into a loss.
Target is a clean retest of recent highs. RR is fine given how narrow the stop is. If it fails before that, small loss. If it works, the move back up is clean and fast once the pullback narrative flips.
The risk worth flagging: this is a low-vol grind environment, not a rip. VIX is still elevated enough that one macro shock - a CPI miss, Fed language, geopolitical flare - could blow through the breadth read in a single session. So I'm sized for a grind, not a squeeze. That's a big difference in how you manage the trade day to day.
Also worth saying: I was wrong about the 50-day holding cleanly in late May. Stopped out, took the loss, reassessed. This current setup is different - the breadth signature wasn't there then. It is now. Changed my mind based on the data, not because I needed to be right.
Bottom line - the pullback is real but the internals aren't confirming distribution. Until they do, I'm not pressing the short side. Already got burned in February doing exactly that when breadth held and I was late to cover. Not repeating that.
1
3
3
48

Jun 13
𝗨𝗦 𝗦𝘁𝗼𝗰𝗸 𝗠𝗮𝗿𝗸𝗲𝘁 – 𝗪𝗲𝗲𝗸𝗹𝘆 𝗖𝗹𝗼𝘀𝗶𝗻𝗴 𝗣𝗲𝗿𝗳𝗼𝗿𝗺𝗮𝗻𝗰𝗲 ( 𝗪𝗲𝗲𝗸 𝗘𝗻𝗱𝗶𝗻𝗴 𝟭𝟮 𝗝𝘂𝗻𝗲 𝟮𝟬𝟮𝟲)
🔹 Dow Jones: ‑0.2% to ‑0.3%, closed ~50,848 – 50,867.
🔹 S&P 500: ‑2.5% to ‑2.6%, closed ~7,384 – 7,393.
🔹 Nasdaq Composite: ‑4.7%, closed ~25,709 – 25,809; hardest hit by tech pullback, but rebounded 2.5% Friday.
🔹 Russell 2000: ‑2.9%, closed ~2,834.
🔹 Key Themes
Semiconductor & AI stocks faced mid‑week pressure on earnings/rotation, then rebounded strongly Friday.
Geopolitical easing ( Iran ceasefire talks, lower oil) supported risk assets.
SpaceX IPO ( $SPCX) debut dominated attention — lifted sentiment broadly but pressured other space stocks.
Market breadth improved Friday with advancers leading decliners.
📌 Summary – After nine straight weeks of gains, the S&P 500 posted a modest weekly loss. Tech & semiconductors drove volatility, while easing Middle East tensions and the historic SpaceX IPO helped spark a strong Friday rebound. Overall tone: cautious but resilient, with AI momentum and geopolitics steering sentiment.
#USMarkets #WeeklyClose #SP500 #Nasdaq #DowJones #Russell2000 #Semiconductors #AI #SpaceXIPO #Geopolitics
139
Jun 13
𝗨𝗦 𝗦𝘁𝗼𝗰𝗸 𝗠𝗮𝗿𝗸𝗲𝘁 – 𝗪𝗲𝗲𝗸𝗹𝘆 𝗖𝗹𝗼𝘀𝗶𝗻𝗴 𝗣𝗲𝗿𝗳𝗼𝗿𝗺𝗮𝗻𝗰𝗲 ( 𝗪𝗲𝗲𝗸 𝗘𝗻𝗱𝗶𝗻𝗴 𝟭𝟮 𝗝𝘂𝗻𝗲 𝟮𝟬𝟮𝟲)
🔹 Dow Jones: ‑0.2% to ‑0.3%, closed ~50,848 – 50,867.
🔹 S&P 500: ‑2.5% to ‑2.6%, closed ~7,384 – 7,393.
🔹 Nasdaq Composite: ‑4.7%, closed ~25,709 – 25,809; hardest hit by tech pullback, but rebounded 2.5% Friday.
🔹 Russell 2000: ‑2.9%, closed ~2,834.
🔹 Key Themes
Semiconductor & AI stocks faced mid‑week pressure on earnings/rotation, then rebounded strongly Friday.
Geopolitical easing ( Iran ceasefire talks, lower oil) supported risk assets.
SpaceX IPO ( $SPCX) debut dominated attention — lifted sentiment broadly but pressured other space stocks.
Market breadth improved Friday with advancers leading decliners.
📌 Summary – After nine straight weeks of gains, the S&P 500 posted a modest weekly loss. Tech & semiconductors drove volatility, while easing Middle East tensions and the historic SpaceX IPO helped spark a strong Friday rebound. Overall tone: cautious but resilient, with AI momentum and geopolitics steering sentiment.
#USMarkets #WeeklyClose #SP500 #Nasdaq #DowJones #Russell2000 #Semiconductors #AI #SpaceXIPO #Geopolitics
1
353

Jun 12
🔴 Today's Decliners
SPCE -39.75% → $3.91
MNTS -30.72% → $11.95
ASTS -21.06% → $82.41
#SpaceStocks #NewSpace
61

Notable Decliners on Heavy Volume 🔴
$ADBE (Adobe): ~ -6.5% to -6.8% on 3x stock AND options volume — bearish flow worth watching
$SPCE (Virgin Galactic): -37.70% on 3x options volume — a major capitulation move
$SATS (EchoStar): ~ -10% to -13% on 3x both stock and options volume
$OMER (Omeros): -15.82% on 3x volume
1
519