
ACP Japan Chapter retweeted

ECPCメンバー片平先生の取り組みがインタビューされています!
忙しい中いつもECPCの活動にもコミットいただきありがとうございます!
Jun 12

大変光栄なことに、Gates Foundation(ゲイツ財団)とWIREDのタイアップ企画「グローバルヘルスの未来を書き換える4人の肖像」の1人としてご紹介いただきました!(wired.jp/branded/2026/06/04/…)
取材と撮影に丁寧に時間をかけていただき、Fihankra Healthの取り組みや私達の目指す未来について、とても素敵な記事にまとめていただきました。ぜひご覧ください!
2
5
442


Jun 8
@KristinNap95
Thank you for the reply.
This is actually one of the strongest parts of OnShoringAmerica's framework. NAICS code additions are not laws and do not require Congress.
They are purely administrative classification tools managed by the Economic Classification Policy Committee (ECPC) under the Office of Management and Budget.
Once the three proposed codes (561399, 611319, and 518219) are formally added, they become part of the permanent federal statistical infrastructure — just like every other NAICS code in use today.
A future president cannot simply wave them away.
Changing or removing an adopted NAICS code requires the same formal revision process (public comment, inter-agency review, Federal Register notice).
It is not an EO that vanishes with a new administration.
That’s exactly why this approach is powerful: one Executive Order simply accelerates the timeline from 2032 to 2027.
Once the codes are in place, the transparency becomes structural and durable.
The full technical document (including the exact NAICS proposals, process details, and how the codes become permanent) is here:
onshoringamerica.com/framewo…
Transparency First. Accountability Follows.
2
3
30

Jun 8
ال ITI
هندسة و لا حاسبات
نبدأ بايثون و لا C
فلوس ال ECPC تستاهلها و لا لا
Jun 7

ممكن نعمل خناقة iti تاني لو سمحتم
1
56
3,726
Jun 6
I truly believe many are seeing it, and they're trying to figure out how to 'frame it' so they can say they had the idea!
I'm willing to go on any news outlet, podcast, or congressional briefing to discuss this. The solution is already built and sitting right in front of us — no legislation required, no congressional approval, no political theater.
Just one Executive Order directing the Census Bureau and OMB to accelerate three NAICS classification codes into the 2027 revision cycle.
Codes already submitted, already confirmed by the ECPC.
The payoff for American citizens will be monumental — for generations to come.
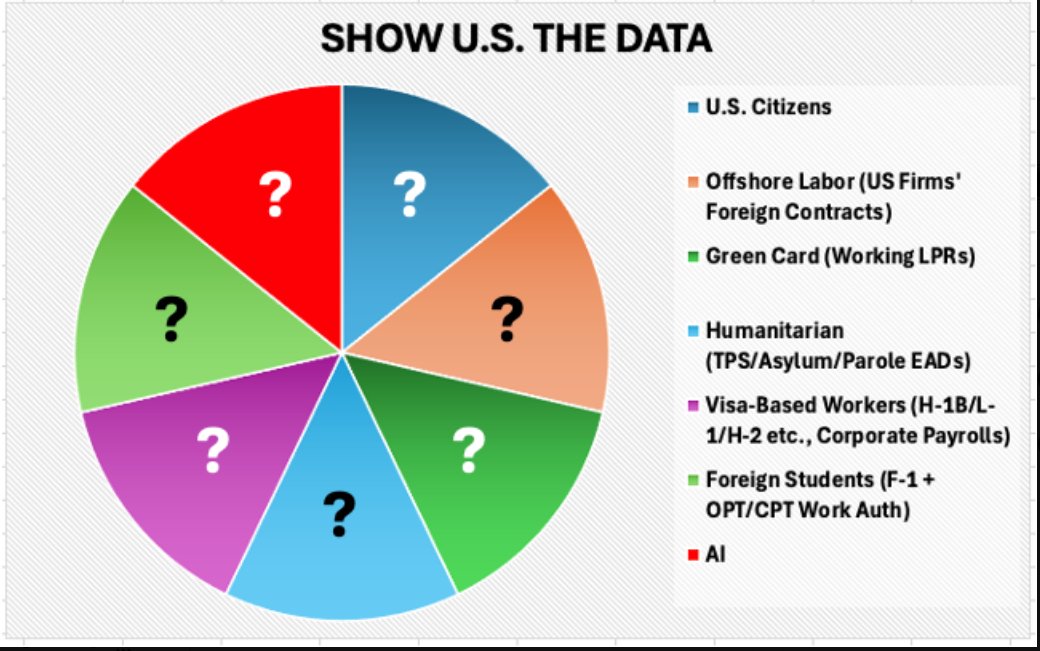
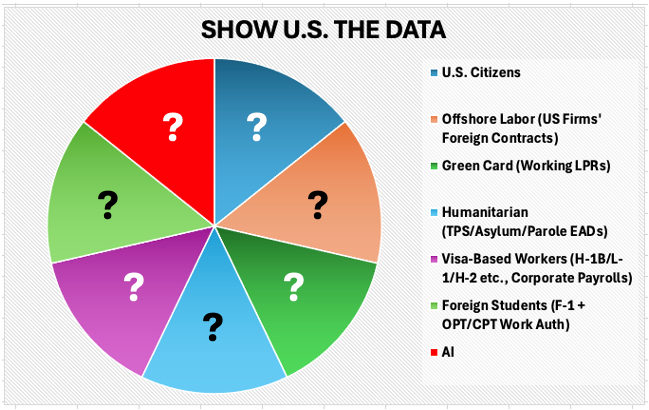
SHOW U.S. THE DATA. 🇺🇸
OnShoringAmerica.com"
1
2
4
46

Jun 5
مسيرة متوسطة بسبب قلة الاستمرارية 😔
بدأت من تانية كلية ذاكرت يعتبر لحد نص ليفل ٢ كده، شاركت ecpc مرتين اتاهلت مرة فينالز مسكت تيكنكال تيم هيد فتالتة فالكومينتي عندنا، وليدر كومينتي في رابعة والحمدلله شرحنا ليفل ٠ و ١ والفيدباكس كانت كويسة، وكنت كوتش الجامعة بعد التخرج

2
18
1,378
Jun 5
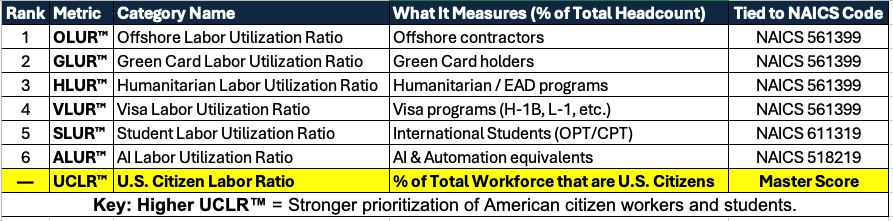
VLUR™ — 1.7 million workers.
H-1B. L-1. TN. O-1. And more.
Temporary visa holders working inside U.S. companies.
That's 5% of all labor substitution in the U.S. economy.
SHOW U.S. THE DATA.
VLUR™ fixes that.
The Visa Labor Utilization Ratio is a single, standardized score that tells you exactly what percentage of any company's total workforce consists of temporary visa holders.
Company X: VLUR™ of 34%
Company Y: VLUR™ of 2%
Now you know.
Here's what makes VLUR™ uniquely important:
Visa data is actually the most tracked category in this entire framework.
USCIS maintains detailed H-1B Employer Data Hubs going back to 2009. DOL publishes petition data. Approval rates, denial rates, wage levels, job classifications — all public.
And independent researchers have gone even further.
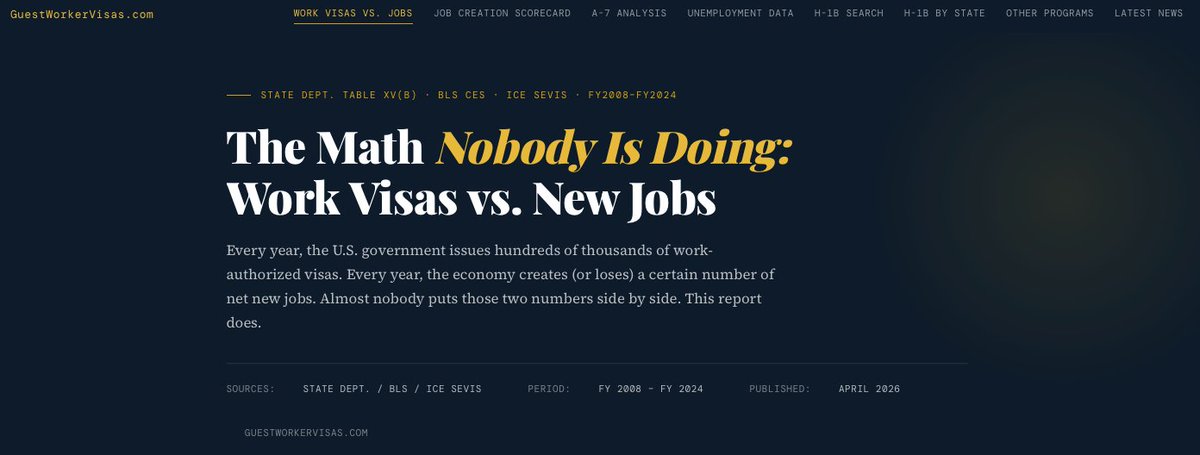
A special acknowledgment to Virgil Bierschwale — @VBierschwale — whose invaluable work at guestworkervisas.com takes publicly available visa data and publishes it at an extraordinarily granular level — company by company, visa by visa.
Visit Virgil's site; the data is invaluable!
But here's the critical point:
Even with the best available public and independent data — there is one measurement that is impossible to produce at any level:
❌ Legal noncitizen labor utilization as a standardized percentage of total company headcount — across ALL categories simultaneously
Not by any federal agency.
Not by any independent researcher.
Not anywhere.
That single missing measurement is the difference between fragmented data points — and a complete, comparable, publicly accessible picture of how American corporations are actually allocating their workforce.
That's not a data limitation.
That's a classification gap.
And it's precisely what VLUR™ — as one of six ratios feeding into UCLR™ — is designed to close.
Before we debate whether any of this is good or bad — shouldn't we at least know how much?
SHOW U.S. THE DATA.
That's OnShoringAmerica's Phase 1. Transparency.
VLUR™ is the fourth of six supporting ratios that feed directly into the master score:
UCLR™ — U.S. Citizen Labor Ratio
The single number that answers the question every American worker deserves to know:
What percentage of this company's workforce is made up of ready-and-able U.S. Citizens?
Six ratios. One master score. Complete transparency.
OLUR™ → Offshore contractors ✅
GLUR™ → Green Card holders ✅
HLUR™ → Humanitarian / EAD ✅
VLUR™ → Visa workers ⬅ you are here
SLUR™ → Foreign students ✅
ALUR™ → AI & Automation ✅
UCLR™ → The Master Score ✅
Every ratio feeds UCLR™. Every post in this series builds the case.
VLUR™ is tied to NAICS 561399 — one of three classification proposals already formally submitted to and received by the U.S. Census Bureau's ECPC.
One Executive Order from @realDonaldTrump directing @uscensusbureau and @WHOMB to adopt these NAICS codes — and this becomes mandatory, standardized, and public for every major corporation in America.
American workers deserve the truth. A single standardized dataset currently does not exist.
I've built it.
Read all OnShoringAmerica framework white papers from: onshoringamerica.com/framewo…
🇺🇸 OnShoringAmerica
#LaborTransparency #VLUR #VisaWorkers #AmericanWorkers #UCLR #OnShoringAmerica #ShowUSTheData

2
8
14
907
Jun 4
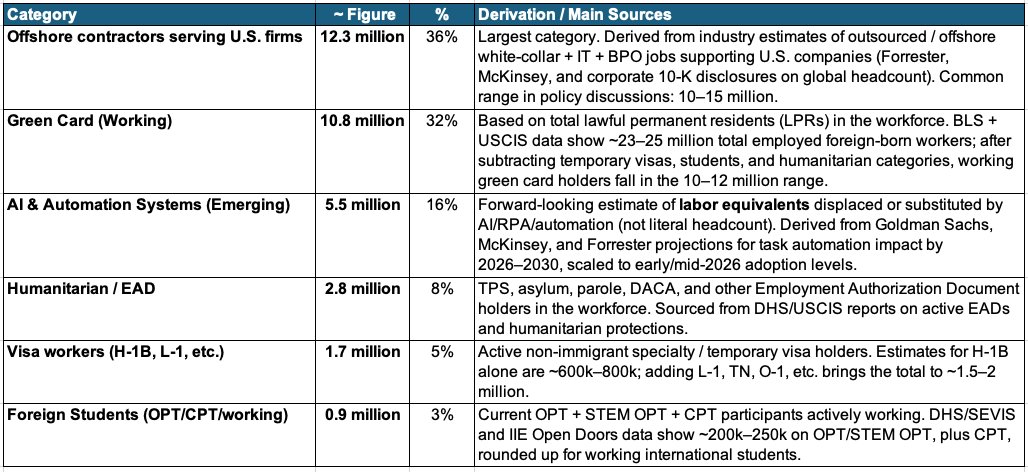
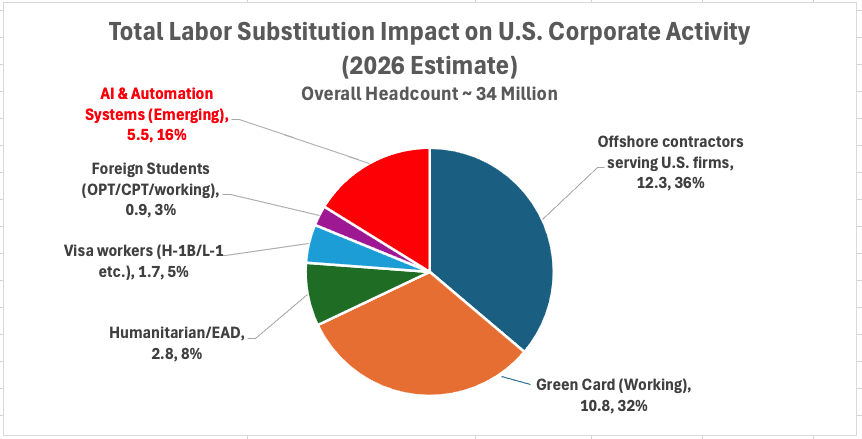
~34 million labor substitution equivalents.
Six categories. Zero standardized public data. One framework that fixes all of it.
UCLR™ — The U.S. Citizen Labor Ratio.
The single number that answers the question every American worker, policymaker, investor, and taxpayer deserves to know:
What percentage of this company's total workforce is made up of ready-and-able U.S. Citizens?
Here's what we've established across this entire series:
OLUR™ — 12.3 million offshore contractors. Invisible. GLUR™ — 10.8 million Green Card holders. Invisible. HLUR™ — 2.8 million humanitarian workers. Invisible. VLUR™ — 1.7 million visa workers. Tracked in isolation. Never contextualized.
SLUR™ — 0.9 million foreign students. Tracked inconsistently. Can disappear overnight.
ALUR™ — 5.5 million AI labor equivalents. Completely untracked.
~34 million labor substitution equivalents.
No single standardized dataset captures all of it.
Not by company. Not by industry. Not by state. Not by congressional district.
That ends with UCLR™.
UCLR™ = U.S. Citizen Workers ÷ Total Headcount × 100%
Total Headcount includes everything:
U.S. Citizens offshore workers Green Card holders visa workers humanitarian workers foreign students AI labor equivalents.
Every category. Every worker. Every equivalent.
One denominator. One score.
What does a UCLR™ score actually look like?
- A UCLR™ of 82% — that company is strongly prioritizing American CITIZEN workers.
- A UCLR™ of 50% — acceptable but significant room for improvement.
- A UCLR™ of 28% — heavy reliance on non-citizen and substitute labor.
Now you know.
And for the first time — those numbers would be public, standardized, and comparable at every level that matters:
🏢 By company
🏭 By industry sector
🗺️ By state
🏛️ By congressional district
🏙️ By city and municipality
📊 By sub-industry
🏗️ By individual establishment
📅 Year over year
A worker in Ohio wants to know about their employer ? A senator wants to know about their district ?
An investor wants to compare two companies in the same sector ?
A journalist wants to rank industries by American citizen worker prioritization ?
UCLR™ answers all of it.
Same formula. Same methodology. Infinitely scalable.
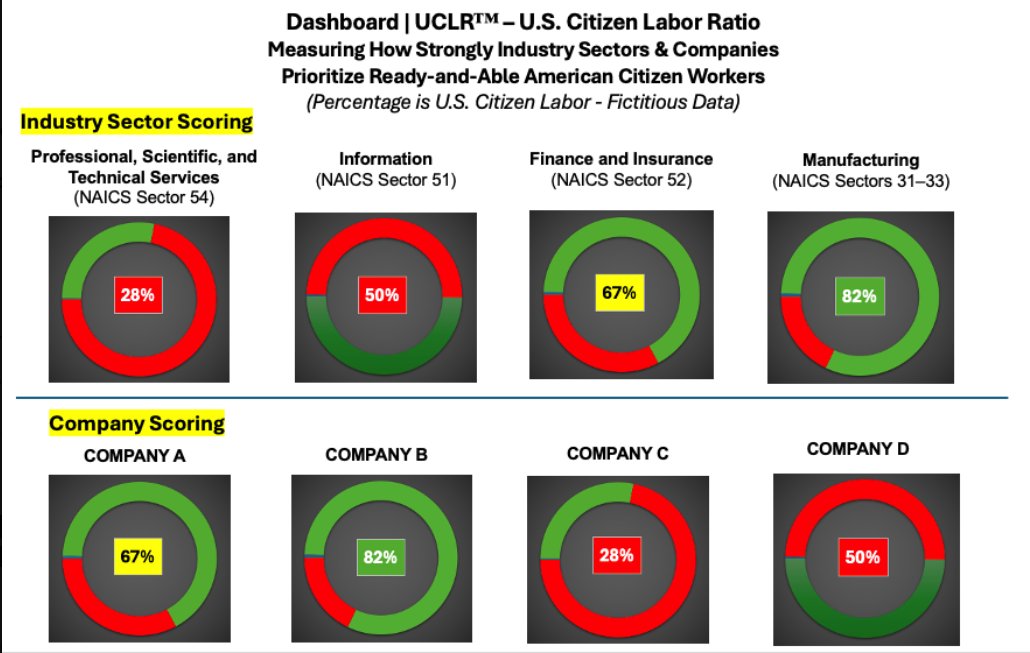
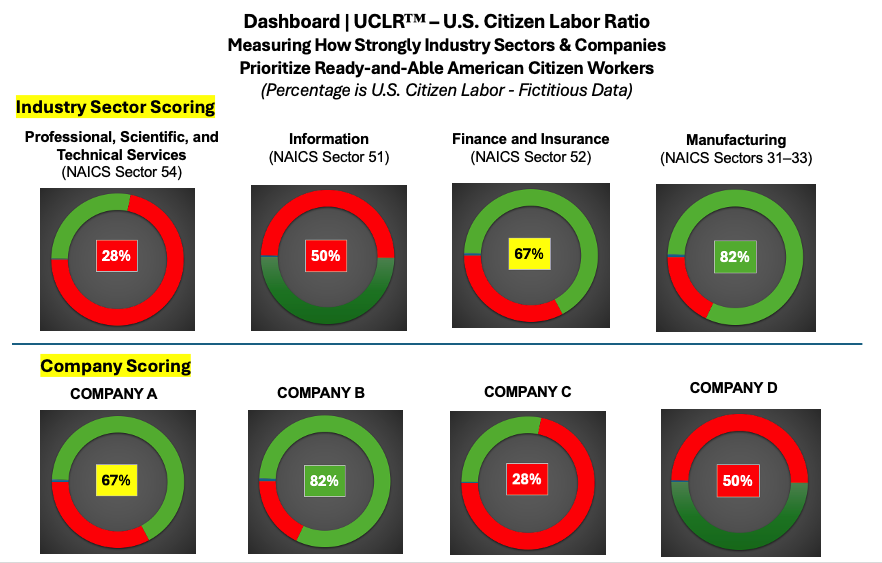
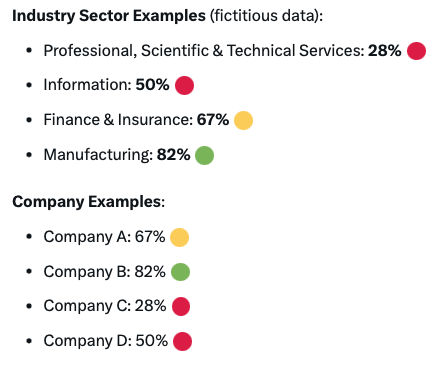
See the dashboard below for reference.
Sector by sector. Company by company.
- Professional & Technical Services: 28%
- Information Technology: 50%
- Finance & Insurance: 67%
- Manufacturing: 82%
Which sectors are prioritizing American workers? Which are not?
Right now, nobody knows. UCLR™ changes that.
Phase 2: What happens once we have the data
Transparency is Phase 1. Accountability is Phase 2.
Once UCLR™ scores are public, smart policy follows naturally:
- 80–100% → Outstanding. Maximum tax incentives.
- 65–79% → Strong. Strong incentives.
- 50–64% → Good. Moderate incentives.
- 30–49% → Below average. Base levies.
- Below 30% → Poor. Full levies public reporting.
All levy revenue reinvested directly into American CITIZEN worker training, education, and workforce development.
Higher UCLR™ = Stronger prioritization of ready-and-able American citizen workers.
But first — this requires Executive Action!
The entire OnShoringAmerica framework is contingent upon President Trump @realDonaldTrump directing the Census Bureau and OMB — via Executive Order — to formally adopt three NAICS code proposals currently pending before the ECPC:
- NAICS 561399 — Foreign Labor Placement and Management Services
- NAICS 611319 — International Student Enrollment and Compliance Services
- NAICS 518219 — Workforce Automation and AI Substitution Services
These proposals have already been formally submitted to and received by the ECPC.
The infrastructure exists. The framework is built. The math is ready.
One Executive Order starts the clock.
Six ratios. One master score. Complete transparency.
OLUR™ → Offshore contractors ✅
GLUR™ → Green Card holders ✅
HLUR™ → Humanitarian / EAD ✅
VLUR™ → Visa workers ✅
SLUR™ → Foreign students ✅
ALUR™ → AI & Automation ✅
UCLR™ → The Master Score ✅
The series is complete. The framework is built. The case has been made.
American CITIZEN workers deserve the truth. A single standardized dataset currently does not exist.
I've built it.
Transparency First. Accountability Follows.
American Citizen Workers and Students Deserve to Be First in Line Again.
Read all OnShoringAmerica framework white papers from: onshoringamerica.com/framewo…
🇺🇸 OnShoringAmerica #LaborTransparency #UCLR #AmericanWorkers #OnShoringAmerica #ShowUSTheData #TransparencyFirst


2
2
638
Jun 4
SLUR™ — 0.9 million workers.
Foreign students. Working inside U.S. companies.
F-1 visas. OPT. STEM OPT. CPT work authorizations.
That's ~3% of all labor substitution in the U.S. economy.
Small percentage. Big story.
SHOW U.S. THE DATA.
SLUR™ fixes that.
The Student Labor Utilization Ratio is a single, standardized score that tells you exactly what percentage of any company's total workforce consists of international students working under OPT, STEM OPT, CPT, and similar authorizations.
Company X: SLUR™ of 12%
Company Y: SLUR™ of 1%
Now you know.
Here's what the research actually shows:
In 2024 alone — ~418,781 foreign students were authorized to work via OPT inside U.S. companies.
OPT participation has more than doubled since 2007 — and STEM OPT surged 54% in a single year.
The top employers?
- Amazon employed 6,679 foreign students on STEM OPT — ranking first nationally.
- Google employed 1,778, ranking second.
Those are real numbers. Publicly available. Impressive in their specificity.
So what's missing?
Context.
Amazon employs over one million workers globally.
6,679 STEM OPT workers — what percentage of their total headcount is that?
Nobody publishes that number.
And here's what makes this category uniquely important from a transparency standpoint:
OPT employer data has been removed from federal SEVP reports in the past — and later restored!
Transparency in this category has already been switched off once.
Without a mandatory NAICS-anchored framework — it can happen again!
At any time. By any administration!
That's exactly why SLUR™ — as a standardized, mandatory, NAICS-anchored metric — matters.
Right now there are zero standardized public figures on:
❌ OPT/CPT workers as a percentage of any company's total headcount
❌ Which industries have the highest student worker concentration
❌ How that concentration compares to all other non-citizen labor categories at the same employer
❌ How reliance on student labor has shifted year over year at the company level
That's not a policy statement.
That's a data gap.
Before we debate whether any of this is good or bad — shouldn't we at least know how much?
SHOW U.S. THE DATA.
That's OnShoringAmerica's Phase 1. Transparency.
SLUR™ is the fifth of six supporting ratios that feed directly into the master score:
UCLR™ — U.S. Citizen Labor Ratio
The single number that answers the question every American worker deserves to know:
What percentage of this company's workforce is made up of ready-and-able U.S. Citizens?
Six ratios. One master score. Complete transparency.
OLUR™ → Offshore contractors ✅
GLUR™ → Green Card holders ✅
HLUR™ → Humanitarian / EAD ✅
VLUR™ → Visa workers ✅
SLUR™ → Foreign students ⬅ you are here
ALUR™ → AI & Automation ✅
UCLR™ → The Master Score
Every ratio feeds UCLR™. Every post in this series builds the case.
SLUR™ is tied to NAICS 611319 — International Student Enrollment and Compliance Services — one of three classification proposals already formally submitted to and received by the U.S. Census Bureau's ECPC.
One Executive Order from @realDonaldTrump directing Census and OMB to adopt these NAICS codes — and this becomes mandatory, standardized, and public for every major corporation in America.
American workers deserve the truth. A single standardized dataset currently does not exist.
I've built it.
Read all OnShoringAmerica framework white papers from: onshoringamerica.com/framewo…
🇺🇸 OnShoringAmerica #LaborTransparency #SLUR #OPT #ForeignStudents #AmericanWorkers #UCLR #OnShoringAmerica


2
11
15
348
Jun 4
ALUR™ — 5.5 million labor equivalents.
Displaced. Substituted. Replaced.
Not offshore. Not visa holders. Not Green Cards.
Machines. Algorithms. AI systems.
And that's just the 2026 estimate!
SHOW U.S. THE DATA!
ALUR™ fixes that.
The AI Labor Utilization Ratio is a single, standardized score that tells you exactly what percentage of any company's total workforce has been substituted or displaced by artificial intelligence, automation, and related technologies.
Company X: ALUR™ of 23%
Company Y: ALUR™ of 4%
Now you know.
Here's what makes ALUR™ unlike every other ratio in this framework:
Every other category has a human face.
Offshore workers. Green Card holders. Visa workers. Humanitarian workers. Foreign students.
They are people. They can be counted. They file taxes. They appear in payroll records.
AI doesn't.
Right now, there are zero standardized public figures on:
❌ How many full-time equivalent positions have been displaced by AI at any given company
❌ Which industries are substituting American workers with automation fastest
❌ What percentage of any company's total headcount equivalent is now AI-driven
❌ How that substitution is accelerating year over year
And here's what makes this category different from every other in this framework:
In 2026 — AI & Automation represents ~16% of total labor substitution.
That number is already larger than Humanitarian workers, Visa workers, and Foreign Students combined.
And it's just getting started.
These are not literal headcount figures.
These are labor equivalents — full-time position equivalents displaced or substituted by AI, RPA, and automation systems.
Derived from Goldman Sachs, McKinsey, and Forrester projections scaled to early 2026 adoption levels.
The methodology is transparent. The math is conservative. The trajectory is not.
Before we debate whether any of this is good or bad — shouldn't we at least know how much?
SHOW U.S. THE DATA.
That's OnShoring America's Phase 1. Transparency.
ALUR™ is the sixth of six supporting ratios that feed directly into the master score:
UCLR™ — U.S. Citizen Labor Ratio
The single number that answers the question every American worker deserves to know:
What percentage of this company's workforce is made up of ready-and-able U.S. Citizens?
Six ratios. One master score. Complete transparency.
OLUR™ → Offshore contractors ✅ posted
GLUR™ → Green Card holders ✅ posted
HLUR™ → Humanitarian / EAD
VLUR™ → Visa workers
SLUR™ → Foreign students
ALUR™ → AI & Automation ← You are here
UCLR™ → The Master Score
Every ratio feeds UCLR™. Every post in this series builds the case.
ALUR™ is tied to NAICS 518219 — Workforce Automation and AI Substitution Services — one of three classification proposals already formally submitted to and received by the U.S. Census Bureau's ECPC.
One Executive Order from @realDonaldTrump directing Census and OMB to adopt these NAICS codes — and this becomes mandatory, standardized, and public for every major corporation in America.
American workers deserve the truth. A single standardized dataset currently does not exist.
I've built it.
Read all OnShoringAmerica framework white papers from: onshoringamerica.com/framewo…
🇺🇸 OnShoringAmerica #LaborTransparency #ALUR #AIDisplacement #AmericanWorkers #UCLR #OnShoringAmerica #ShowUSTheData


2
7
10
227
Jun 4
GLUR™ — 10.8 million workers.
Lawful Permanent Residents — Green Cards — working inside U.S. companies.
No federal agency tracks it by company.
No industry publishes it.
No earnings report discloses it.
That's ~32% of all labor substitution in the U.S. economy — completely invisible.
SHOW U.S. THE DATA!
GLUR™ fixes that.
The Green Card Labor Utilization Ratio is a single, standardized score that tells you exactly what percentage of any company's total workforce consists of Green Card holders.
Company X: GLUR™ of 45%
Company Y: GLUR™ of 8%
Now you know.
Here's what the government actually tracks:
✅ Green Card issuances
✅ PERM sponsorship applications
✅ How many people became Green Card holders each year
Here's what it does NOT track:
❌ How many active Green Card holders are currently employed at any specific company
❌ What percentage of any company's total headcount they represent
❌ What percentage of any industry's workforce consists of Green Card holders
❌ How that reliance has shifted year over year
And here's the part nobody talks about:
Millions of Green Card holders were never employer-sponsored.
They arrived through family pathways. Diversity lottery. Humanitarian programs.
They never appear in any employer-linked database.
They are completely invisible to every federal reporting system that exists today.
That's not a policy statement.
That's a data gap.
Before we debate whether any of this is good or bad — shouldn't we at least know how much?
SHOW U.S. THE DATA!
That's OnShoringAmerica's Phase 1. Transparency.
GLUR™ is the second of six supporting ratios that feed directly into the master score:
UCLR™ — U.S. Citizen Labor Ratio
The single number that answers the question every American worker deserves to know:
What percentage of this company's workforce is made up of ready-and-able U.S. Citizens?
Six ratios. One master score. Complete transparency.
OLUR™ → Offshore contractors ✅ posted
GLUR™ → Green Card holders ← You are here
HLUR™ → Humanitarian / EAD
VLUR™ → Visa workers
SLUR™ → Foreign students
ALUR™ → AI & Automation
UCLR™ → The Master Score
Every ratio feeds UCLR™. Every post in this series builds the case.
GLUR™ is tied to NAICS 561399 — one of three classification proposals already formally submitted to and received by the U.S. Census Bureau's ECPC.
One Executive Order from @realDonaldTrump directing Census and OMB to adopt these NAICS codes — and this becomes mandatory, standardized, and public for every major corporation in America.
American workers deserve the truth. A single standardized dataset currently does not exist.
I've built it.
Read all OnShoringAmerica framework white papers from: onshoringamerica.com/framewo…
🇺🇸 OnShoringAmerica #LaborTransparency #GLUR #GreenCard #AmericanWorkers #UCLR #OnShoringAmerica #ShowUSTheData


2
9
15
224
Jun 4
~12.3 million workers. Serving U.S. companies located outside U.S. borders.
No federal agency tracks it by company. No industry publishes it. No earnings report discloses it.
That's ~36% of all labor substitution in the U.S. economy — completely invisible.
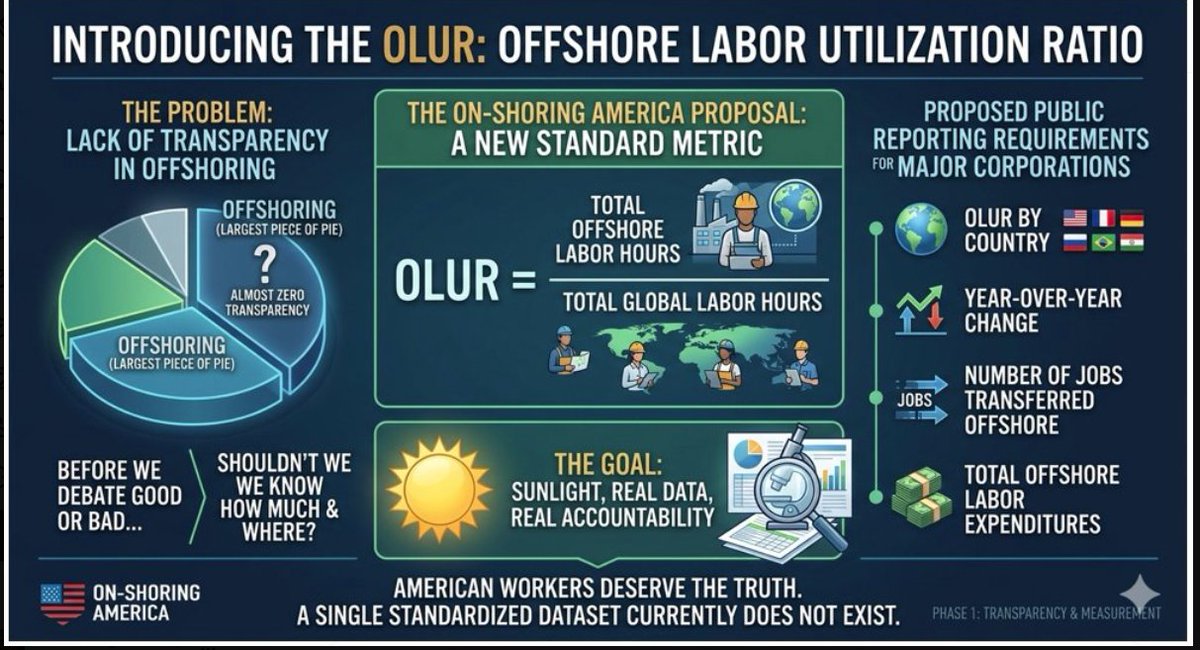
OLUR™ fixes that.
The Offshore Labor Utilization Ratio is a single, standardized score that tells you exactly how much any company, industry sector, state, or industry relies on offshore labor as a percentage of its total workforce.
- Company X: OLUR™ of 67%
- Company Y: OLUR™ of 12%
Now you know.
Before we debate whether offshoring is good or bad — shouldn't we at least know how much and where?
That's Phase 1. Transparency!
OLUR™ is tied to NAICS 561399 — one of three classification proposals already formally submitted to and received by the U.S. Census Bureau's ECPC.
One Executive Order from @realDonaldTrump directing Census and OMB to adopt these NAICS codes — and this becomes mandatory, standardized, and public for every major corporation in America!
American CITIZEN workers deserve the truth. A single standardized dataset currently does not exist.
I've built it.
Read all OnShoringAmerics framework white papers from: onshoringamerica.com/framewo…
🇺🇸 OnShoringAmerica
3
8
14
183
Jun 3
🚨 This is exactly what the OnShoringAmerica Labor Transparency Framework can deliver.
One clear, powerful metric — UCLR™ (U.S. Citizen Labor Ratio) — showing how strongly industries and companies are prioritizing ready-and-able American citizen workers.
See the full dashboard in Image 1
Clean list view in Image 2 (fictitious data)
The framework lets you slice this data at any level — by industry sector, company, state, region, metro area, or congressional district — plus all supporting ratios (Offshore, Green Card, Visa, Humanitarian, Student, and AI Labor Utilization).
The real question is: Why doesn’t the U.S. Government already provide this?
We have the agencies. We have most of the data streams.
What we’re missing are the three NAICS codes I submitted, currently sitting on the U.S. Census Bureau / ECPC desk (submitted and acknowledged in April 2026).
This needs a Presidential Executive Order to fast-track the 2027 NAICS revision and finally close the Critical Data Gap.
Transparency First. Accountability Follows.
This is what honest, citizen-focused labor market visibility SHOULD look like in America.
Full Transparancy framework, NAICS proposals & ECPC confirmation:
onshoringamerica.com/framewo…
6
5
16
301
Jun 3
UCLR™ Full Labor Transparency Framework
⚠ IMPLEMENTATION CONTINGENT ON EXECUTIVE ACTION!
The OnShoringAmerica ratio structures and metrics are contingent upon President Trump @realDonaldTrump directing the Census Bureau and OMB — via Executive Order — to adopt the three NAICS code proposals currently pending before the ECPC.
Until that EO is issued and those NAICS codes are introduced, this framework cannot be formally implemented or mandated!
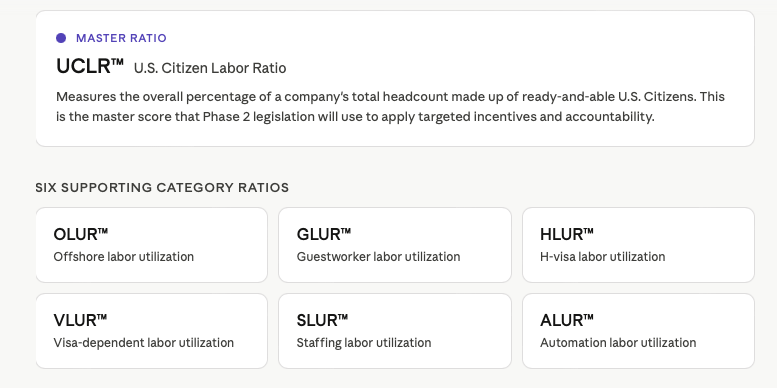
The UCLR™ System: Seven Workforce Ratios
The OnShoringAmerica Labor Transparency Framework is built around seven interconnected ratios that provide the first comprehensive, standardized view of how companies allocate their workforce.
At the center is the master UCLR™; six category-specific ratios support it, each quantifying one major form of labor substitution. Together, they transform fragmented data into clear, comparable percentages revealing the true composition of corporate workforces across America.
UCLR™ — U.S. Citizen Labor Ratio (Master Ratio)
Measures the overall percentage of a company's total headcount made up of ready-and-able U.S. Citizens. This is the master score that Phase 2 legislation will use to apply targeted incentives and accountability.
Ratio descriptions: onshoringamerica.com/uclr-fu…


2
3
10
166
Jun 3
OnShoringAmerica – UNPRECEDENTED Full Labor Transparency Framework
Today, I officially launch the complete "UCLR™ Ratio Framework" — a groundbreaking system that finally measures exactly how strongly American companies prioritize ready-and-able U.S. Citizen workers versus noncitizen offshore, Green Card, visa, humanitarian, student, and AI labor.
At the center is the master UCLR™ – U.S. Citizen Labor Ratio, supported by six category-specific ratios (OLUR™, GLUR™, HLUR™, VLUR™, SLUR™, and ALUR™).
Together, these seven metrics provide the first comprehensive, standardized view of workforce composition in the American economy.
Each ratio document explains its purpose, formula, and methodology — all grounded in the three NAICS proposals already submitted to the ECPC. Once implemented, they will deliver clear, comparable data across companies, industries, and states.
Phase 2 legislation will use the overall UCLR™ score to determine meaningful incentives for companies that prioritize ready-and-able American citizen workers and proportionate accountability for those that don’t.
Transparency First. Then Accountability.
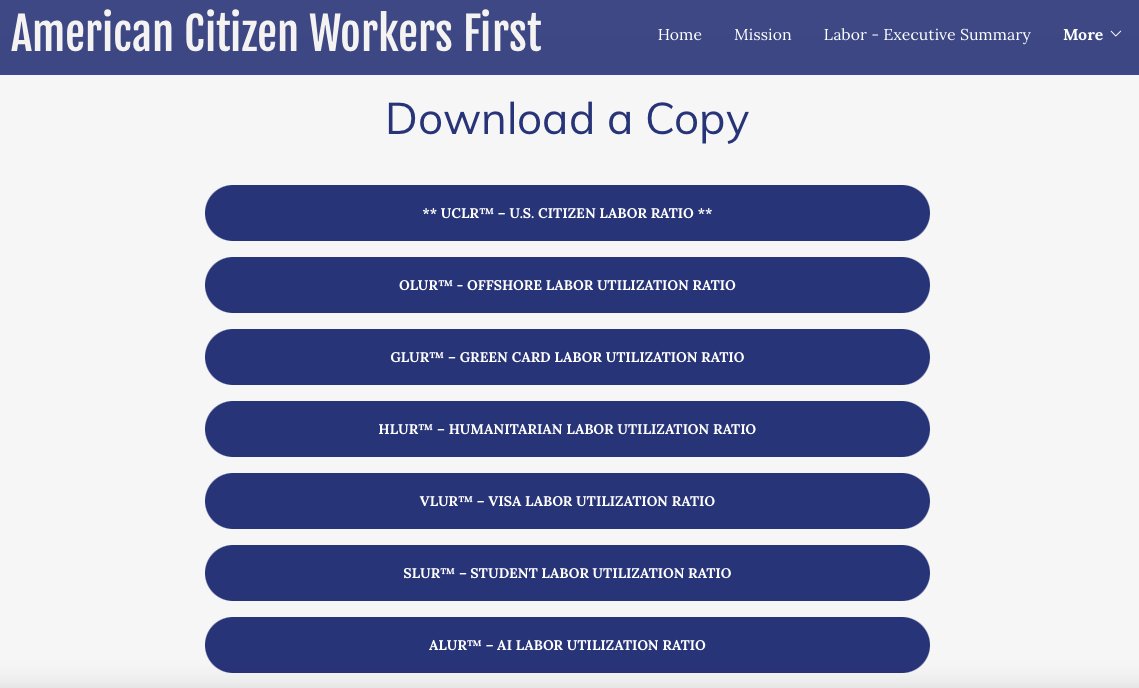
Full Master Document All Six Ratio Documents →
onshoringamerica.com/uclr-fu…
American citizen workers and students deserve to be first in line again.
10
16
48
1,934

Jun 1
Digital Euro (CBDC) Regulasi Maju
"A great moment for Europe and for us" — kata Piero Cipollone, anggota Executive Board ECB — saat penandatanganan kesepakatan dengan tiga organisasi standar Eropa: ECPC, nexo standards, dan Berlin Group untuk memajukan regulasi dan pembayaran Digital Euro.
Digital Euro CBDC akan memiliki status LEGAL TENDER (alat pembayaran sah), sama seperti Euro fisik. Artinya, penerimaannya akan diwajibkan (dan mendorong adopsi) di seluruh Uni Eropa.
> “Manfaat dari standar digital euro akan terwujud "sebelum" digital euro diterbitkan. Begitu rekan legislatif Uni Eropa mengadopsi Regulasi digital euro, yang memberikan kepastian bahwa standar tersebut berlaku di seluruh wilayah euro berkat "status legal tender" digital euro, maka penyedia solusi pembayaran Eropa dapat memperluas skala melampaui batas negara.”
### Penjelasan Singkat
Pada 24 April 2026, ECB menandatangani kesepakatan dengan organisasi standar Eropa untuk menggunakan standar teknis yang sudah ada (seperti pembayaran online, tap-to-pay, koneksi merchant-PSP, dan pembayaran berbasis alias seperti nomor telepon).
Tujuan utamanya:
- Menciptakan alternatif pembayaran Eropa yang gratis dan terbuka.
- Mengurangi ketergantungan pada sistem kartu internasional (Visa/Mastercard).
- Memberikan kepastian investasi bagi merchant dan penyedia pembayaran.
### Status Legal Tender
Dengan status legal tender, merchant di wilayah euro "wajib" menerima Digital Euro untuk pembayaran (dengan beberapa pengecualian, misalnya jumlah sangat kecil atau alasan teknis). Hal ini bertujuan memastikan penerimaan yang luas dan mendorong adopsi.
### Timeline (per pertengahan 2026)
- Legislasi: Diperkirakan diadopsi pada tahun 2026.
- "Pilot": Kemungkinan pilot internal mulai pertengahan 2027 (selama 12 bulan).
- "Penerbitan": Kemungkinan tahun 2029 (keputusan akhir setelah legislasi selesai).
### Implikasi Utama
"Keuntungan menurut ECB":
- Interoperabilitas yang lebih baik antar negara Eropa.
- Biaya integrasi lebih rendah.
- Memperkuat kedaulatan moneter Eropa.
- Fitur privasi (termasuk kemungkinan pembayaran offline).
"Kekhawatiran dan Risiko":
- Potensi pengawasan pemerintah yang lebih besar.
- Pengurangan penggunaan uang tunai.
- Risiko disintermediasi bank (dana masyarakat berpindah ke CBDC).
- Kekhawatiran tentang kontrol dan “programmable money”.
ECB menekankan bahwa Digital Euro akan menjadi **pelengkap** uang tunai, bukan pengganti. Namun, banyak pihak tetap waspada terhadap potensi dampaknya terhadap privasi dan kebebasan finansial.
Apakah Anda ingin saya jelaskan bagian tertentu lebih detail dalam bahasa Indonesia? Misalnya implikasi ekonominya, perbandingan dengan CBDC negara lain, atau risiko privasinya?
May 31

Digital Euro (CBDC) Regulation Advances.
"A great moment for Europe and for us" - says European Central Bank (ECB) executive Piero Cipollone - about signing agreements with three European standard‑setting organisations – ECPC, nexo standards and the Berlin Group – to advance digital euro regulation and payments.
The Digital Euro CBDC will have a LEGAL TENDER status, just like the Euro, mandating its acceptance (and hence adoption) around the EU:
"The benefits of the digital euro standard will materialise ahead of digital euro issuance. Once EU co-legislators adopt the digital euro Regulation, providing certainty that the standards will apply across the euro area given the digital euro’s *legal tender status*, European payment solutions providers would be able to scale up beyond national borders."
1
3
101
May 31
American Corporations — You Can Run, But You Can't Hide!
For decades, American corporations have exploited a classification system so outdated and fragmented that no one — not the government, not shareholders, not American citizen workers — could see the full picture.
This ends now!
Three new NAICS classifications have already been formally submitted to and received by the Census Bureau's Economic Classification Policy Committee (ECPC) @uscensusbureau. A single Executive Order @realDonaldTrump is all that stands between the status quo and the most transparent workforce reporting system America has ever had!
No new bureaucracy.
No legislative battle.
Just sunlight — and corporations have never had less of it than they're about to.
And for corporations that ship American jobs offshore — there's now a metric with your name on it:
OLUR™ = Total Offshore Labor Hours ÷ Total Global Labor Hours
Offshoring is the single largest form of labor substitution in America today!
Nearly 12.3 million labor equivalents, representing 36% of the total. Yet it remains the least measured and most invisible force in the American labor market.
That ends with OLUR™.
A corporation performing 65% of its labor offshore carries an OLUR™ of 65%. No footnotes. No asterisks. No place to hide.
For the first time, the data will show exactly how many American citizen jobs are being filled by legal non-citizen labor, offshore contractors, and AI substitution — by company, by industry, by sector, year over year. Publicly visible to every shareholder, every policymaker, and every American citizen worker.
See those question marks? Every American corporation will be required to fill in its own pie chart — for all of America to see!
The day of reckoning isn't coming. It's already been filed.
See the proposals, the NAICS reform documents, the OLUR™ framework, and the full structural plan at: 👉 onshoringamerica.com/framewo…
American Citizen Workers First.
@Jdvance @StephenM @Sonderling47

1
27
66
594