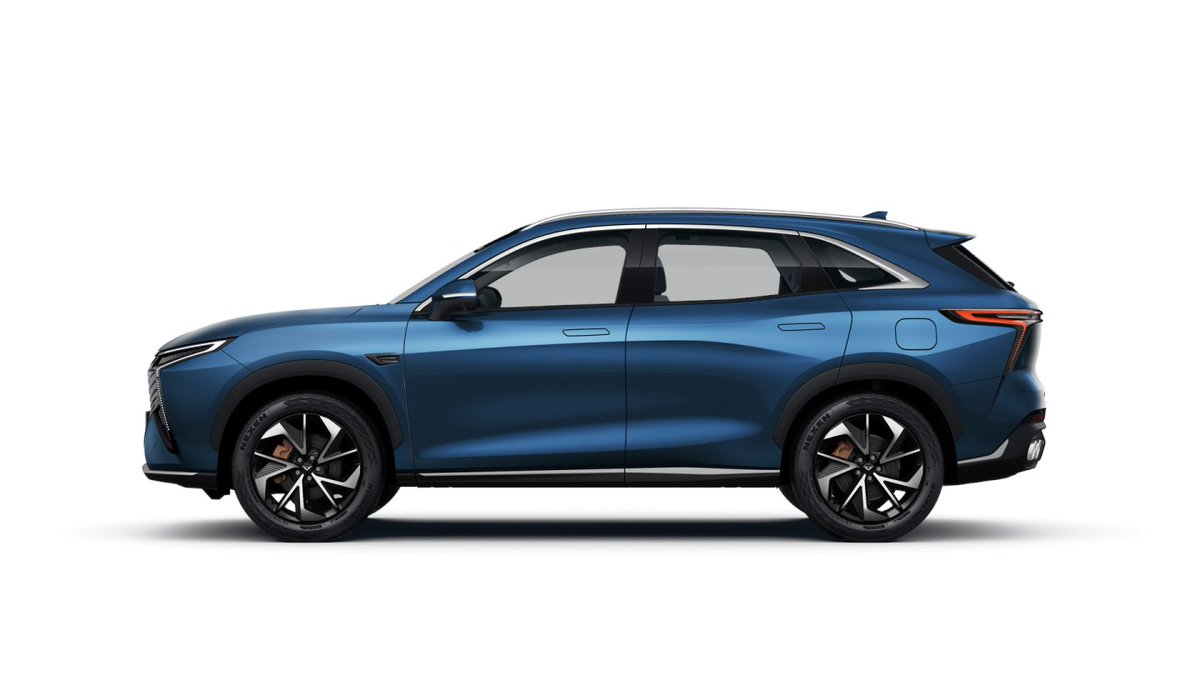
Kaiyi X7, nuevo SUV llega a Argentina en versiones naftera e híbrida.
de AUTO InfoBlog 17 junio, 2026
gsegno2.wordpress.com/2026/0…


53

Jun 14
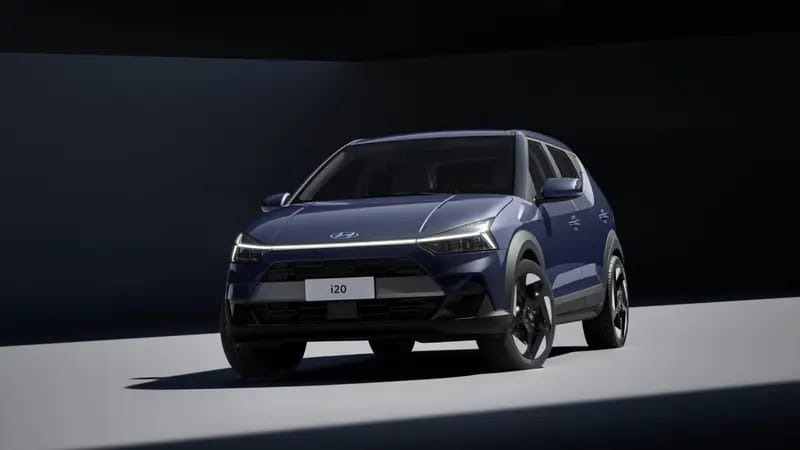
Se presenta el Hyundai i20 en Brasil.
de AUTO InfoBlog 14 junio, 2026
gsegno2.wordpress.com/2026/0…


30
Jun 13
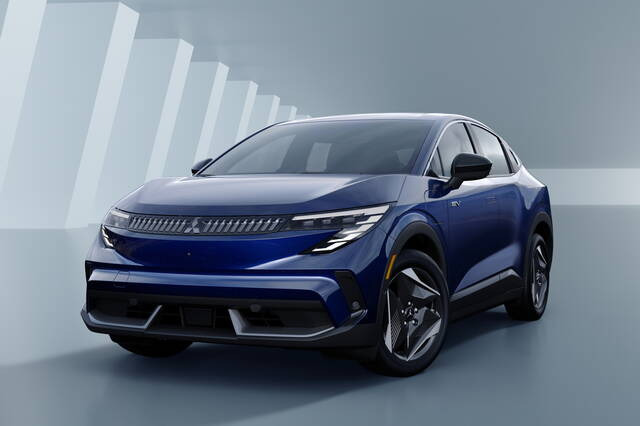
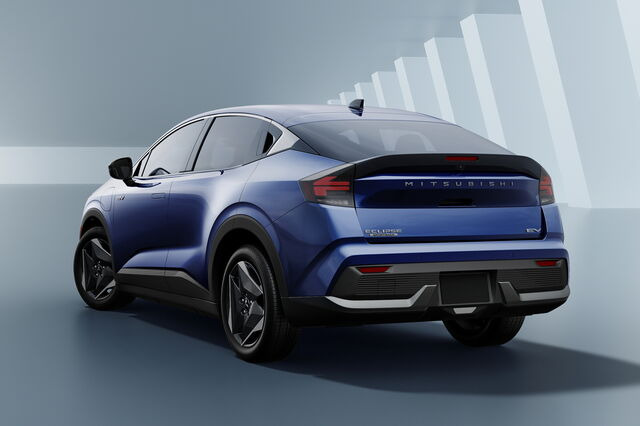
Nuevo Mitsubishi Eclipse 2027 es un crossover eléctrico.
de AUTO InfoBlog 13 junio, 2026
gsegno2.wordpress.com/2026/0…

7
Jun 10
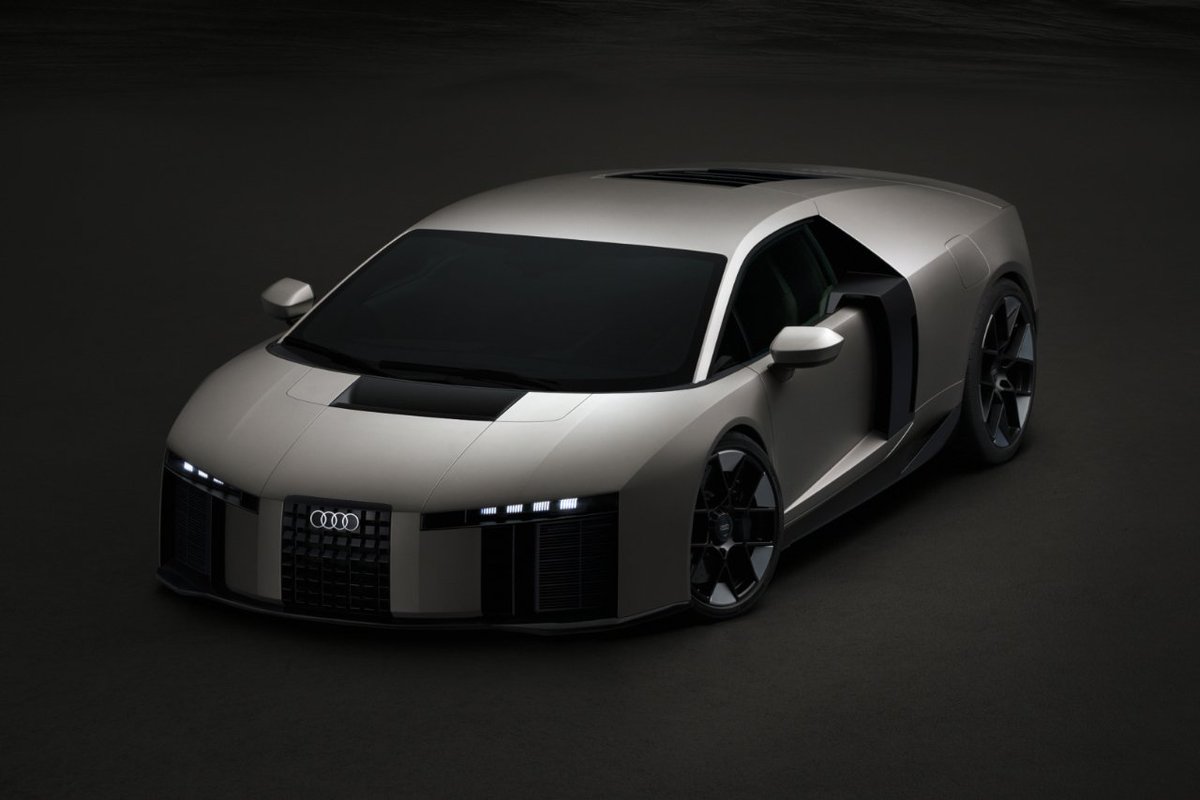
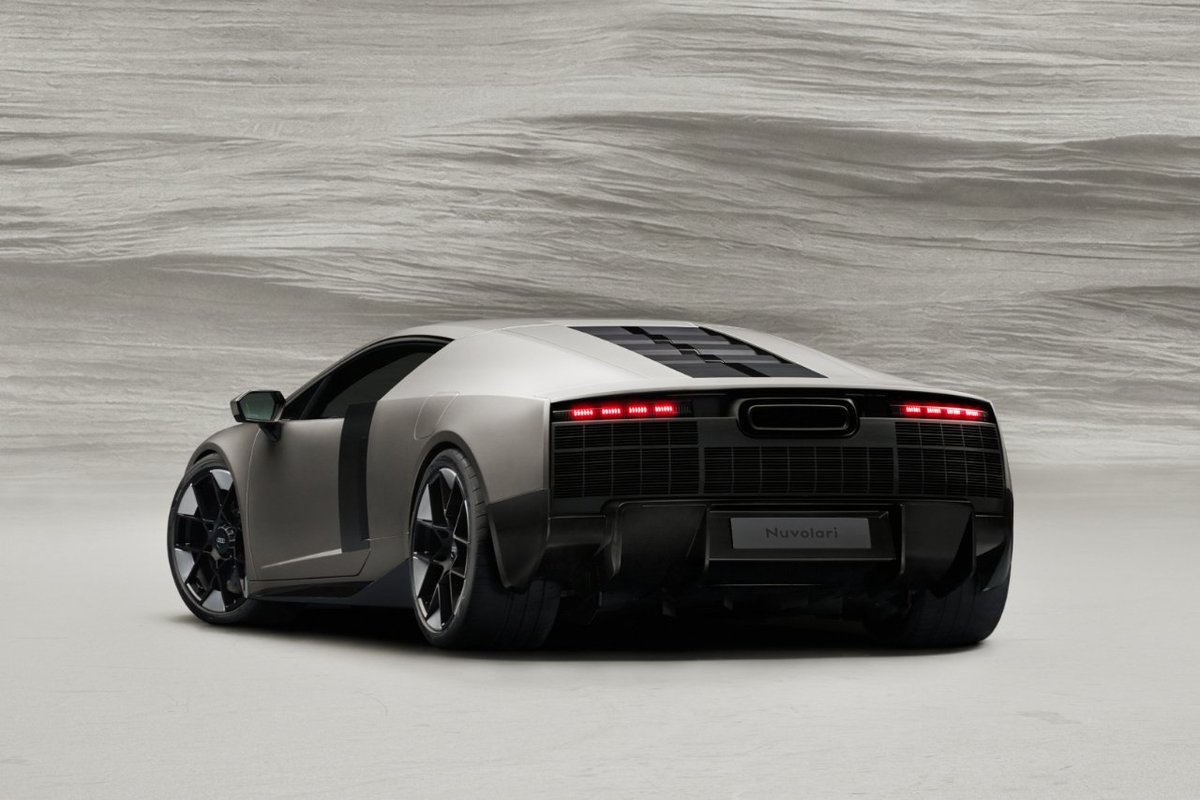
Audi Nuvolari (2026), nuevo superdeportivo híbrido de 1001 CV.
de AUTO InfoBlog 10 junio, 2026
gsegno2.wordpress.com/2026/0…


11


May 12
Vzhledem k tomu, že infoblog neustále avizuje ukončení provozu a já bych si chtěl blog o Amoriaxu udržet, přesunul jsem ho kompletně na blogspot, kde bude nadále pokračovat. Doufám, se vám bude dobře číst na této nové platformě! 😌
amoriax.blogspot.com/
3
157

Mar 10
NETGEAR Advice Infoblog >> British Spring rule: if there’s sun, we’re outside Netgear netgear.com ... now live @ intouchrugby.com ! #netgear #ad #mothersday

50

Mar 9
¡Basta de textos aburridos! 🤯 Con Infoblog, convierte tus apuntes y materiales en infografías impactantes al instante. Ideal para docentes que buscan dinamizar el aula. #EdTech #InfografíasAI #RecursosEducativos gesvinromero.com/2026/03/09/… via @gesvin

13
30
1,423

Feb 6
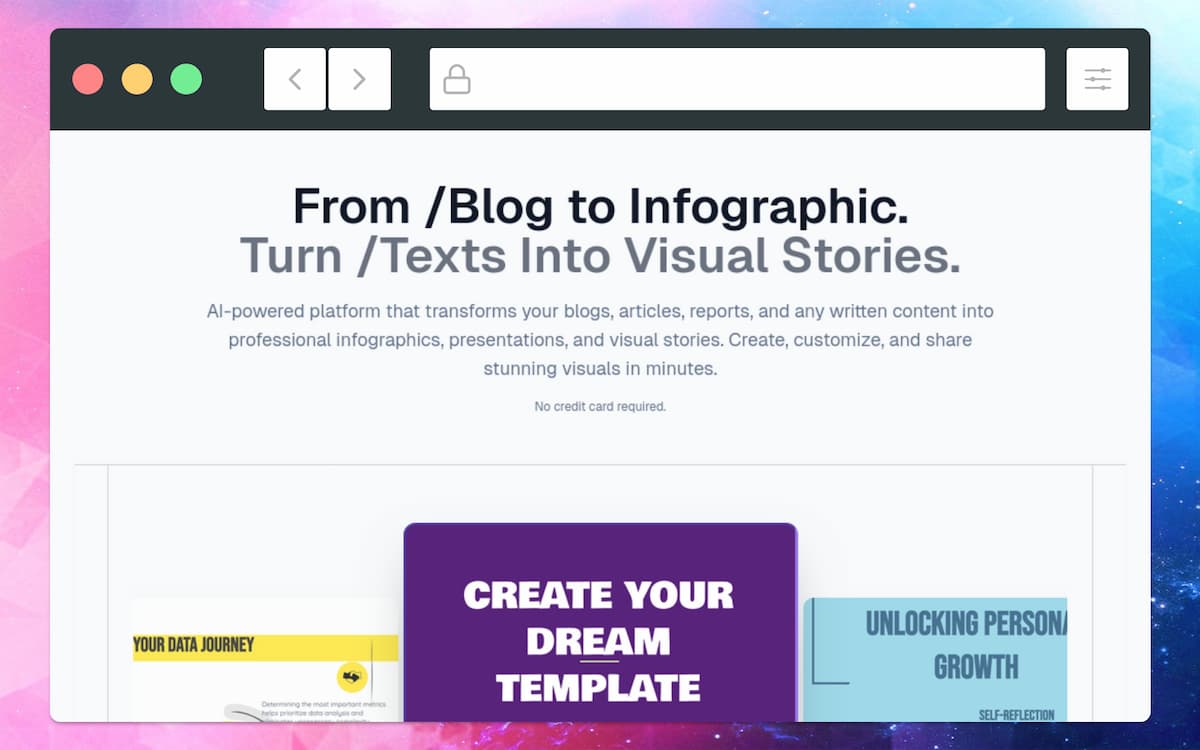
Convierte tus #artículos e informes en piezas visuales listas para compartir. ✨
InfoBlog transforma texto en #infografías, presentaciones y visual stories en minutos.
¡Tienes que probarlo!
➡️softandapps.info/2026/02/06/…
5
169

Feb 6
So I listened to you guys and I launched @useinfoblog today🤓producthunt.com/products/inf…
Hey everyone 👋
So this problem has been following me for years.
Back in college, generating slide decks felt overwhelming. Like genuinely draining.
I’d sit down thinking, “this won’t take long”… and suddenly 8–12 hours were gone.
Same thing with blogs and written content. I’d spend so much time writing something solid, only for it to barely get read.
Presentations were the worst.
I could lose an entire evening just trying to make 8–12 slides look decent.
I tried other tools. They helped, sure.
But even then, it still took 6–7 minutes just to generate something basic. And after that? More tweaking. More fixing. More time.
So I paused. Worked on other things.
Then recently I came back to this problem with fresh eyes and that’s when the real issue became obvious.
Humans are wired to process visuals, not walls of text.
But most AI image tools hallucinate text, flatten everything into PNGs, and leave you stuck with designs you can’t edit. So even when it looks faster, it still isn’t.
That frustration is what pushed me to build InfoBlog.
The goal was simple: take what normally costs hours (or days, if you’re like me 😅) and turn it into a few clicks.
You attach your blog URL, PDF, or DOCX, choose whether you want an infographic or slide deck, and generate.
The key difference is how it works.
InfoBlog is a glass-box AI.
It doesn’t just “paint” visuals it creates real, editable SVG designs based on your actual content. Fonts, colors, layouts, images you can change everything.
From text → visuals → ready to share, in seconds.
If this resonates, we’re live on Product Hunt today you can also give us an upvote there. I’d genuinely appreciate the support
I’m genuinely curious: what kind of content do you personally find hardest to visualize
2
5
63

2 Dec 2025
3/ wie Löhne. Das mag in wirtschaftl. starken Zeiten mit vielen Beitragszahlern angehen, nicht aber angesichts der demograf. wie wirtschaftl. Situation. Der Verfall des Rentenwerts durch Inflation muss ausgeglichen werden. Mehr geht nicht. Irgendwann mache ich einen Infoblog. 3/3
2
6
99

25 Nov 2025
👩🏻⚕️👨🏼⚕️💜 comparto nuestra editorial @CarpioOrantes23 en el #science speaks infoblog de @idsainfo para reforzar la necesidad de vacunación como prevención primaria de eventos cardiovasculares, autoimmunes y neurológicos (fenotipos de longcovid).


2
5
200

29 Jul 2025
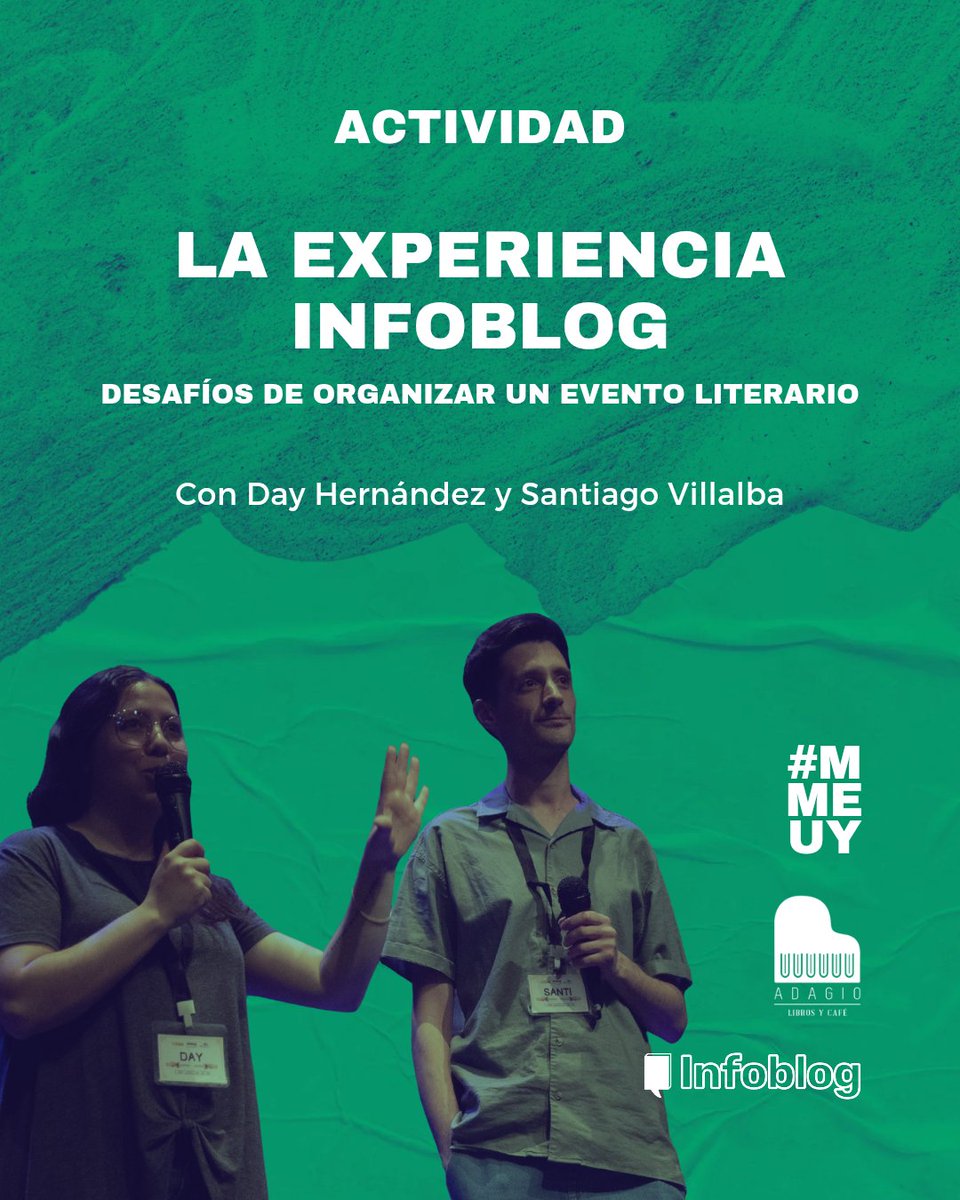
El sábado 2 de agosto a las 17 te esperamos en Adagio Librería Café para compartir una charla sobre los desafíos de organizar un evento literario como el Infoblog, que reúne a editoriales y bookfluencers de todo el país.
Inscribite acá:
forms.gle/SQ4RMLSDt7Dyd1KL7
1
1
257

16 Jul 2025
Que?… espera, que?😳 eso es muy fuerte😱 infoblog/yasaben aviso cuando pactaron pp y psoeta para controlar las redes sociales, de que esto iba a pasar. A infoblog lo están jodiendo, pero bien🤦🏼♂️ todo es humo. Están jodidos, desesperados y son muy peligrosos


2
46

5 Jul 2025
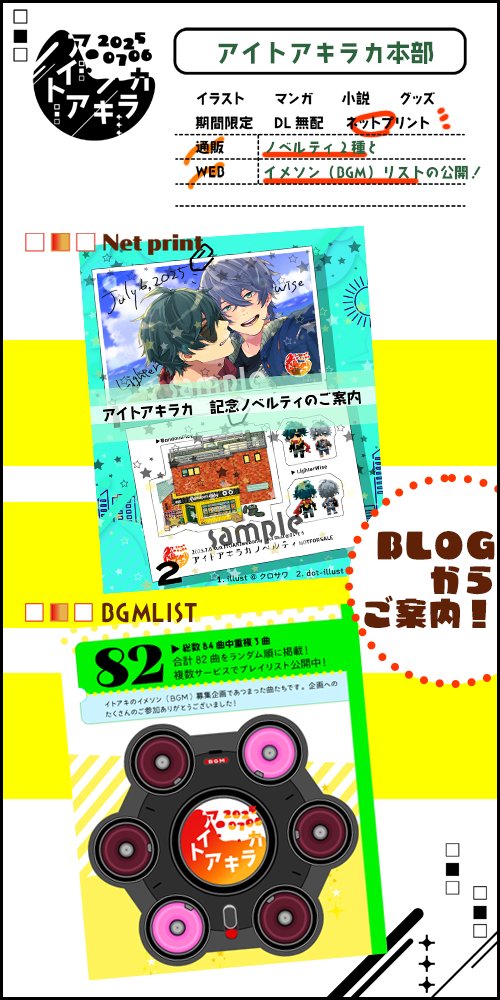
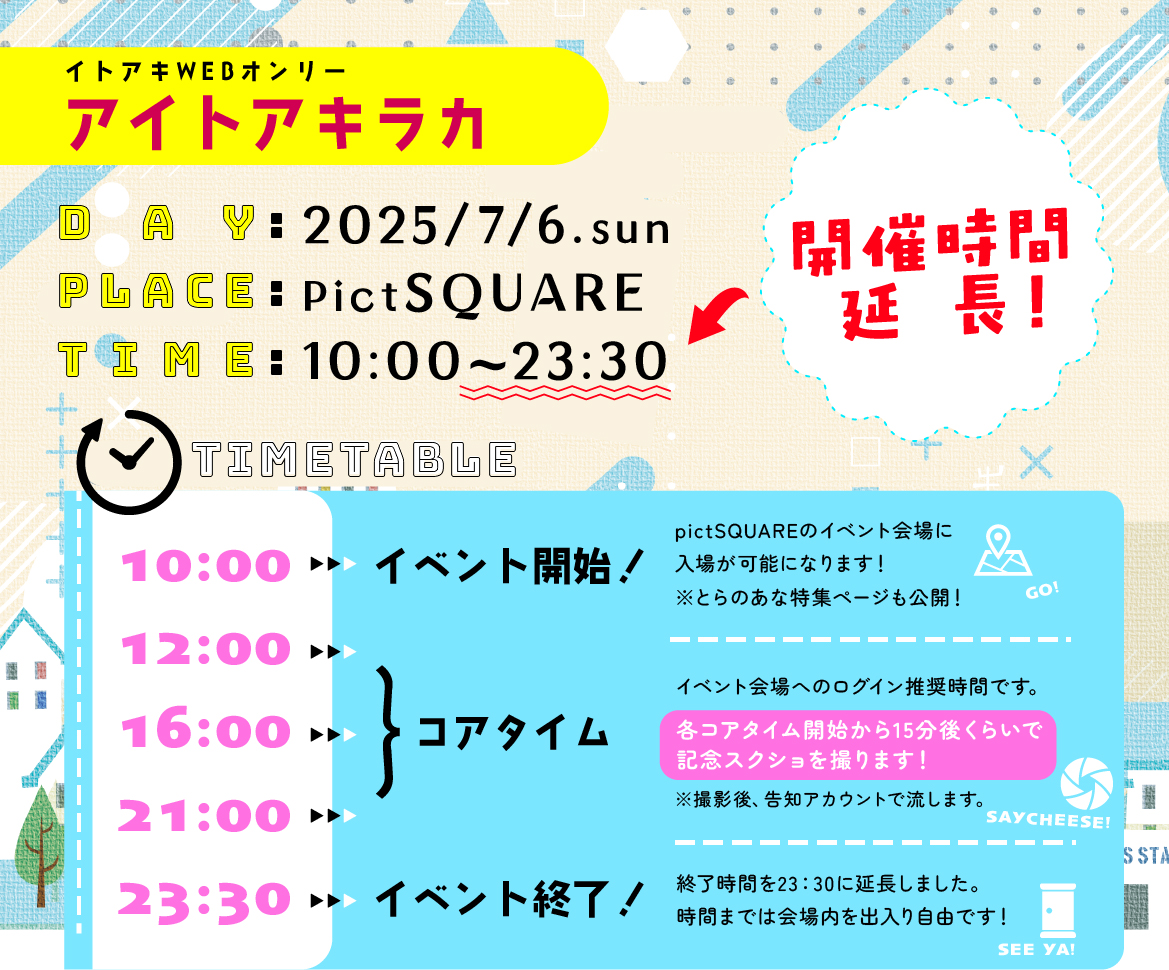
イトアキWEBオンリー #アイトアキラカ 開催まであと1日となりました!
▶️こちらはアイトアキラカ本部のお品書きです。ネットプリントの番号は当日にinfoBLOGからご案内予定!
▶️開催時間を延長しています!(再掲)
▶️参加サークルさんの情報は #アイトアキラカinfo タグでも確認できます!
>>
1
9
27
4,331
8 Jun 2025
・BGM募集フォーム forms.gle/seADPw3djFR6Ad9i9
・BOOTH(テンプレート・アバター配布) tiptoe.booth.pm/
・infoBLOG itak-aitoakiraka.bitter.jp/w…

3
3
1,848
18 Feb 2025
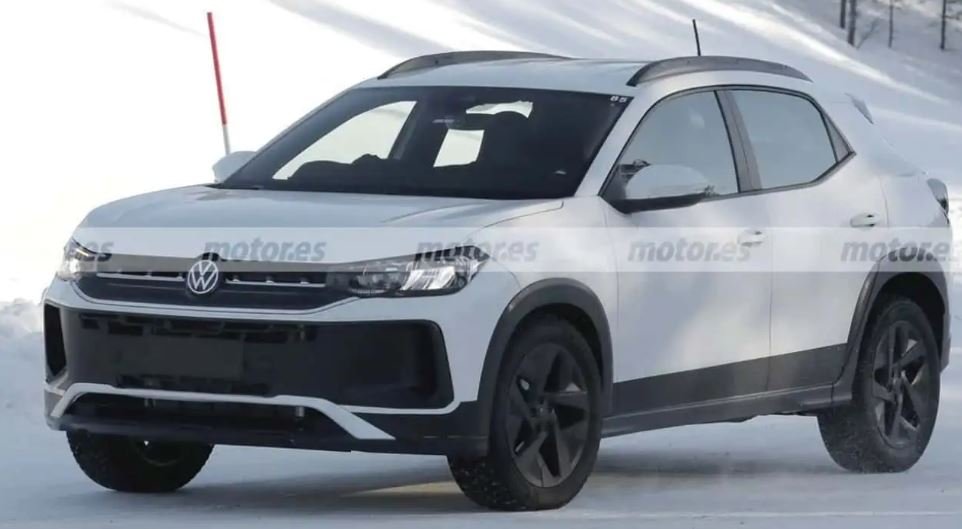
Volkswagen Tera 2025 se dejó ver en la nieve.
de AUTO InfoBlog 18 febrero, 2025
gsegno2.wordpress.com/2025/0…


1
2
390
19 Jan 2025
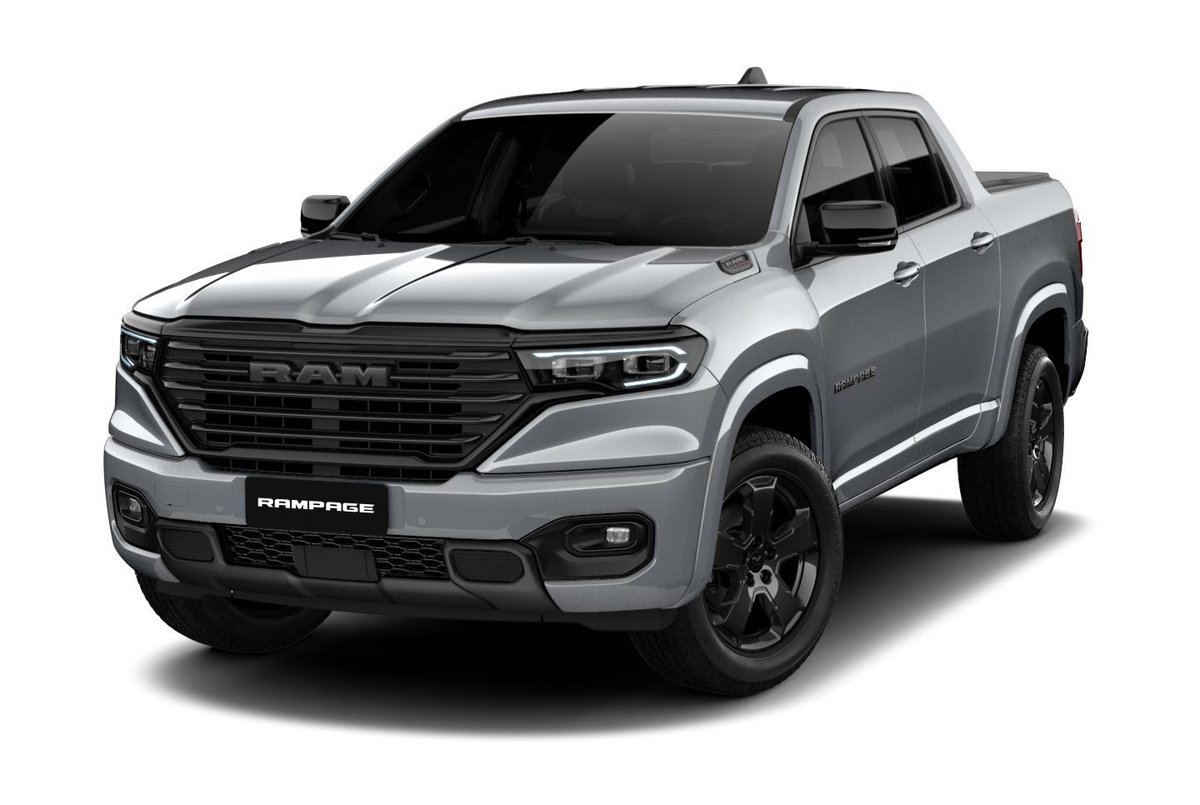
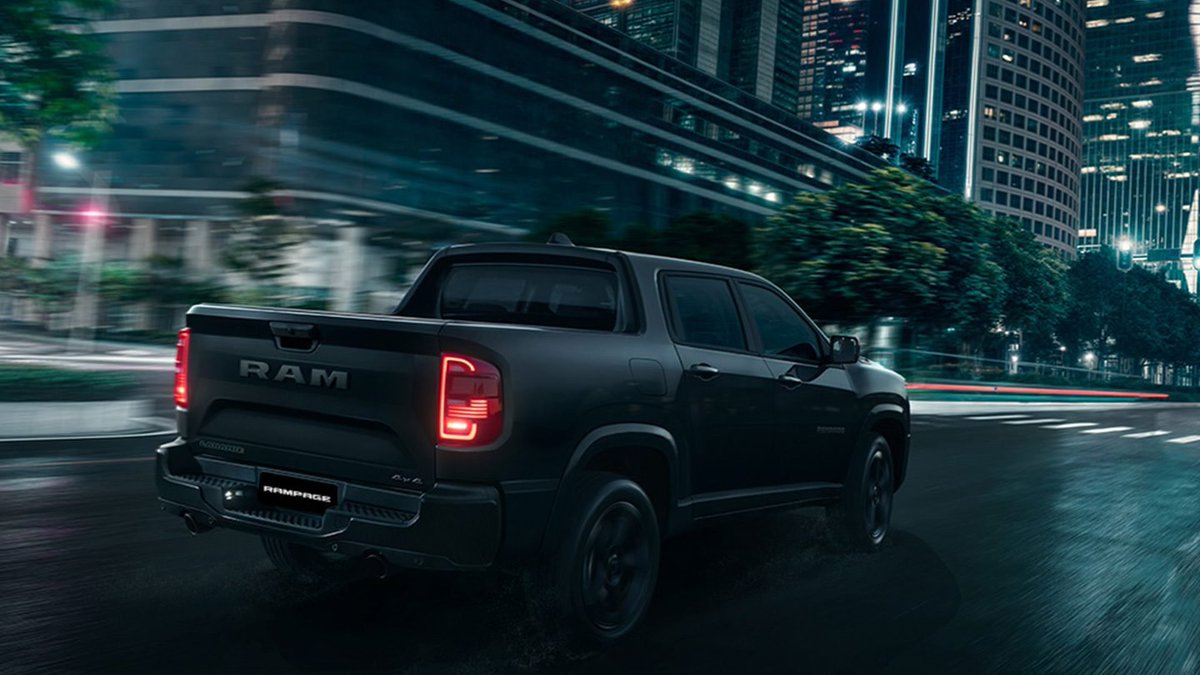
Nueva versión RAM Rampage Laramie Night Edition 2025.
de AUTO InfoBlog 19 enero, 2025
gsegno2.wordpress.com/2025/0…
41


10 Dec 2024
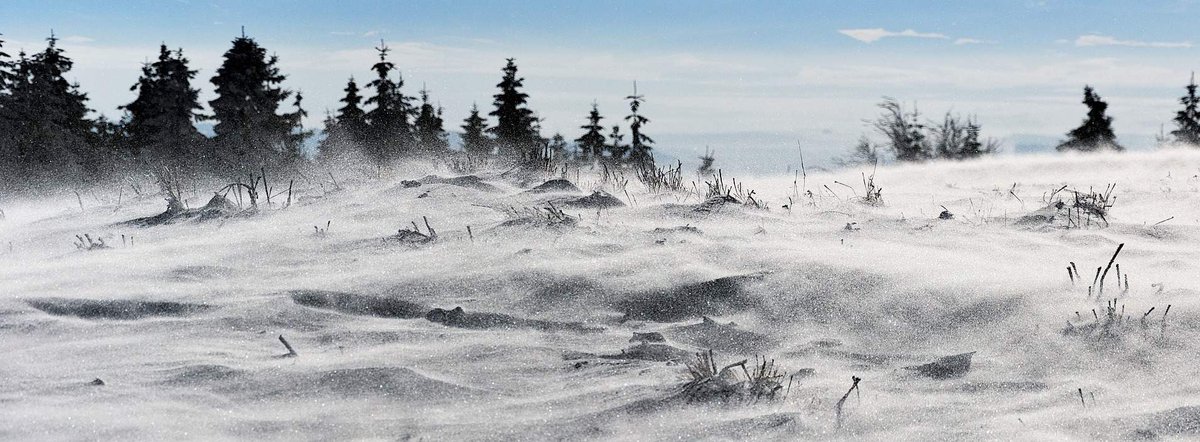
Der Winter ist wieder da, es ist entsprechend kalt. Doch zwischen der gemessenen Temperatur und der gefühlten Temperatur gibt es Unterschiede. Der sogenannte Windchill-Faktor kommt zum Tragen. Was hat es damit auf sich?
Infoblog -> met.to/vmmy (me)
6
332