Nonye Lumm retweeted

Jun 13
NOKIA and BlackBerry!
Still using a BlackBerry Key2
1
1
14

Pak Ganjar emang semenjak kalah seru sih low key2 aja. Jadi PDIP jaman dahulu. Lari2. Maaraton. Olah raga. Tapi keliling2 hahahaha
18
2,968

Jun 13
Перший твіт з BlackBerry Key2. Набирати текст на фізичній клавіатурі телефона без кирилиці не те ж саме, що на великій клавіатурі. Дуже повільно йде поки що

10
48
4,606

2 unbelievables:
1. read intro- #espn still suhcking off Wemby. he's come up small in #nbafinals losses
2. #gospursgo Coach says they dictated winner in all 4 games. admits 3 gags and that is the key2 coming back? gaggers gonna gag coach? espn.com/nba/story/_/id/4903…
#alswaysknicks
1
1
63


Jun 11
I liked my blackberrys...downfall is there latest phone was key2 & it's well past end of life ,will get no more service updates.too bad BB quit making phones..
9

Jun 10
Code part 2
# Define the key correlations we want to test
corr_pairs = [
('Width_proxy', 'IPR', 'width_proxy', 'ipr'),
('Width_proxy', 'Localization', 'width_proxy', 'localization'),
('λ_max', 'IPR', 'lambda_max', 'ipr'),
('Width_proxy', 'λ_max', 'width_proxy', 'lambda_max'),
]
r_obs = {}
for name1, name2, key1, key2 in corr_pairs:
r, _ = pearsonr(metrics_obs[key1], metrics_obs[key2])
r_obs[(name1, name2)] = r
print(f"Observed r({name1}, {name2}) = {r: .4f}")
# === Surrogate testing ===
n_surrogates = 300 # good balance between power and runtime (increase if needed)
print(f"\nRunning {n_surrogates} phase-randomized surrogates...")
surrogate_rs = {(name1, name2): [] for name1, name2, key1, key2 in corr_pairs}
for s in tqdm(range(n_surrogates), desc="Surrogates"):
# Phase randomize each channel independently
data_surr = np.array([phase_randomize(ch) for ch in data])
# Recompute full pipeline on surrogate
fc_surr = compute_dynamic_plv(data_surr, sfreq, verbose=False)
metrics_surr = compute_topc_metrics(fc_surr)
for name1, name2, key1, key2 in corr_pairs:
r_s, _ = pearsonr(metrics_surr[key1], metrics_surr[key2])
surrogate_rs[(name1, name2)].append(r_s)
# === Empirical p-values summary ===
print("\n" "="*70)
print("SURROGATE TEST RESULTS (Phase randomization null)")
print("="*70)
results_table = []
for name1, name2, key1, key2 in corr_pairs:
r_o = r_obs[(name1, name2)]
r_surr = np.array(surrogate_rs[(name1, name2)])
# Two-sided empirical p-value
count_extreme = np.sum(np.abs(r_surr) >= np.abs(r_o))
p_emp = (count_extreme 1) / (n_surrogates 1)
mean_surr = np.mean(r_surr)
std_surr = np.std(r_surr)
sig = "***" if p_emp < 0.001 else "**" if p_emp < 0.01 else "*" if p_emp < 0.05 else "ns"
print(f"\n{name1} ↔ {name2}")
print(f" Observed r = {r_o: .4f}")
print(f" Surrogate mean = {mean_surr: .4f} ± {std_surr:.4f}")
print(f" Empirical p = {p_emp:.4f} {sig}")
results_table.append({
'pair': f"{name1}–{name2}",
'r_obs': r_o,
'r_surr_mean': mean_surr,
'r_surr_std': std_surr,
'p_emp': p_emp,
'sig': sig
})
# Save results
np.save(os.path.join(out_dir, 'surrogate_r_distributions.npy'),
{str(k): np.array(v) for k,v in surrogate_rs.items()})
print(f"\nSaved surrogate correlation distributions to surrogate_r_distributions.npy")
# === Visualization: histograms ===
fig, axes = plt.subplots(2, 2, figsize=(12, 9))
axes = axes.flatten()
for idx, (name1, name2, key1, key2) in enumerate(corr_pairs):
ax = axes[idx]
r_surr = np.array(surrogate_rs[(name1, name2)])
r_o = r_obs[(name1, name2)]
ax.hist(r_surr, bins=40, color='#5DADE2', edgecolor='white', alpha=0.85, density=True)
ax.axvline(r_o, color='#E74C3C', linewidth=2.5, label=f'Observed r = {r_o: .3f}')
ax.axvline(np.mean(r_surr), color='gray', linestyle='--', linewidth=1.5,
label=f'Surr. mean = {np.mean(r_surr): .3f}')
ax.set_title(f'{name1} ↔ {name2}\nEmpirical p = {results_table[idx]["p_emp"]:.4f}', fontsize=11)
ax.set_xlabel('Pearson r (surrogates)', fontsize=10)
ax.set_ylabel('Density', fontsize=10)
ax.legend(fontsize=9)
ax.grid(True, alpha=0.3)
plt.suptitle('Surrogate
29


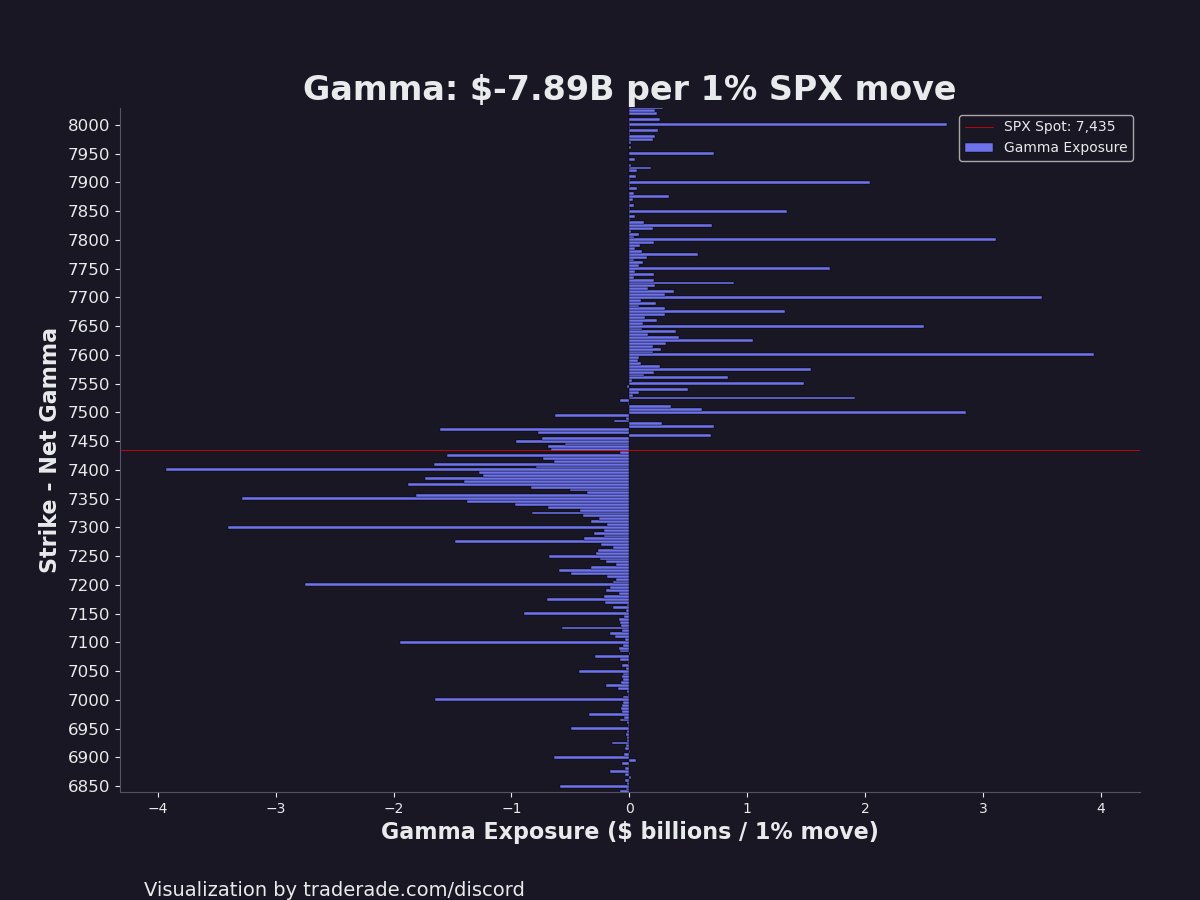
Important $SPX options levels to watch this week
Key3 : 7800
Key2 : 7700
Call Wall: 7600
Gamma2: 7550
Key1 : 7500
Gamma1: 7450
Gamma Flip: 7443
Key2-: 7400
Key1-: 7350
Put Wall: 7300
Key3-: 7200
Vol Trigger: 7000

1
1
1,174

Antares「Auto-Key 2」50%OFFセールが開催中です▽
8,250円 → 4,125円 (税込)
【6月30日まで】コピーしたい楽曲やオーディオサンプルなど各種オーディオファイルのキー/スケール/BPMを自動検出する便利プラグイン「Auto-Key2」が50%OFF dtm-sale.com/30781/ #DTMer #DTM
9
1,343

Jun 9
かつてBlackBerry KEY2を扱っていたこともあるので、UnihertzのTitanシリーズを扱っても良いんじゃないかな。Titan 2 Eliteにはauの色であるオレンジのモデルもあるんだし。 KDDIが「au Flex Style」で“とがったスマホ”を扱う理由 itmedia.co.jp/mobile/article…
293

無難にKEY2(キーズ)とかにしてくれ

𝗞𝗢𝟭𝗞𝗘𝗬𝗭 𝗙𝗔𝗡 𝗡𝗔𝗠𝗘
 ̄ ̄ ̄ ̄ ̄ ̄ ̄ ̄ ̄
KO1KEYZと共に歩んでくださる
皆様のファンネームを
ファンクラブ会員の皆様から大募集!
🗓️募集期間
〜6/14(日)23:59まで
たくさんのご応募お待ちしております!
🔗shinsekai.produce101.jp/news…
#KO1KEYZ
#コイキーズ #코이키즈

180
$SPX options levels worth watching
Key2 : 7800
Key1 : 7700
Call Wall: 7600
Gamma2: 7550
Key3 : 7500
Gamma Flip: 7456
Gamma1: 7450
Put Wall: 7400
Key2-: 7350
Key1-: 7300
Vol Trigger: 7000
1
4
3,236

白確定、じゃあ黒はもう1つ、あと飛行船と、レオちんKEYと…ってなりそうだったので一旦👕2つ、KEY2つでポチった😂ピックはもういれるところないからあと数百円だけどもういいかって自主規制…でも恐ろしい事にまた後程ポチるかも🍿👕着倒してるから追加しそう😂富士急ヤバ
1
2
235
