The Kwisatz Hutterite retweeted

Jun 6
Just fired up MemeLab and simulated the CDC’s worst-case for this Ebola outbreak under only 20% isolation.
Nailed the same explosive trajectory they warned about.
But here’s the twist: my run hits that grim death toll with way fewer total cases.
Low isolation = curve still takes off hard, even with quarantine, vaccine/masks, and on/off lockdowns kicking in later.
Why fewer cases for the same deaths?
I’m running a spatial cellular automaton (N×N grid, local neighborhood spread, finite population). Once local clusters burn through susceptibles, transmission naturally slows even without perfect controls.
Looks like CDC used a stochastic branching-process model built for early explosive spread in an unlimited pool. Different tools, different assumptions.
That’s the beauty of modeling:
- Branching processes shine at “how likely is a massive early blowup?”
- Spatial CA sims like mine show the full burn local clustering, real-world constraints, and the long tail.
These projections aren’t destiny.
Play with the exact setup I used at thememeticist.github.io/Meme… tweak the dials yourself and watch the curve bend.
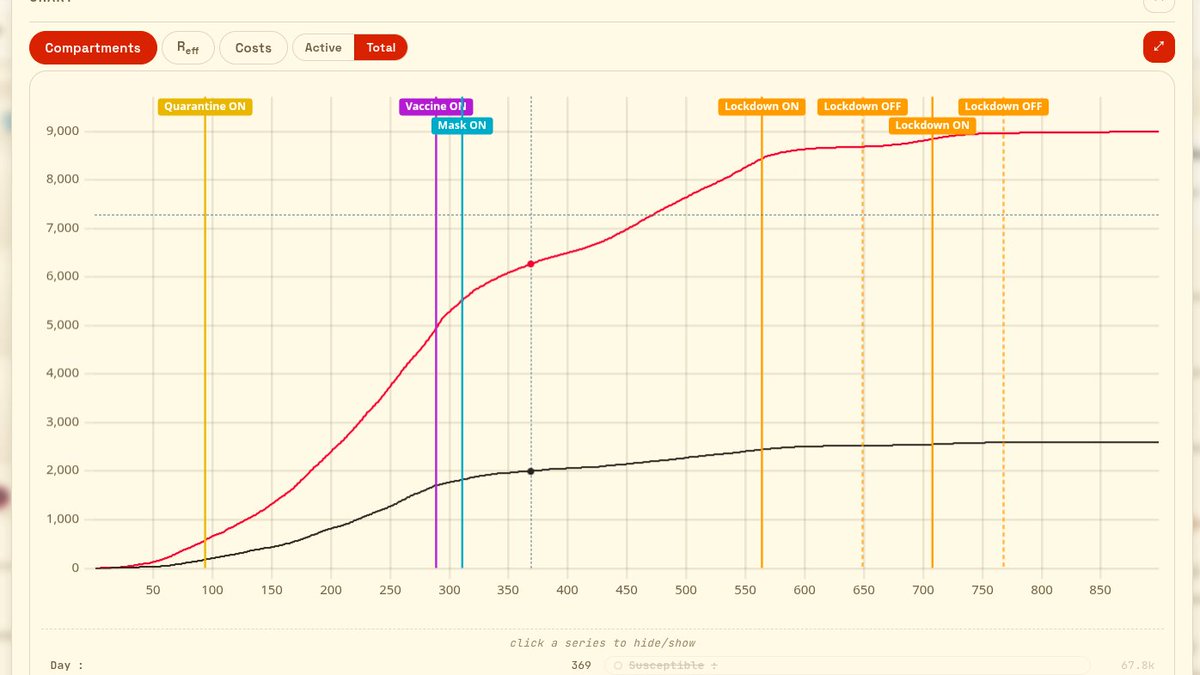

🆕🚨 A @CDCgov analysis of the #Bundibugyo #Ebola outbreak warns that, under a worst-case scenario with poor isolation measures and only 20% of cases isolated, the outbreak in DRC and Uganda could exceed 20,000 cases and 2,000 deaths.
But these projections are not destiny.
The same analysis shows that rapid case detection, isolation, contact tracing, IPC, and community engagement can dramatically change the trajectory of the outbreak.
The urgent priority is getting resources, personnel, and support to the epicenter of the outbreak. The fastest way to protect global health is to stop transmission at its source. #EbolaOutbreak
cdc.gov/mmwr/volumes/75/wr/m…
5
7
27
5,339
Jun 6
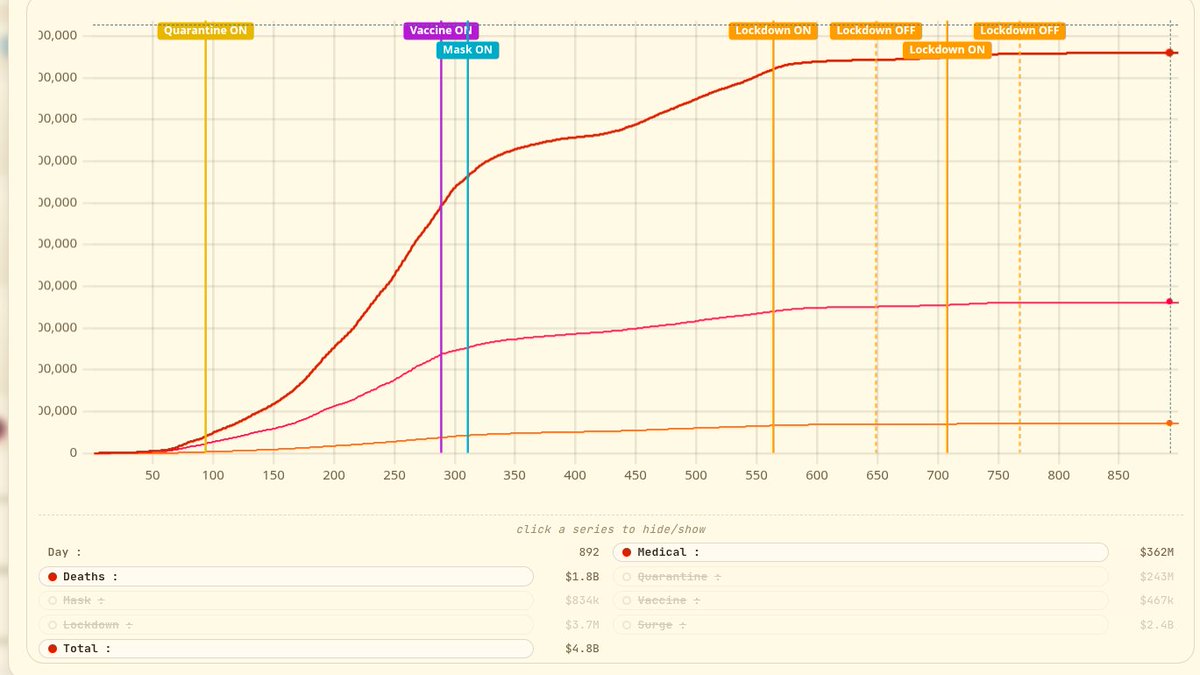
The Costs tab in MemeLab on the same 20% isolation run for this Bundibugyo Ebola outbreak.
By day 892 the sim shows $4.8 billion in total costs.
WHO just announced a $518 million plan to contain it.
That’s not even close.
My spatial cellular automaton shows what happens when weak isolation lets the outbreak burn: the economic hit compounds fast even as local clusters deplete.
$518M is the early-intervention hope, but under current 20% isolation realities on the ground, my projection says we’re still looking at billions.
These numbers aren’t destiny. Ramp up isolation, tracing, and community trust NOW.
x.com/Reuters/status/2062943…

WHO launches $518 million plan to curb Africa Ebola outbreak reut.rs/4o67scs reut.rs/4o67scs
3
1
3
479
Jun 3
Early headlines screamed “Ebola exploding” suspected cases nearing 1000
But now the WHO revised with the lab-confirmed numbers.
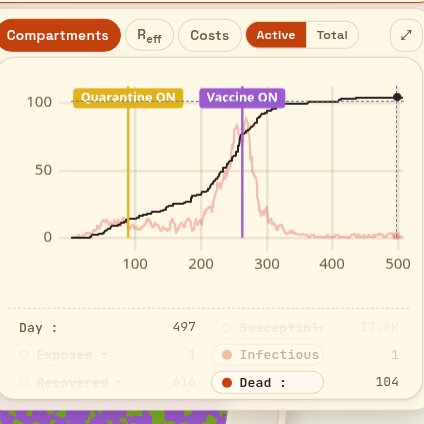
I threw only those revised figures, ignoring all previously reported counts, into MemeLab and let the model fit the data. I assume the outbreak started 90 days before it was first confirmed.
Result? R₀ = 3.1 in a spatial simulation.
With effective interventions, the epidemic peaks, then ends by day 508.
Final toll: 3.3% recovered, 0.6% dead.
The vast majority of the population never even gets exposed. This is why preliminary “suspected” numbers can distort risk perception and why anchoring models to verified data changes everything.
But can we trust this new data?
thememeticist.github.io/Meme…

Jun 3

If the new case counts are accurate, this is closer to a normal sized ebola outbreak.
6
9
46
4,243
May 31
I think I might apply to this to help development of Memelab.
Good program if you need API credits for epi-work.
openai.com/form/rosalind-bio…
1
1
8
332
May 31
According to GA, MemeLab is comfortably between the median and the 75th percentile, i.e. strong upper-half / approaching top-quartile performance for a Science site and still rising!
Thanks everyone!
May 31
We usually talk about R₀, the average number of people one sick person infects as if it belongs to the disease. Measles is "an R₀ of 15," COVID was "around 3," and so on.
But R₀ can't be a property of the pathogen alone. It's a property of the pathogen meeting a population. Change who's standing next to whom, and the same virus gets a different number.
Network epidemiology and spatial lattice models have been theoretically mature since the early 2000s.
Tools or custom agent-based models exist, but they are either
(a) expert-only
(b) mean-field approximations that hide the network, or (c) too computationally heavy for real-time play.
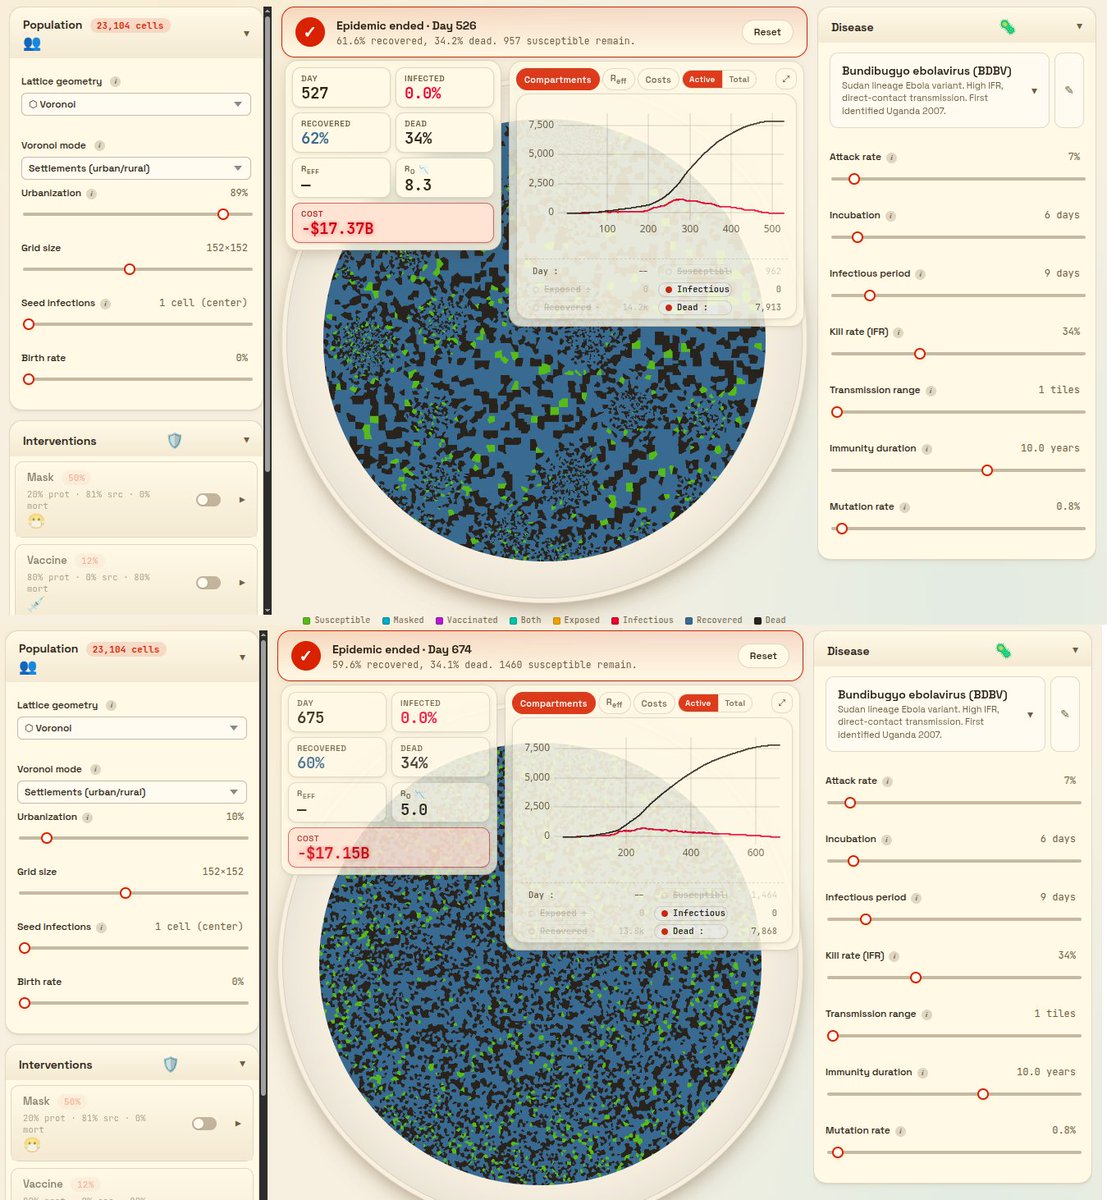
MemeLab runs a high-performance, deterministic cellular automata SEIRSD on a toroidal grid in the browser, crucially an analytical R₀ tied directly to the current topology.
Low to high urbanization produces an R₀ of 5-8.3, with an identical pathogen.
Switch to Voronoi → Settlements
slide Urbanization, and the model wires up realistic clustered cities on the fly.
The contact graph changes; R₀ updates instantly. No PhD, no supercomputer, no code. This is the first time the full power of contact networks has been made this accessible.
thememeticist.github.io/Meme…
1
7
443

May 31
We usually talk about R₀, the average number of people one sick person infects as if it belongs to the disease. Measles is "an R₀ of 15," COVID was "around 3," and so on.
But R₀ can't be a property of the pathogen alone. It's a property of the pathogen meeting a population. Change who's standing next to whom, and the same virus gets a different number.
Network epidemiology and spatial lattice models have been theoretically mature since the early 2000s.
Tools or custom agent-based models exist, but they are either
(a) expert-only
(b) mean-field approximations that hide the network, or (c) too computationally heavy for real-time play.
MemeLab runs a high-performance, deterministic cellular automata SEIRSD on a toroidal grid in the browser, crucially an analytical R₀ tied directly to the current topology.
Low to high urbanization produces an R₀ of 5-8.3, with an identical pathogen.
Switch to Voronoi → Settlements
slide Urbanization, and the model wires up realistic clustered cities on the fly.
The contact graph changes; R₀ updates instantly. No PhD, no supercomputer, no code. This is the first time the full power of contact networks has been made this accessible.
thememeticist.github.io/Meme…
3
9
47
2,108
May 31
MemeLab is now ridiculously contagious!
New Share button drops a popover with instant-copy link crisp QR code.
Demo: open on laptop, scan model settings straight to your phone in seconds → you’re in.
Permalinks shrunk from ~1000 to just ~34 chars. Viral sharing unlocked!
thememeticist.github.io/Meme…
1
5
24
1,753


May 30
$botcoin
$robotmoney
$memelab
$atbash
$jars
I like all these coins so much they are such good coins man.
Some would argue that they are great!
Uhhh memelab early
Botcoin is fucking going to 1B one day no doubt
Jars will go to Ms
Etc etc
Onchain is alive and always will be
2
124

May 30
Thinking about adding an R0 estimator to memelab.
Currently exploring different methods to calculate that. Would an in browser neural Network be overkill though?
2
1
10
746
May 29
Memelab update:
Chart glow-up: Active/Total count-mode toggle for compartments view!
Active = live occupancy, Total = cumulative arrivals (infections/recovered/deaths) via fresh monotonic engine counters (ecum/icum/rcum/dcum).
New Expand button pops the live uPlot chart into fullscreen modal.
Desktop polish: auto-height card so legend never clips, compact value formatters that show current numbers at rest, proper epidemic banner layout.
github.com/TheMemeticist/Mem…
2
3
635

May 29
If you support it (while working on your project), you'll get a lot of benefits. Attention and fees for your project's development. There are a lot of people on pump.fun. You can use this to develop Memelab. Just tweet the MLC CA and people will come quickly.
2
2
355