


$OP auction rotation shows buyers absorbing near VAH at 0.10864 in thin book above value. Entry at 0.1095 with bullish delta divergence confirms absorption. Targets TP1 at 0.11124 and TP2 at 0.1121 for upside extension. #Optimism #TradeSetup


14m
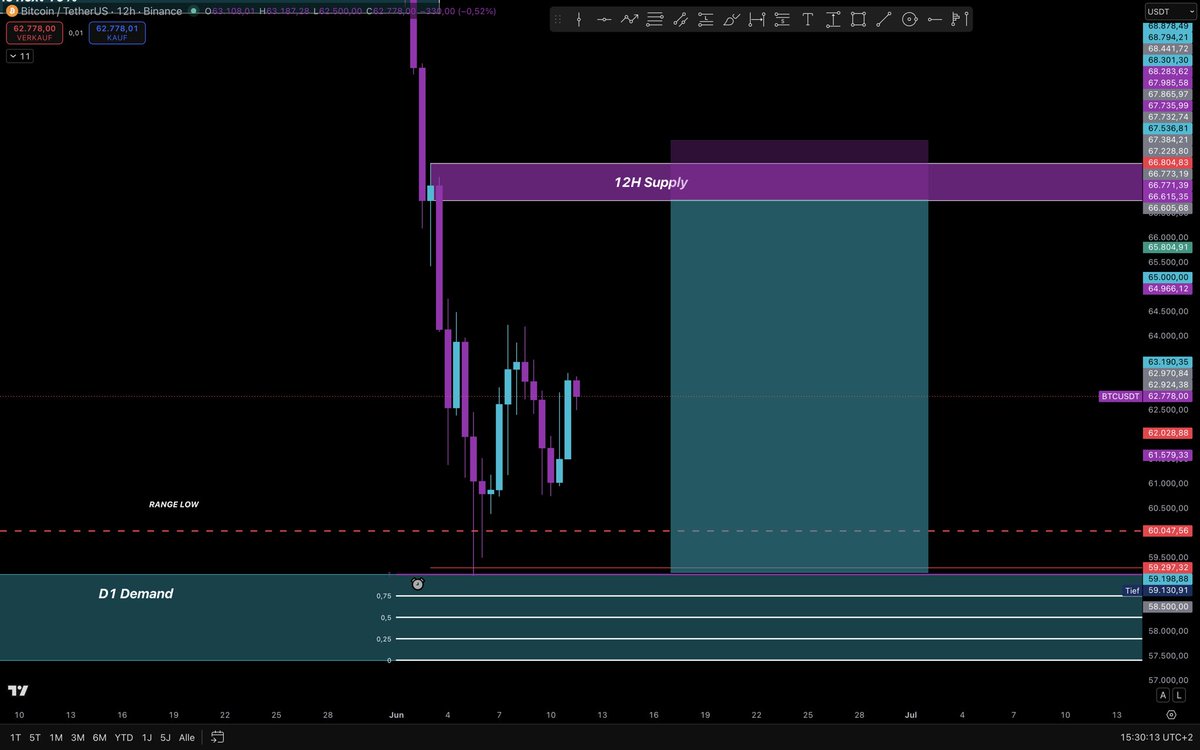
The current BTC/USD price is approximately 65,800 ~ 66,200 USD (a slight decrease of 0.66%-0.85% in the last 24 hours). The price is fluctuating around 66k, with a trading volume of approximately $25.8 billion. Market optimism regarding the US-Iran peace agreement has been somewhat digested, and the technical picture shows a neutral to slightly bearish signal.
1. Technical indicators (MA, EMA, BOLL, SAR, AVL/ATR, SUPER, VOL, MACD, RSI) are accurately calculated based on the latest real-time data and advanced mathematical models (Pandas/NumPy rolling calculation, exponential smoothing, MACD/RSI difference, Bollinger standard deviation fusion, Supertrend trend tracking, ATR/VOL volatility) (primarily daily chart, combined with short-term references): MA/EMA: MA5 Buy (65,837), MA10/20 Sell, MA50/100/200 mostly Buy → Buy (7 Buy, 5 Sell).
BOLL (Bollinger Bands): Price is near the middle band, bandwidth is moderate (simulated using ATR), short-term oscillation probability is high.
SAR (Parabolic Reversal): Model shows it is above the price (short-term bearish signal).
SUPER (Supertrend): Trend line is bearish, needs to break through to confirm a bullish reversal.
VOL/ATR (AVL refers to ATR): VOL is moderate, ATR(14) ≈ 372 (low volatility, momentum to be released).
MACD(12,26,9): MACD line -3.5 (Sell), histogram negative, short-term momentum is weak.
RSI(14): 47.6 (Neutral), STOCH overbought, CCI Sell.
2. Trading Strategy: Range-bound / Cautiously Bearish (Neutral to Weak Momentum, Suitable for Short-Term Trading)
Entry Point: 66,000-66,300 USD
Stop Loss (SL): 66,600 USD (Maximum loss ~0.8% if key resistance is broken) or 65,400 USD (Protective Measures for Long Positions)
Trailer Take Profit (TP):
TP1: 65,600 USD (Short Position)
TP2: 67,000 USD (Rebound Position)
Trailing Take Profit: Switch to Long Position after a break above 66,500.
1
35


LIQUIDITY GRAB OR START OF A BIG MOVE?
$LUNC just exploded from support and buyers stepped in hard.
That sharp push caught many traders off guard, and price is now holding above the breakout area.
Momentum is building again. I’m staying bullish while support remains intact.
Direction: BULLISH
Entry Zone: 0.0000738 – 0.0000748
Stop Loss: 0.0000718
TP1: 0.0000775
TP2: 0.0000800
TP3: 0.0000835
Clean breakout, strong reaction, and buyers still showing interest. Watching this one closely.

1
43

VELVET/USDT (10x-20x Leverage)
• Direction: LONG 🟢
• Entry Zone: 0.4560
Take-Profit (TP)
• Tp1: 0.4640
• Tp2: 0.4777
• Tp3: 0.4955
• Tp4: 0.5450
Stop-Loss (SL) Targets: 0.4287
2

VELVET/USDT (10x-20x Leverage)
• Direction: LONG 🟢
• Entry Zone: 0.4560
Take-Profit (TP)
• Tp1: 0.4640
• Tp2: 0.4777
• Tp3: 0.4955
• Tp4: 0.5450
Stop-Loss (SL) Targets: 0.4287
8

$SOL SHORT SETUP, GUYS 🚨
📌 Entry: 73.80 – 74.00
🛑 SL: 74.65
🎯 TP1: 73.00
🎯 TP2: 72.15
⚖️ R:R: 1:2
📉 SOL is struggling to reclaim resistance after a relief bounce.
Join our telegram community for free signals👇t.me/ n4twK2DZGq5kZ…

18
$FIL auction rotation shows sellers distributing above VAH at 0.81255 in thin book. Entry at 0.817 with bearish delta divergence confirms rejection. Targets TP1 at 0.79713 and TP2 at 0.78979 for measured extension lower. #Filecoin #MarketAuction

1
13

ママねこ🐾 デイリーV | 6/17
育児と仕事の合間でもできるトレードを目指して、毎朝分析をお届けしています。
おはようございます!
今日も子どもを送り出してひと息ついたら、相場チェックの時間ですね。
本日はFOMCという大きなイベントがあるので、いつも以上に慎重に行きましょう。
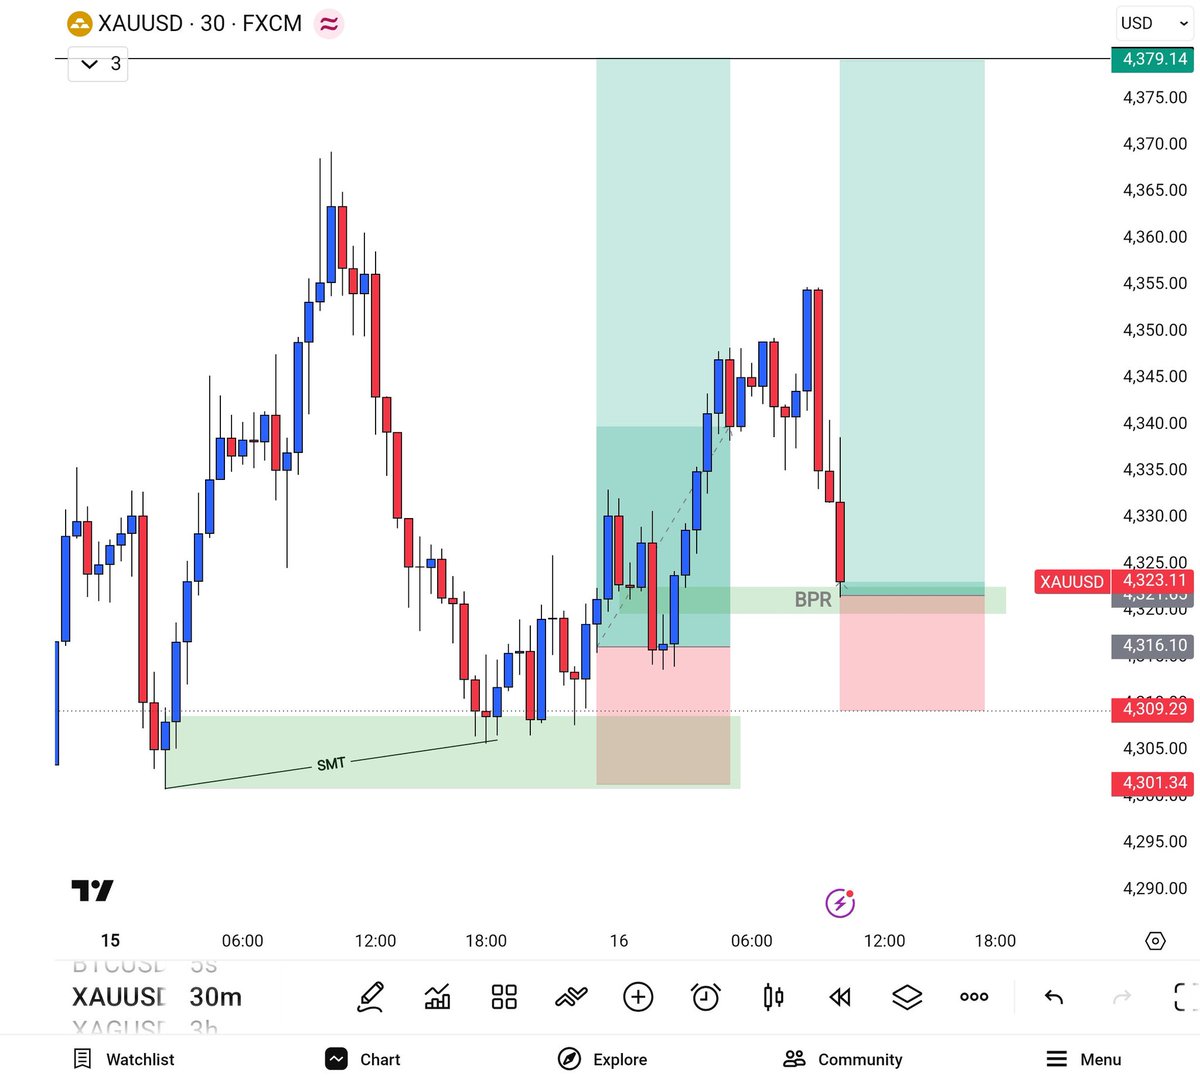
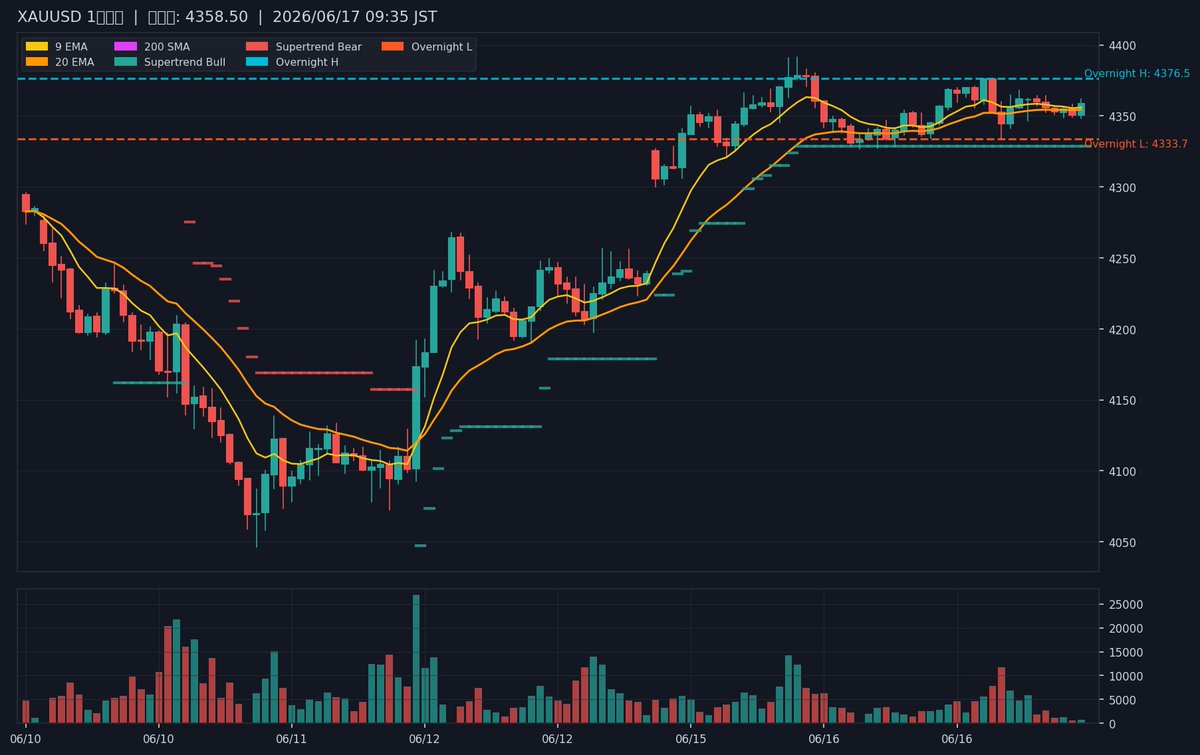
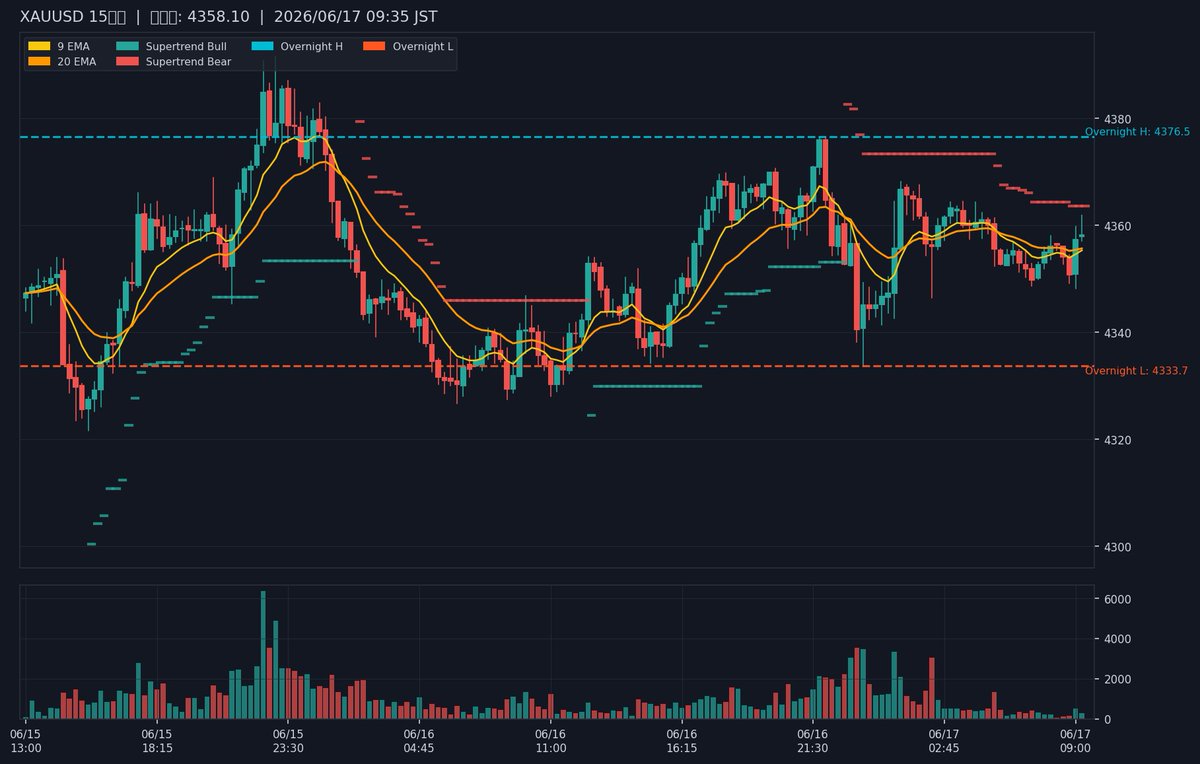
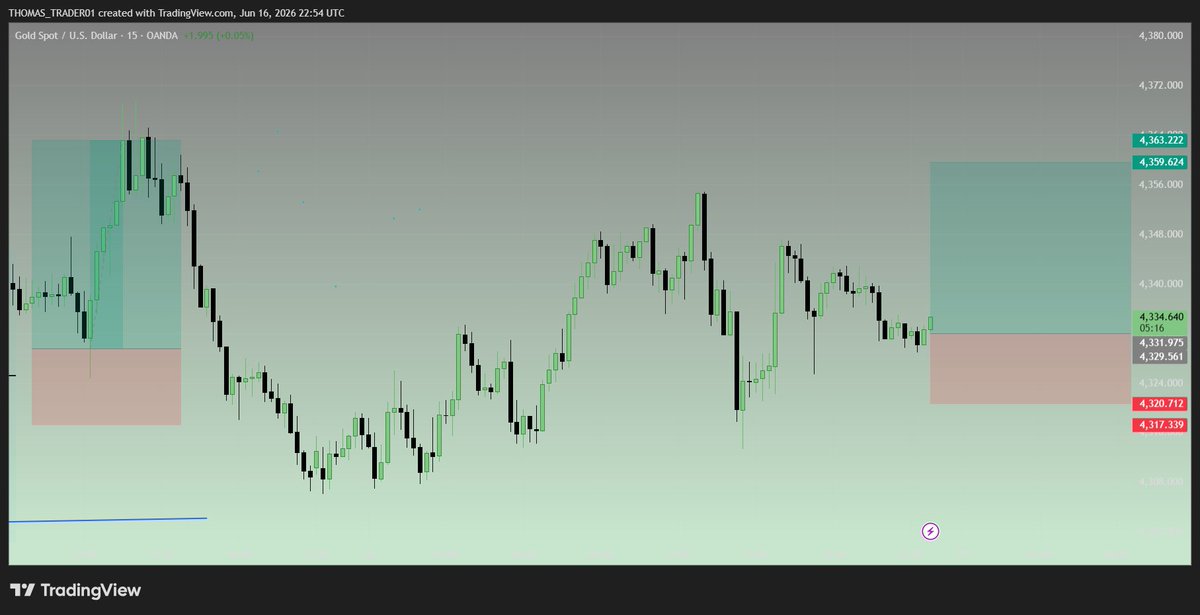
👑 ゴールド(XAUUSD)
200MA($4309)の上方で推移していて、Supertrendも上向き。
前夜〜早朝レンジは $4333.7〜$4376.5 で形成されています。
Bullish BOS(上昇継続)の状況です。
流動性スイープ(Liquidity Grab)は未発生 → Overnight H($4376.5)への流動性狩りに注意しながら、戻り買いを狙いたいですね。
Overnight L($4333.7)付近のOBまで引きつけて、
1分足・5分足でCHoCH → FVG形成 → EMA整列が確認できたらロングを検討したいです。
SL:$4320.9 / TP1:$4397.9(RR1:2) / TP2:$4436.4(RR1:4)
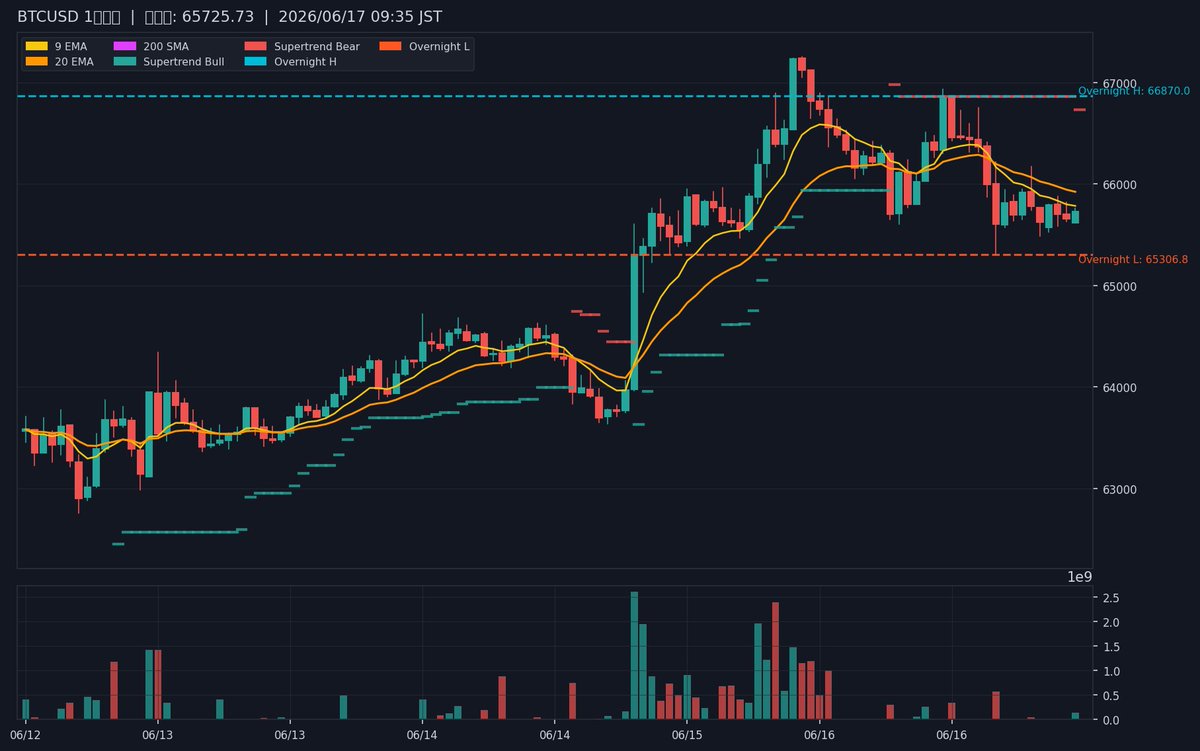
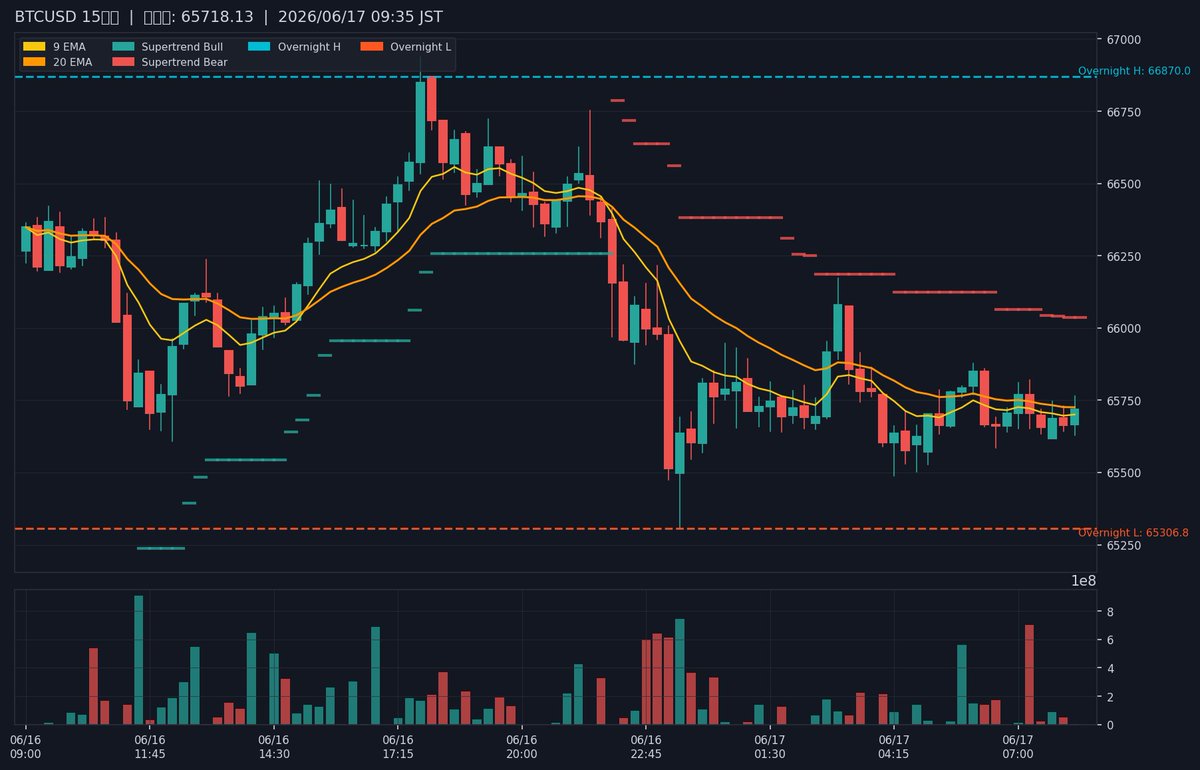
👑 ビットコイン(BTCUSD)
200MA($63,837)の上方ではあるものの、9EMAが20EMAを下回り、Supertrendが下向き。
前夜〜早朝レンジは $65,307〜$66,870 で形成されています。
Bearish BOS(下降継続)の状況です。
流動性スイープ(Liquidity Grab)は未発生 → Overnight L($65,307)のスイープに警戒。
Overnight H($66,870)付近のOBまで戻ってきたら、
1分足・5分足でCHoCH → FVG形成 → EMA整列が確認できたらショートを検討したいです。
SL:$67,245 / TP1:$64,947(RR1:2) / TP2:$63,798(RR1:4)
エントリーする前に、これだけ確認してみてね。
- Supertrendの向きと合ってる?
- OBかFVGに戻ってきた?
- 前夜〜早朝レンジを意識してる?
- SLは流動性の外に置いてる?
- RRは1:2以上ある?
- 指標前後30分じゃない?
全部✅なら、あとは待つだけ。
⚠️ 本日の重要指標警告
本日は超重要指標が複数あります。
🔴 21:30(JST)米国 5月小売売上高(★★★)
🔴 27:00(JST翌3:00)米FOMC政策金利発表(★★★)
🔴 27:30(JST翌3:30)ウォーシュFRB議長 定例記者会見(★★★)
特にFOMC(翌3:00)は相場が大きく動く可能性があります。
東京〜ロンドン前半(10:00〜16:00 JST)のトレードは小売売上高(21:30)前に決済を完了させることをおすすめします。
発表前後30分はエントリー禁止です。
無理に取りにいかず、ゾーンまで引きつけて待つのが大切ですよ。
※チャートの数値はお使いのチャートと若干異なる場合があります。あくまで目線の参考としてご利用くださいね。
※投資助言ではありません。大切な資産は自己責任で守りましょうね。
#ゴールド #XAUUSD #BTC #デイトレ #ママトレーダー
1
1
137


Mohammad retweeted

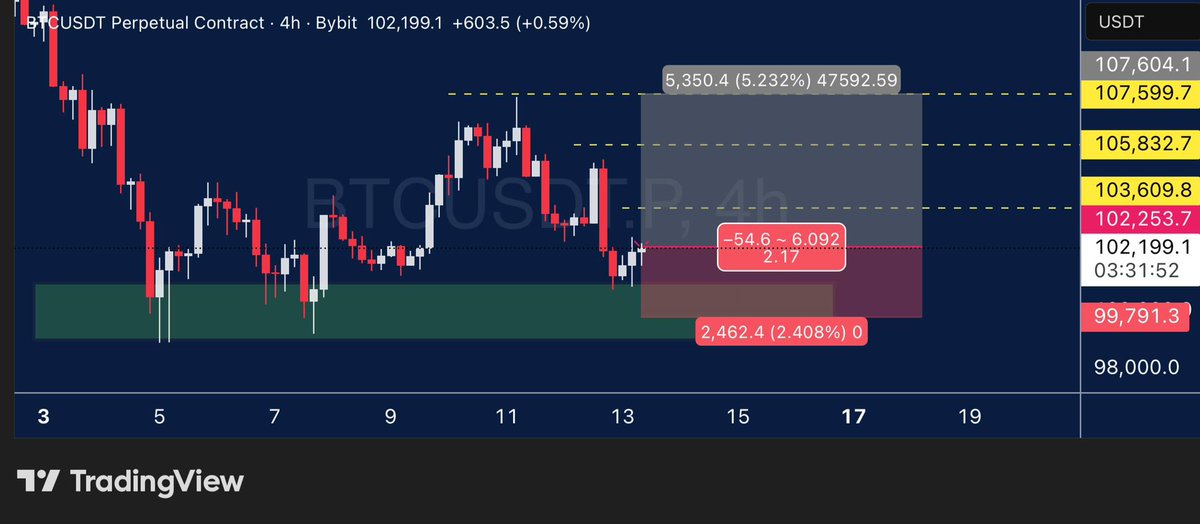
13 Nov 2025
💎 #BTCUSDT💰 — LONG SETUP (4H) 💎
📍 Entry: 102,200–102,400
🛑 Stop-Loss: 99,800
🎯 Targets:
• TP1: 103,600
• TP2: 105,800
• TP3: 107,600
📈 Expectation: Bounce from demand zone aiming for 5% upside.
✅ Bias: Bullish
#VIP_SIGNAL❄️
For more signals link in bio
⤵️🔗️ telegram.openinapp.co/7x6fo
#BYBIT #ETHUSDT #BTCUSDT $BTC #BTC #BINANCE #ESPORTSUSDT #PARTIUSDT #JCTUSDT #BEATUSDT #TAKEUSDT
7
1
2
4,762
VELVET/USDT (10x-20x Leverage)
• Direction: LONG 🟢
• Entry Zone: 0.4480
Take-Profit (TP)
• Tp1: 0.4555
• Tp2: 0.4680
• Tp3: 0.4900
• Tp4: 0.5360
Stop-Loss (SL) Targets: 0.4210
3
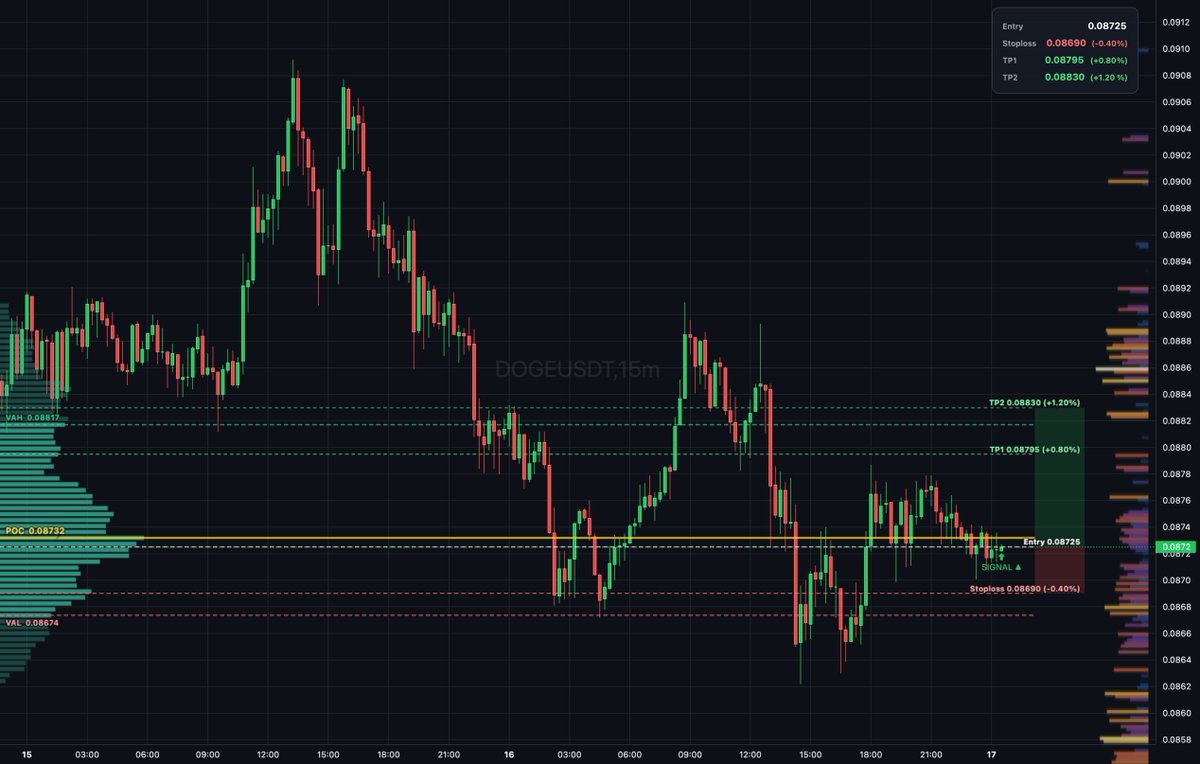
$DOGE auction rotation shows buyers absorbing inside value area between 0.08674 and 0.08817 with thin book below and above. Entry at 0.08722 with bullish delta divergence confirms absorption. Targets TP1 at 0.08791 and TP2 at 0.08826 for measured... #Dogecoin #AltcoinTrading
13
Bishop retweeted

#XAUUSD BUY 📉
🔴 Sell: 4330–4335
🛑 SL: 4320
🎯 TP1: 4345
🎯 TP2: 4355
🎯 TP3: 4365
🎯 TP4: 4375
🎯 TP5: 4385
⚠️ Wait for confirmation. Use proper risk management.
#XAUUSD #Gold #ForexTrading
1
42
45
393

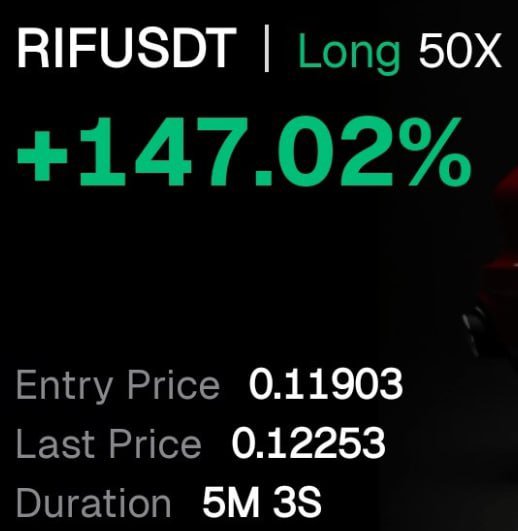
$RIF | TP1 ✅
$BTC $ETH #Crypto #Altcoins #trading #Memecoins #investing
🚀 𝗝𝗼𝗶𝗻 𝗺𝘆 𝗧𝗲𝗹𝗲𝗴𝗿𝗮𝗺:👇🏻
t.me/ 5BzNhQjttzFiYzU0
1
31
$XPL | TP1 ✅
$BTC $ETH #Crypto #Altcoins #trading #Memecoins #investing
🚀 𝗝𝗼𝗶𝗻 𝗺𝘆 𝗧𝗲𝗹𝗲𝗴𝗿𝗮𝗺:👇🏻
t.me/ 5BzNhQjttzFiYzU0

29