melisu♡ retweeted

Pappu exposed himself again at the INDIA bloc meeting. He accused CPI(M) of being compromised because Vizhinjam port contract went to Adani.
John Brittas shut him down with facts - the project started under Congress CM Oommen Chandy in 2015. Foundation stone was laid long before LDF came to power.
Even Shashi Tharoor from his own party has praised the same port for development and jobs created.
This is what happens when you see yellow in everything, attack your own allies, and speak without knowing basic facts. Pure stupidity that damages the bloc from inside.

10
82
362
67,857
Ruthαnαsıα #Palestine #BDS #UniteAgainstZionism ✊✌ retweeted

Do fk off lad.
A. You've not been charged.
B. Musk pays your costs.
C. You begged before for legal fees. Then pleaded guilty.
D. You begged for money in February to sue Farage. You ... didn't sue Farage.
E. Feel free to add to list folks.
People have awoken to your shit, son.
1
1
25
483
Sarah A 🚜 retweeted

A very small number of people were able to rule a sub-continent. When we set our minds to it we can be very efficient.
We can and will take back our own homeland.
I'm sorry that you'll have to go and live amongst your own people and your own mess, it can't be pleasant I know.

You can’t take back your ‘homeland’. You can’t stop the browning of the West
14
80
945
7,894

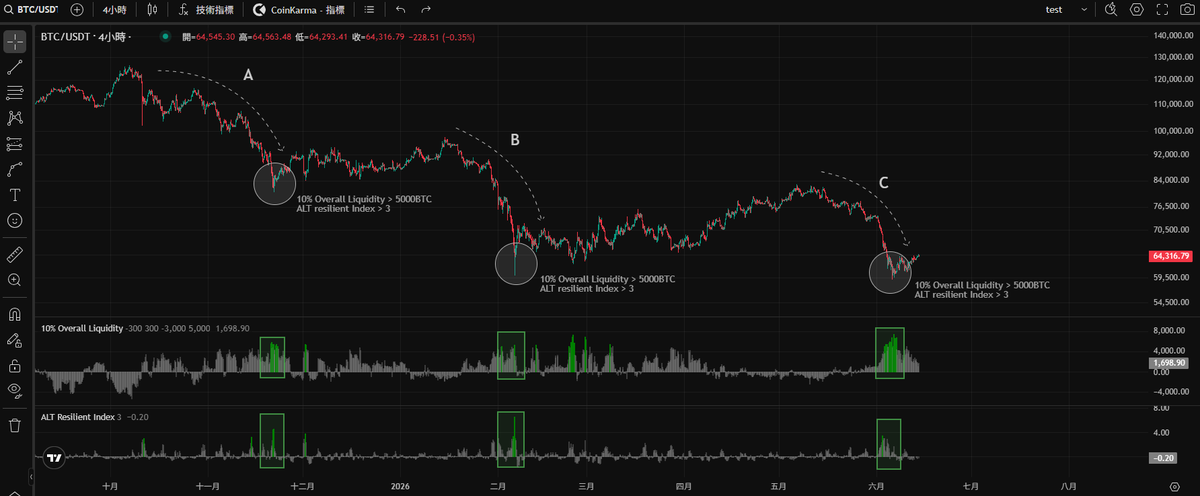
Looking back at the stabilization zones following sharp selloffs during the current bear market, a recurring pattern emerges, these bottoming areas tend to be accompanied by distinct data signatures.
Historically, when overall market buy-side liquidity significantly outweighs sell-side liquidity, it has often coincided with the formation of a local bottom. When this further resonates with altcoin resilience indicators, it constitutes an extreme on-chain bottoming signal.
From an overall market liquidity perspective, 10% Overall Liquidity (BTC) measures the degree of imbalance between buy-side and sell-side liquidity. When this reading exceeds 5,000 BTC, it enters historically extreme territory. Meanwhile, the ALT Resilient Index quantifies the relative strength of altcoins during broad market declines, reflecting the willingness of major altcoin players to defend price levels. A reading above 3 is likewise considered an extreme signal.
As illustrated in the chart, points A, B, and C each represent sharp selloff phases within this bear market cycle. In the subsequent stabilization zones, both the liquidity and altcoin resilience indicators consistently reached extreme values in tandem. Based on current data, the market is once again exhibiting similar bottoming characteristics, suggesting that the most likely path forward is a period of consolidation and recovery.
1

🚨 Quick Crypto Poll – Be Honest 🔥
You just got $2,000 dropped in your wallet RIGHT NOW.
What are you aping into?
A) Bitcoin – the safe king 👑
B) Ethereum – smart contracts king
C) Solana – speed & memes
D) Memecoin degen gamble (100x vibes) 🐸
Vote reply WHY below 👇
I’m reading every single comment 😤


RT @mostlychansoo: Who’s gonna tell 2016 Chanyeol that in ten years he’d still be touring with his most favorite person ever t.co/C…
150

Me Omar YAHIA 🇫🇷🇪🇺 retweeted

L'ex-patronne de RT France, Xenia Fedorova, soupçonnée d'être une agente d'influence de Poutine, est omniprésente sur CNews et dans la Bollosphère. La promotion de cette "journaliste" sans carte de presse est suivi de près par Vincent Bolloré en personne.
f.mtr.cool/nmpnyfiwoh
9
22
45
2,722
Bri Bert 🇫🇷 extrêmeFrance 🇫🇷 retweeted

17h
L'ennemi est à l'intérieur mais Macron en invente un à l'extérieur pour faire semblant d'exister et nous entrainer dans sa chute, car l'ennemi est aussi à l'Elysée.
Macron va organiser le 14 Juillet un défilé en l'honneur de Zelenski, un mafieux qui rend hommage à des nazis, avec 10000 soldats étrangers de la coalition des volontaires et chefs d'Etat de l'OTAN, bref quasiment une déclaration de guerre contre la Russie.
Qu'il soit balayé de l'Histoire le plus vite possible sans espoir de retour est une priorité vitale.
15
145
291
3,402
Pretty kitty kate💗 retweeted

初めまして、こんにちは。検索よりお声掛け失礼致します。
当方、C神楽ちゃん所持しております。S神威くんとの交換は可能でしょうか?1点のみで難しいかとは思いますが、ご検討の程宜しくお願い致します。

1
1
3

青蛙 retweeted

ダノンデサイル
直近成績は
ジャパンC 3着🥉
↓
有馬記念 3着🥉
↓
大阪杯 3着🥉
↓
宝塚記念 3着🥉
これでGIレース4戦連続3着となりました。
本当に堅実な馬です。
8
33
186
14,787


RT @realMaalouf: This is how Muslims treat and humiliate Christians in Syria and other Islamic countries.
Then they move to the West and c…
1,458

RT @Angelmiu1_: 美羽日記記念日& ヒロ日記記念日&レオン日記記念日Ange1⚠️顔無断使用100万ⓒ⚠️顔無断転載禁止⚠️約束してない人家に来るの禁止⚠️🧟️💔みう達はこれがお仕事だからꧦ𛰙᭜𖫴𖫰𖫱𖫳𖫲𖫲𖫳𖫴𖫰𖫱꛰ﯩᩝ︪᭜𖫴𖫰𖫱𖫳𖫲𖫲𖫳𖫴𖫰𖫱꛰ީᩝ𛰚ഒ·⸌̟͂̋…
1


감자튀김을 40년간 먹여봤더니...
1. 감자는 식이섬유와 비타민 C, 마그네슘 등이 풍부한 식품이지만 전분 함량이 높고 혈당지수(GI)가 높은 편이어서 그동안 당뇨병 위험과 관련된 연구가 이어져 왔다.
2. 연구진은 감자를 먹지 않는 것보다 감자 대신 어떤 식품을 선택하느냐도 중요하다고 분석했다.
3. 연구진은 감자를 먹지 않는 것보다 감자 대신 어떤 식품을 선택하느냐도 중요하다고 분석했다.
4. 생활습관과 식습관 등 다양한 변수를 보정한 뒤 분석한 결과, 감자를 전체적으로 주 3회 더 섭취할 때 제2형 당뇨병 발생률은 5% 높아졌다. 감자튀김만 따로 보면 같은 섭취량에서 위험 증가 폭이 20%로 훨씬 컸다.
반면 다른 조리 방식의 감자에서는 통계적으로 유의한 연관성이 확인되지 않았다.

6
3
18
1,092
Elon Musk retweeted

Jun 3
WHERE'S THE RNC 🚨 there's a crime going on in (CA)
With (50%) of the vote not counted, they're gonna count until Steyer comes in (2nd) edging out Hilton and Raman edges out Pratt
Raise your hand ✋️if you wanna know how many lawyers does @ChairmanGruters have on the ground


680
5,736
11,240
117,900
isaiah retweeted

🚨 LE CLASSEMENT DU GROUPE C À L'ISSUE DE LA PREMIÈRE JOURNÉE. 📊

42
76
1,253
74,352
