
Jun 11
2
96

Prince William County: Are schools seeing progress? Check out this breakdown of student enrollment trends, attendance improvements, and academic growth data for the current semester. #EducationUpdates #SchoolEnrollment #EdData
6
80
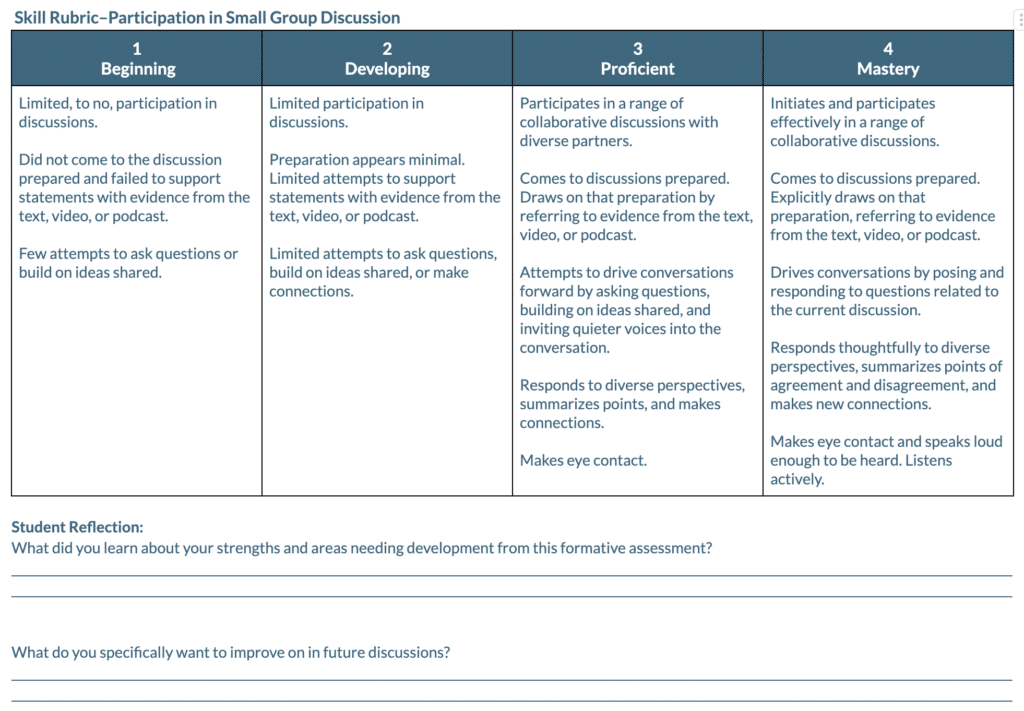
🤓 Do you make a habit of gathering pre-assessment data before crafting your lesson plan?
If your answer is “no,” you might want to reconsider.
Watch for strategies & tap for more: bit.ly/4cewzU8
#eddata #k12
1
6
21
1,662

Jan 26
You know what you want your students to learn, but what do YOU want to learn about your students?
🔎 More: bit.ly/3UqmTxV
#eddata #k12
1
14
34
3,308

24 Nov 2025
#WWIII: US think tank #EdData reports China has lent over $2T to 200 countries from 2000–24. Over $500B went to #WesternNations, including $202B to the US alone. While Africa-Asia were tagged as being in a #ChineseDebtTrap, China was quietly expanding its influence in the West.

8
21
244

23 Oct 2025
Powerful words from @RebeccaSibilia and @eduKATEmatters on why the fight for #IES and reliable #eddata is about whether the US is "willing to make decisions based on facts rather than hunches" @The74 @EdFundNews the74million.org/article/fed…
5
629

8 Oct 2025
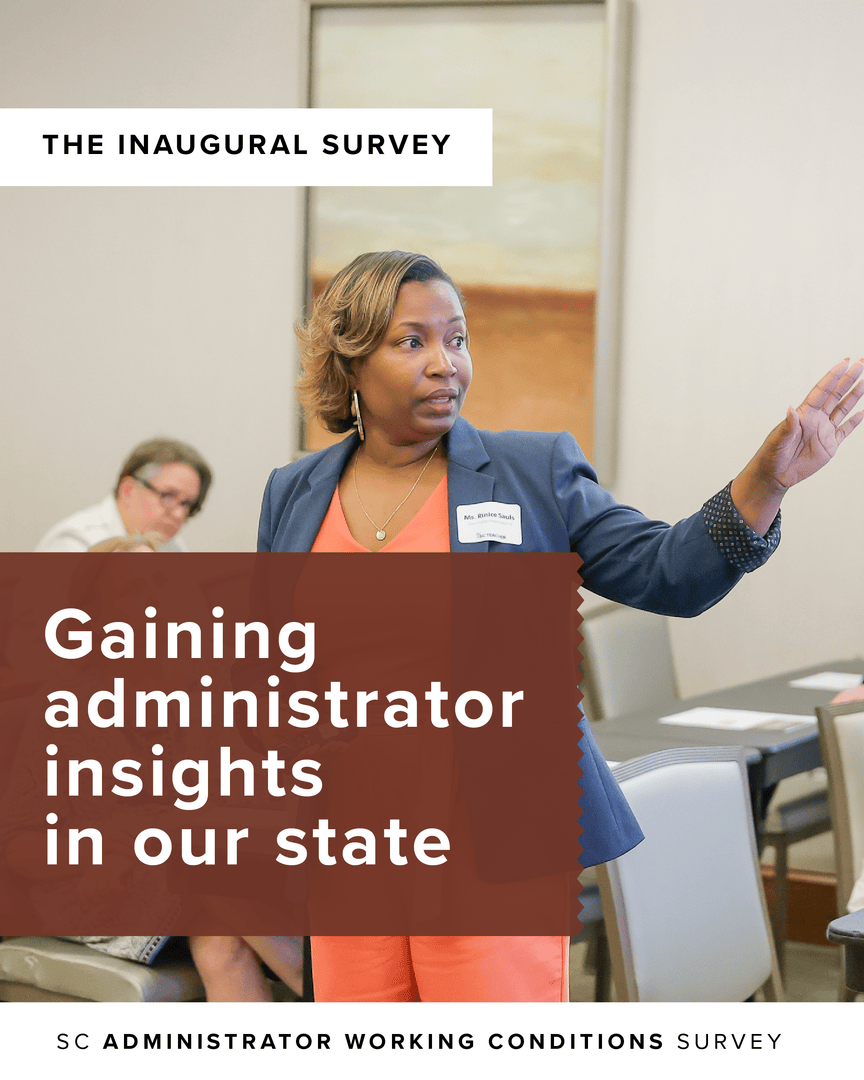
This January, #SCTEACHER will launch the SC Administrator Working Conditions Survey—a new survey designed to measure the experiences of PK–12 school administrators.
Explore more about the survey: heyor.ca/qmO1FV
#k12 #sceducation #eddata #scschools
4
114

8 Oct 2025
日本教育工学会のショートレターに投稿していた「教育におけるデータ利活用に伴うELSIを学ぶためのゲーム教材 “nocobon EdData版” の開発」が無事に採録されました。既に改良版の作成とデータ取得も済んでいるので、こちらも年度内にどこかに投稿したいと思います。
2
468
2 Oct 2025
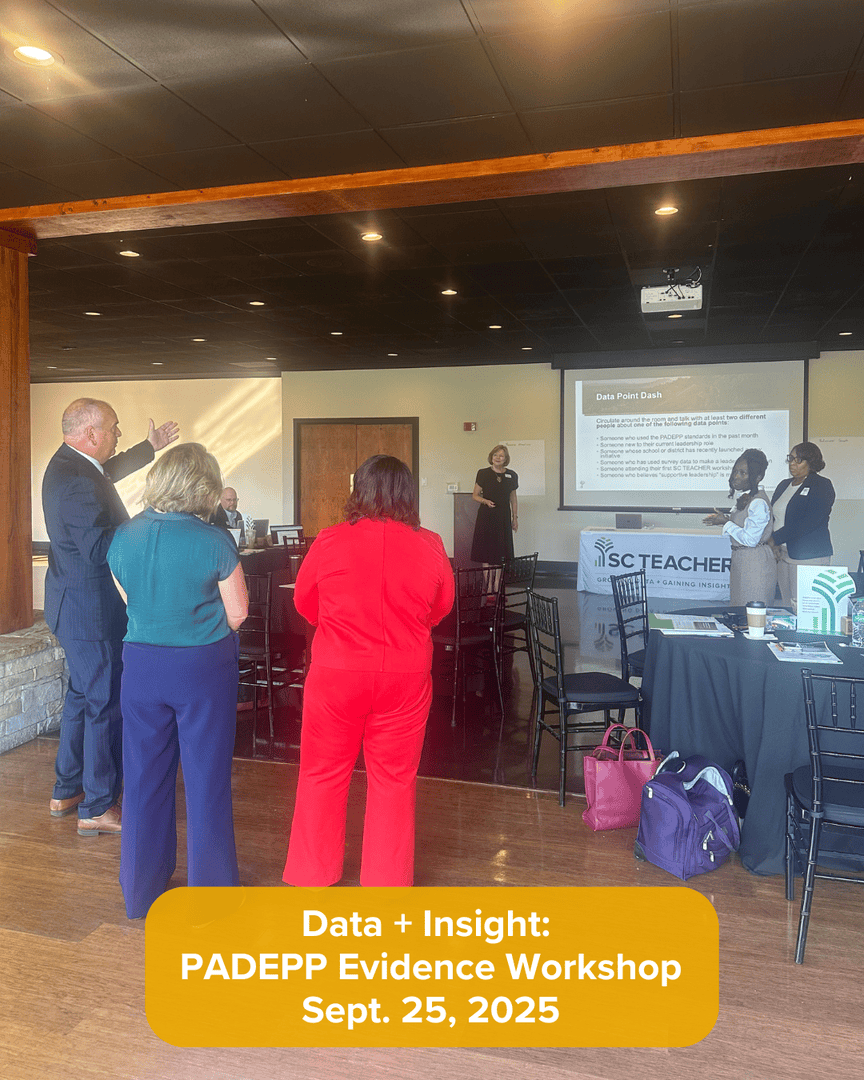
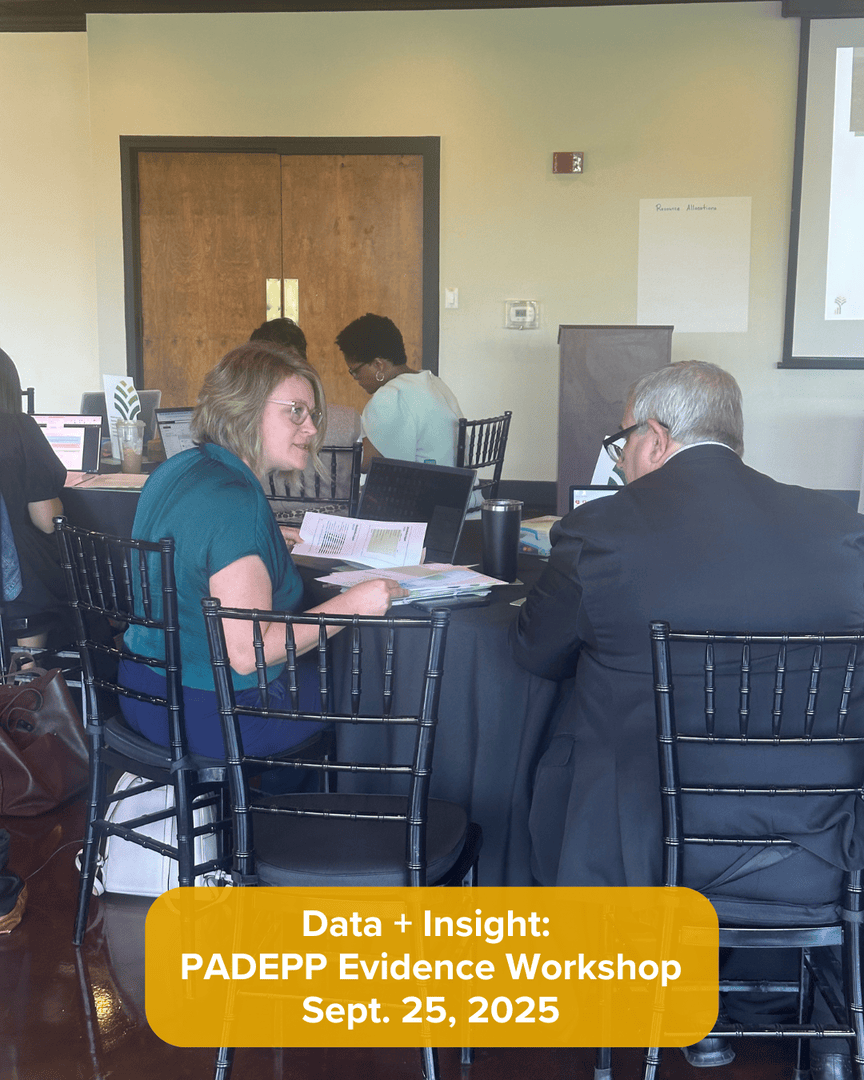
12 districts attended our Sept. 25 workshop exploring how to utilize district-level #SCTeacherWorkingConditionsSurvey data as evidence to support PADEPP evaluations.
Access the guide on aligning SCTWCS constructs & PADEPP standards: heyor.ca/QNaEyC
#SC #k12 #eddata

1
3
126

29 Sep 2025
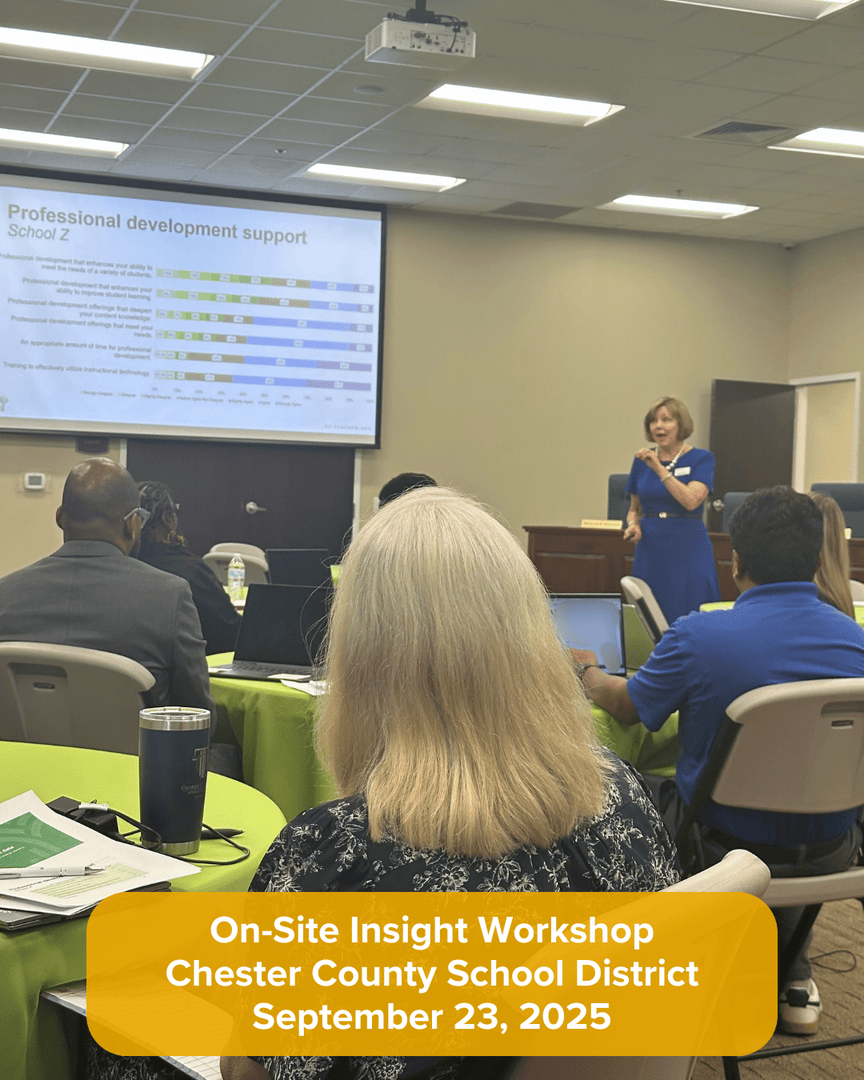
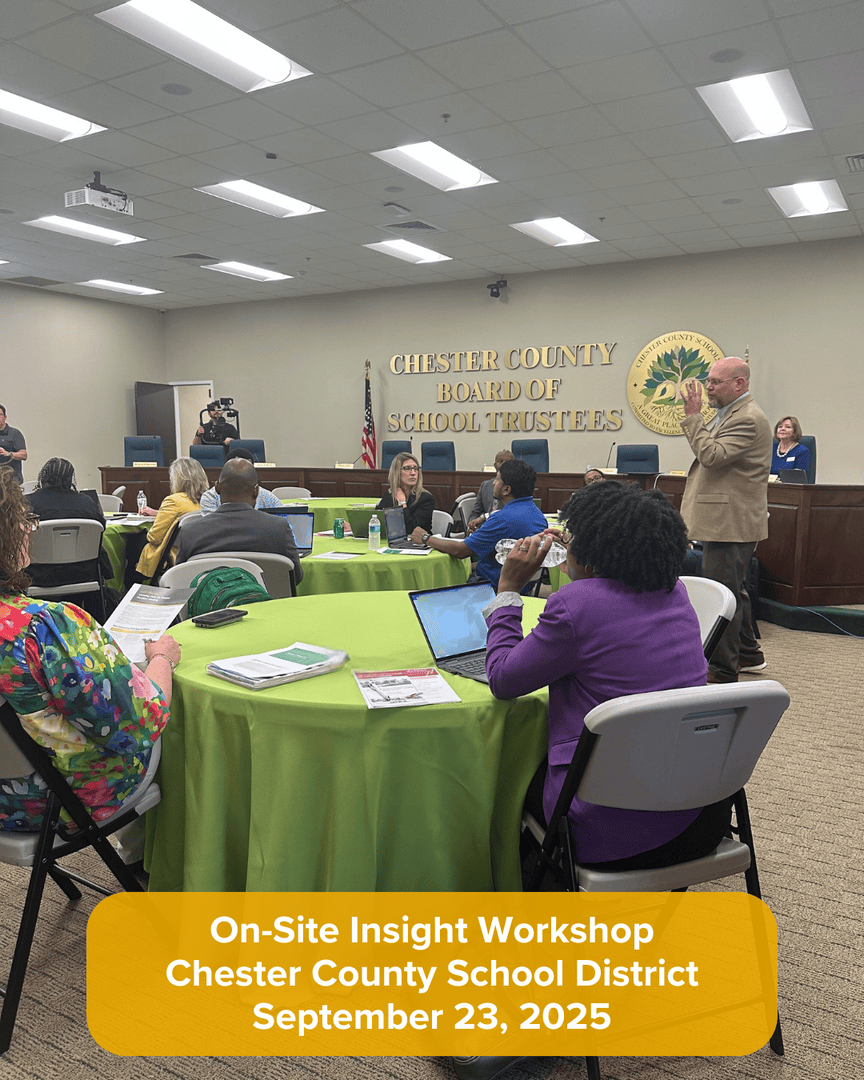
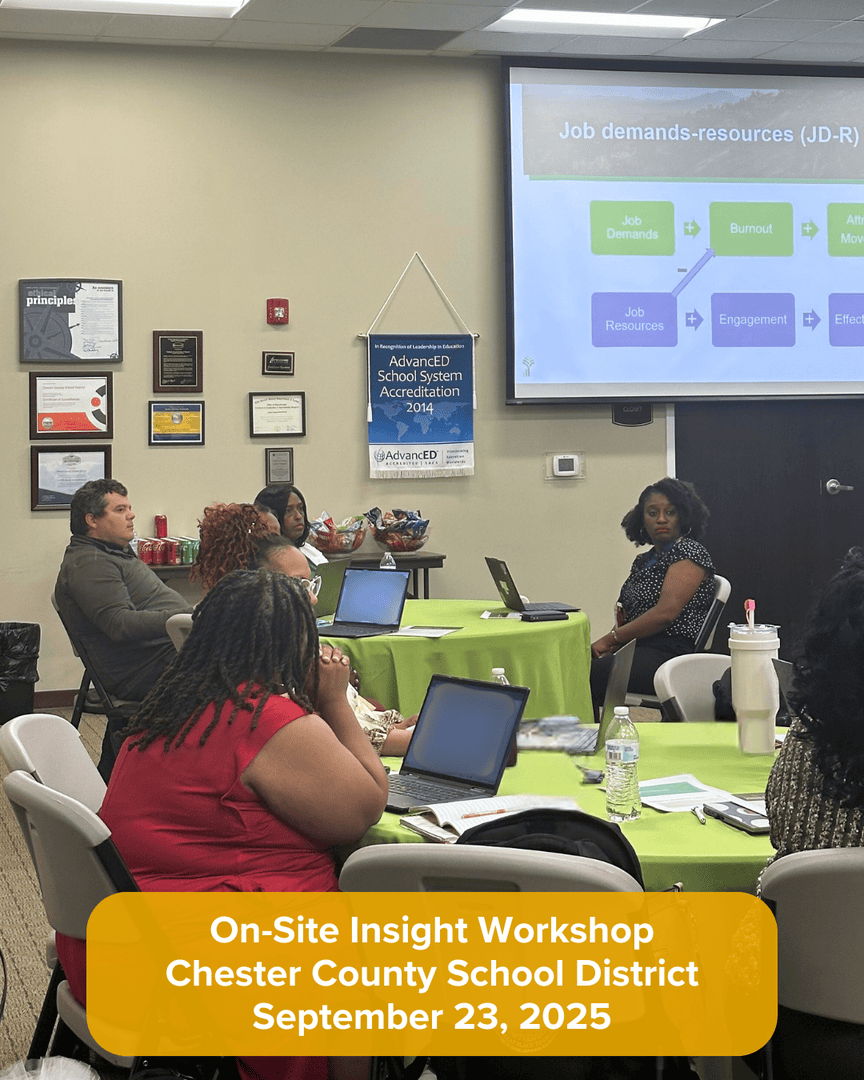
Compelling takeaways @DistrictChester for an On-Site Insight Workshop—digging into their #SCTeacherWorkingConditionsSurvey results and how they're guiding planning.
We're working alongside districts in turning data into strategy.
#scteacher #educatorworkingconditions #eddata
25 Sep 2025

This week, #SCTEACHER joined @DistrictChester for an On-Site Insight Workshop, unpacking how district leaders can explore their district-specific insights from the #SCTeacherWorkingConditionsSurvey to inform ongoing strategic planning.
#scschools #sceducation #sc
2
27
22 Sep 2025
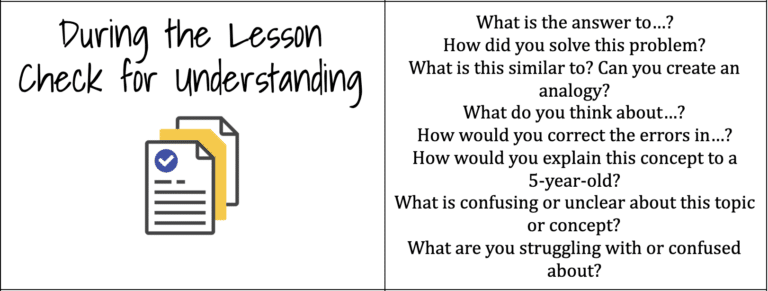
Check for Understanding: What Are You Learning About Your Students During the Lesson?
👉🏻 bit.ly/48NM1Wd
#eddata #educhat #k12
4
12
1,768

12 Sep 2025
Here's the data:
w.
===
Here’s a fact-checked breakdown of the claims from the image regarding California, based on the latest available sources (2024–2025):
1. 1 in Homelessness
• Accurate. California has the largest homeless population in the nation (187,000 people) and the highest share of unsheltered homeless. [1] [2] [3] [4] [5] [6]
2. 1 in Poverty
• Accurate by Supplemental Poverty Measure (SPM). California consistently ranks highest in poverty rate by the SPM, at 18.9% in 2023, the highest among all states. [7] [8]
3. 1 in Addiction
• Misleading. California has the largest absolute number of overdoses due to its population, but not the highest per capita rate. States like West Virginia, Kentucky, and Ohio top for highest per capita opioid addiction and overdose. [9]
4. 1 in Gas Prices
• True. California has the highest average gas prices in the nation, consistently $1–$1.50 above the U.S. average. [10] [11]
5. 1 in Income Tax
• True. California has the highest state top income tax rate at 13.3% (12.3% plus a 1% surcharge for very high incomes). [12] [13]
6. 1 in Gas Tax
• True. California’s gas tax is the highest in the U.S. at 61.2 cents/gallon as of July 2025. [14]
7. 1 in Budget Deficit
• True for total dollar amount (not per capita). California’s budget deficit is the largest of any state, estimated at $38–$73 billion for 2025. [15] [16]
8. 1 in Retail Theft
• Mixed. California has high-profile retail theft cases and more reported large-value thefts than most states, but direct national rankings are hard to confirm. It is widely considered a hot spot. [17]
9. 1 in Citizen Exodus
• Partially true. California has had the nation’s largest numeric population loss in recent years, though not the highest rate per capita. Net domestic out-migration is high compared to other states.
10. 1 in COVID Mandates
11. 1 in COVID School Closures
12. 1 in COVID Business Closures
• Subjective. California had some of the strictest and longest-lasting mandates and closures, but so did New York and a few others. “1” depends on the ranking metric. California was among the most stringent. [16]
13. 1 in Illegal Immigration
• California has the largest undocumented immigrant population by absolute number, but Texas and Florida have high numbers as well. Not necessarily 1 per capita.
14. 1 in Funding Illegal Migration
• Unclear. California provides more state benefits to undocumented immigrants than most states, but “1” isn’t always quantifiable.
15. 1 in Illiteracy
• Not confirmed. California has a higher-than-average adult illiteracy rate, but not the highest (ranks around 9–10) [U.S. census & EdData].
16. 1 in Wage Stagnation
• Not confirmed. Wage growth and stagnation vary across states and sectors. California’s wage growth lags in some sectors but accelerates in others.
17. 1 in Frivolous Lawsuits
• Broad claim, often cited by legal-reform lobbies. California has many lawsuits and strict liability laws, but “1” is debatable.
18. 1 in Worker Restrictions
• California has among the strictest labor and employment regulations in the U.S., but whether it’s “1” depends on interpretation [various sources].
19. 1 in Anti-Business Regulations
• California regularly ranks near the bottom in business-friendly rankings (e.g., Forbes, Chief Executive) due to extensive regulation. Often cited as “least business-friendly,” but “1” is subjective.
Summary:
Many of these claims reflect real issues—especially homelessness, poverty (under the SPM), tax rates, gas prices, gas taxes, and budget deficit, where California is either the nation’s leader or among the top states. Other claims are broader or more subjective, sometimes lacking precise national ranking data.
If you want a breakdown or citations for additional specific claims, let me know!
[1](ppic.org/blog/homelessness-h…)
[2](shou.senate.ca.gov/sites/sho…)
[3](calmatters.org/housing/homel…)
[4](shou.senate.ca.gov/sites/sho…)
[5](en.wikipedia.org/wiki/Homele…)
[6](usafacts.org/articles/which-…)
[7](calbudgetcenter.org/news/new…)
[8](calbudgetcenter.org/resource…)
[9](cdph.ca.gov/Programs/CCDPHP/…)
[10](centerforjobs.org/ca/special…)
[11](gasprices.aaa.com/?state=CA)
[12](states.aarp.org/california/s…)
[13](efile.com/california-tax-for…)
[14](caltax.org/2025/06/06/cdtfa-…)
[15](arnoldporter.com/en/perspect…)
[16](hoover.org/research/after-10…)
[17](cbsnews.com/sanfrancisco/new…)
4
281
10 Sep 2025
#SCTEACHER is looking for a Research Associate to join our team!
This position will support SC TEACHER in executing survey administration, district engagement & research operations.
Learn more about the position and apply online: heyor.ca/wL7rS9
#k12 #eddata #sc

1
4
6
394


4 Sep 2025
So, there’s a new Executive Order in town. This time it’s about #HigherEd #Admissions #Data. What’s next?
These two guides can help clarify both the context and the data details:
Part 1: buff.ly/nkEG2aG
Part 2: buff.ly/HM5bFFw
#EDData #CollegeAdmissions
1
2
128

26 Aug 2025
🎙️ We’re back for Season 6!
After 5 seasons of diving into assessment & data literacy, we’re reflecting on the biggest lessons learned—from expert voices to student insights.
This isn’t just a look back—it’s a launchpad for what’s next. 🚀 @WCPSSTeam
#Education #EdData #Podcast
1
2
5
80
27 Jul 2025

1
13
39
3,615
15 Jul 2025
Compared to retiring teachers, 64% of non-retirees leaving public education in 2024 said they would consider teaching again.
Discover more top findings from 2024–25 in the new data viz from #SCTEACHER: heyor.ca/Ad8aON
#sc #scschools #eddata #lovescschools

2
3
154

Ho fatto anche io la eddata...


3
1
16
810
8 Jul 2025
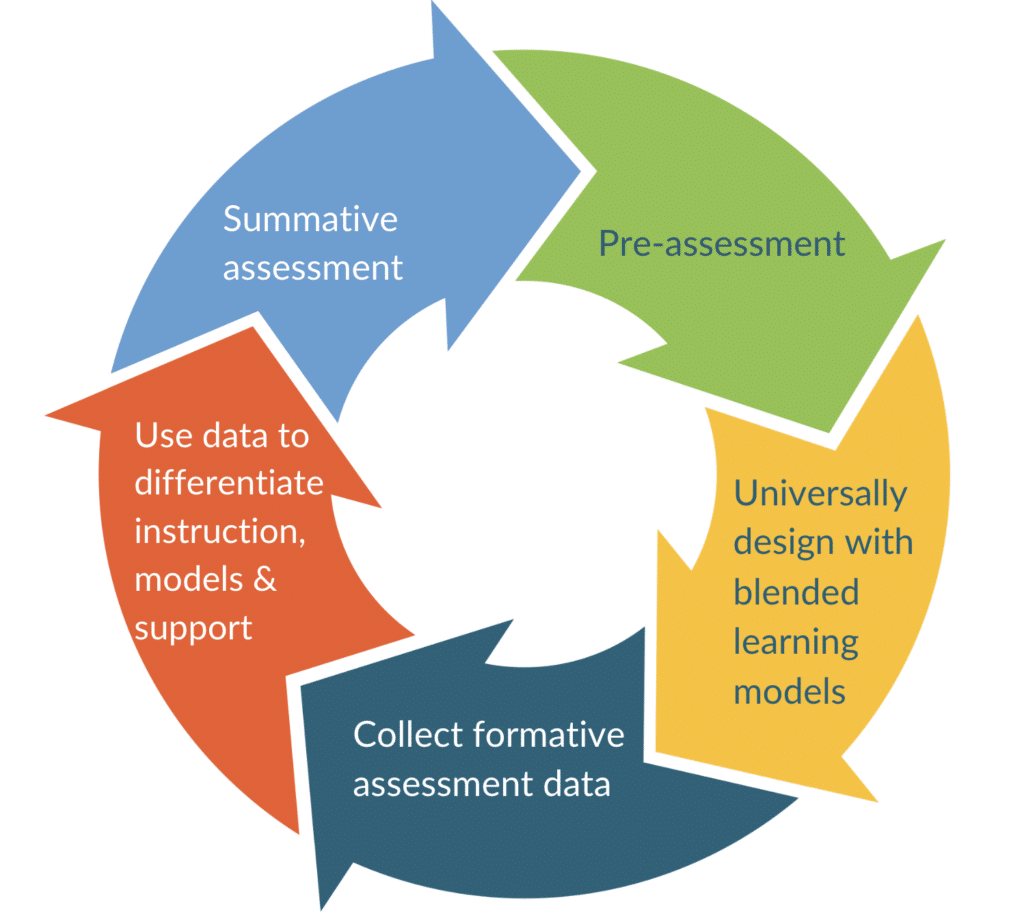
Use strategic data-driven design to help your students reach their learning goals! 🏆
Learn how to use data to differentiate & personalize learning in a blended classroom 👉🏻 bit.ly/3NCRhC8
#eddata
1
13
33
2,586