
Learn trading & investing with FinGrad | Biggest Financial Event company in India | Classes & Webinars by Expert Traders | Telegram: t.me/joinfingrad
Joined March 2022
- Tweets 1,575
- Following 6
- Followers 29,992
- Likes 2,945
1,309 Photos and videos


Pinned Tweet

Jun 13
TradeIQ × InvestIQ: India's Biggest Trading & Investing Concert is coming to Bengaluru. 🚀
📅 July 4-5
🎟️ Early Bird Passes are LIVE: joinfingrad.com/tradeiq
Join thousands of traders, investors, and market enthusiasts for 2 Days of learning, networking & growth.
1
9
962
10h
This strategy identifies strong market trends and breakout opportunities. The Donchian Channel highlights price breakouts, while the Vortex Indicator confirms trend direction and strength, helping traders find potential entry and exit points.
8
26
843
Jun 15
A strategy combining EMA trend direction with MACD centerline (zero line) momentum. EMA shows trend bias, while MACD above/below zero indicates bullish or bearish momentum confirmation for trade entries and exits.
8
45
1,871
Fingrad retweeted

Jun 14
FinGrad’s Traders Gala 2.0 was a resounding success, held at the Westin Goa, with over 250 participants. It was an incredible opportunity to meet high-intent traders and spend four days learning and networking with them in the beautiful setting of Goa. @joinfingrad


3
10
579
Jun 14
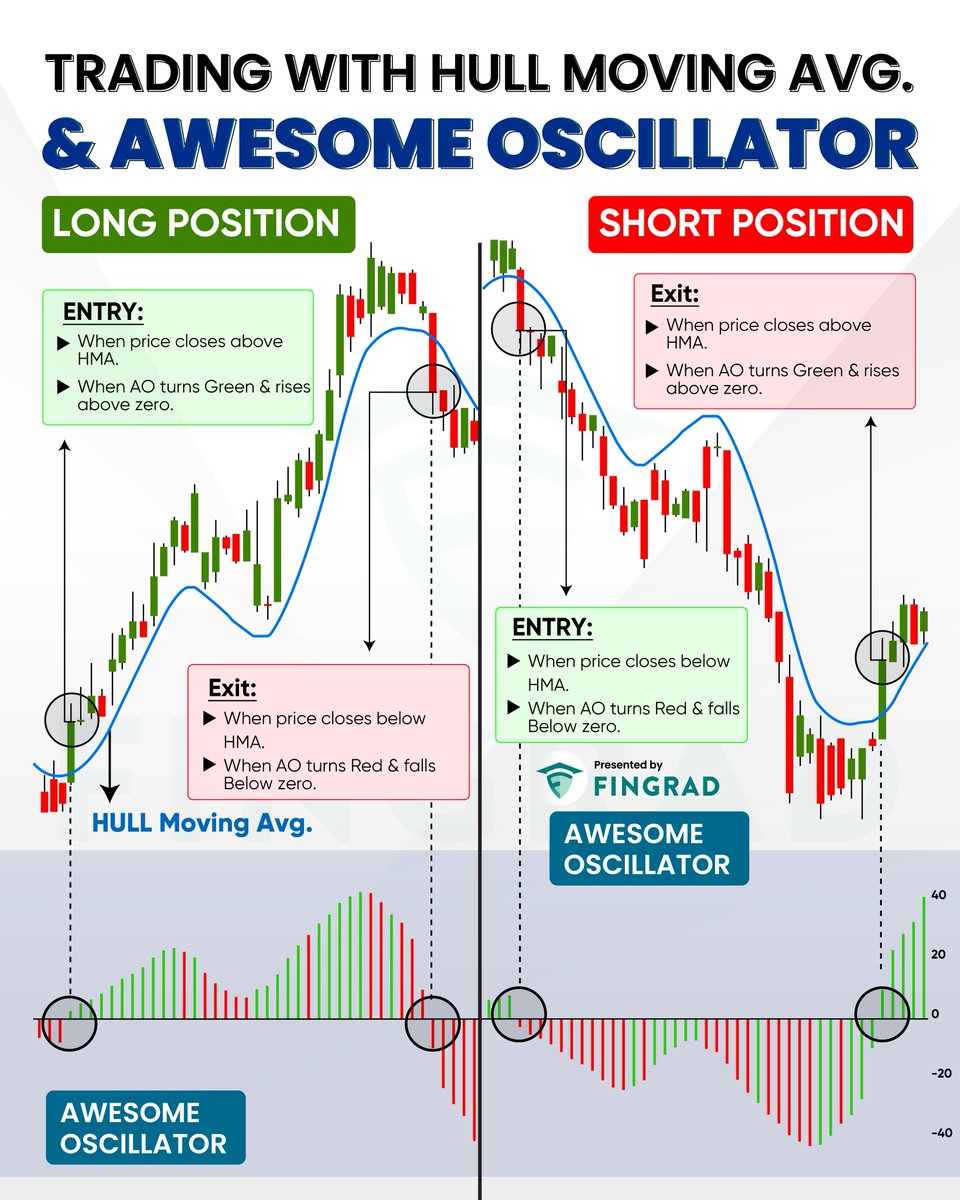
Using Hull Moving Average with Awesome Oscillator combines trend smoothing and momentum. Hull MA shows fast, smooth trend direction, while AO confirms momentum strength and reversals, improving entry and exit timing.
8
51
1,644
Jun 13
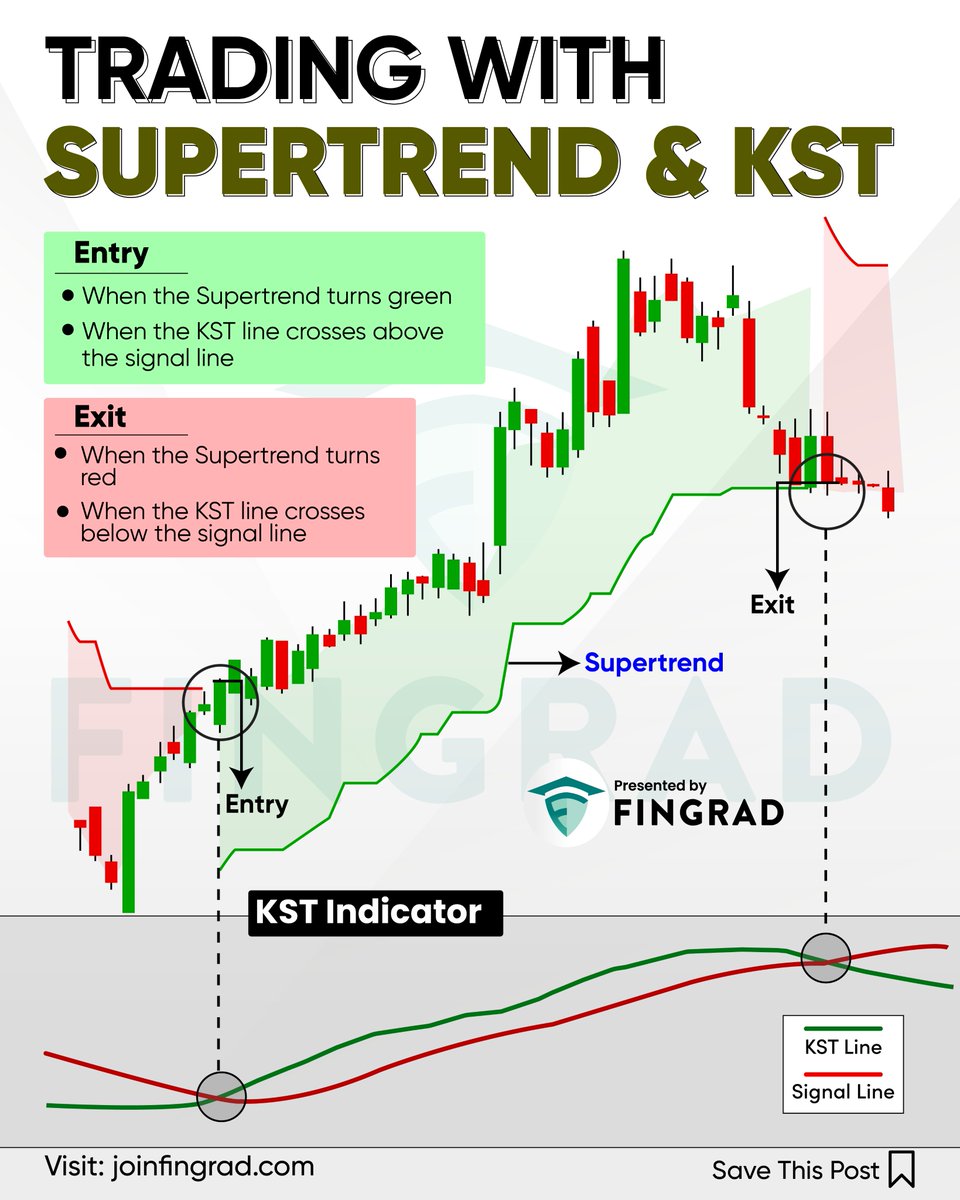
Using Supertrend with KST indicates trend direction plus momentum confirmation. Supertrend shows bullish or bearish trend, while KST identifies momentum shifts and potential reversals, improving trade timing and reducing false signals.
2
37
1,301
Jun 12
Trading with 5 and 20 EMA plus RSI indicates trend direction and momentum: EMA crossover signals bullish or bearish trends, while RSI confirms strength, guiding potential entry, exit, and avoiding counter-trend trades.
1
9
51
1,812
Jun 11
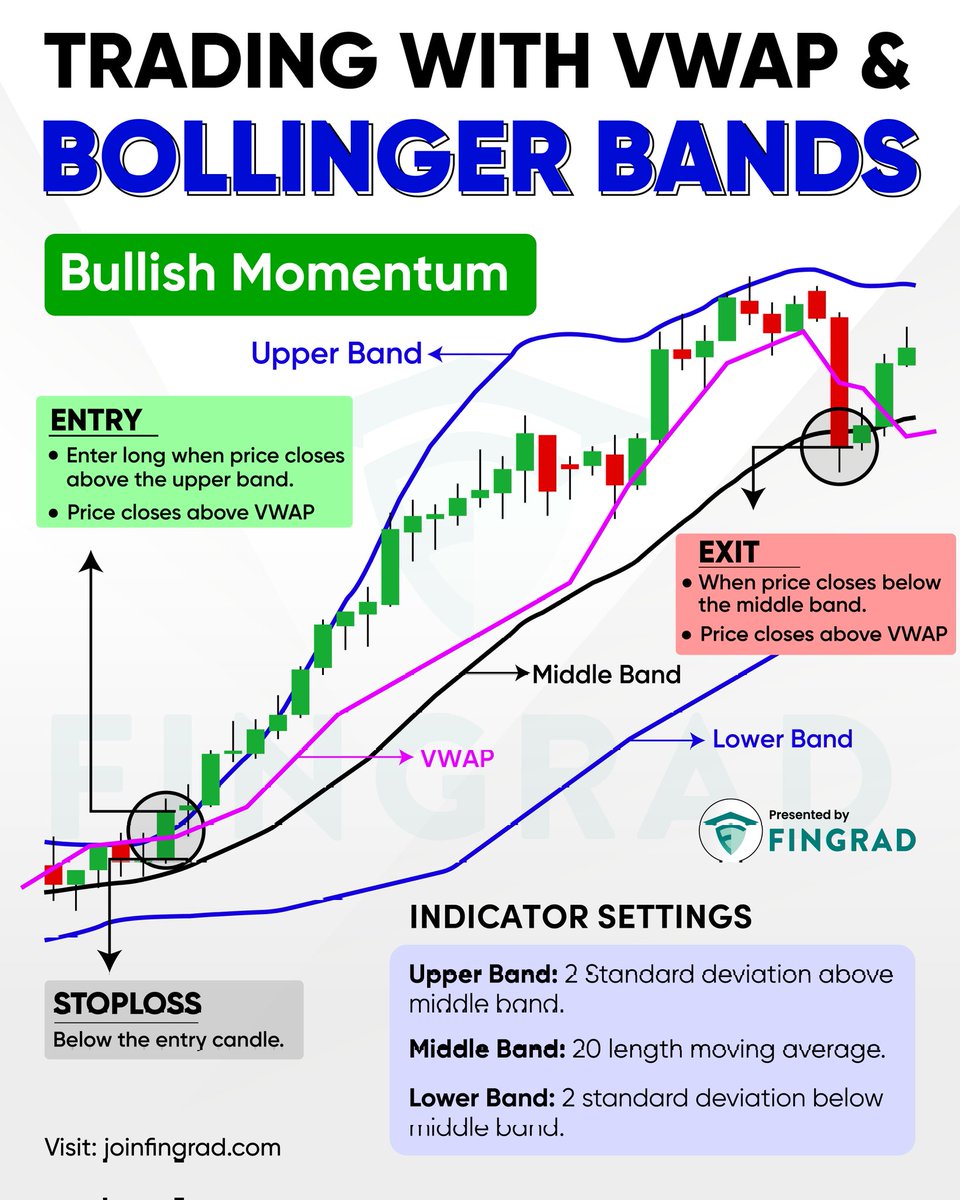
This strategy helps identify strong bullish momentum by combining Bollinger Band breakouts with VWAP confirmation. It filters weaker signals, improves trade accuracy, captures trending moves early, and provides clear entry, exit, and risk-management rules.
13
48
1,734
Jun 10
Trading with ChopZone & Golden Crossover helps traders identify strong uptrends, avoid choppy markets, find high-probability entry points on pullbacks, manage risk effectively, and improve trade accuracy using trend confirmation
4
28
919
Jun 9
RSI helps identify overbought and oversold conditions for entries and exits, while gap formations signal strong price movement or reversals. Use both together to confirm trend direction and improve trade timing.
9
45
1,508
Jun 8
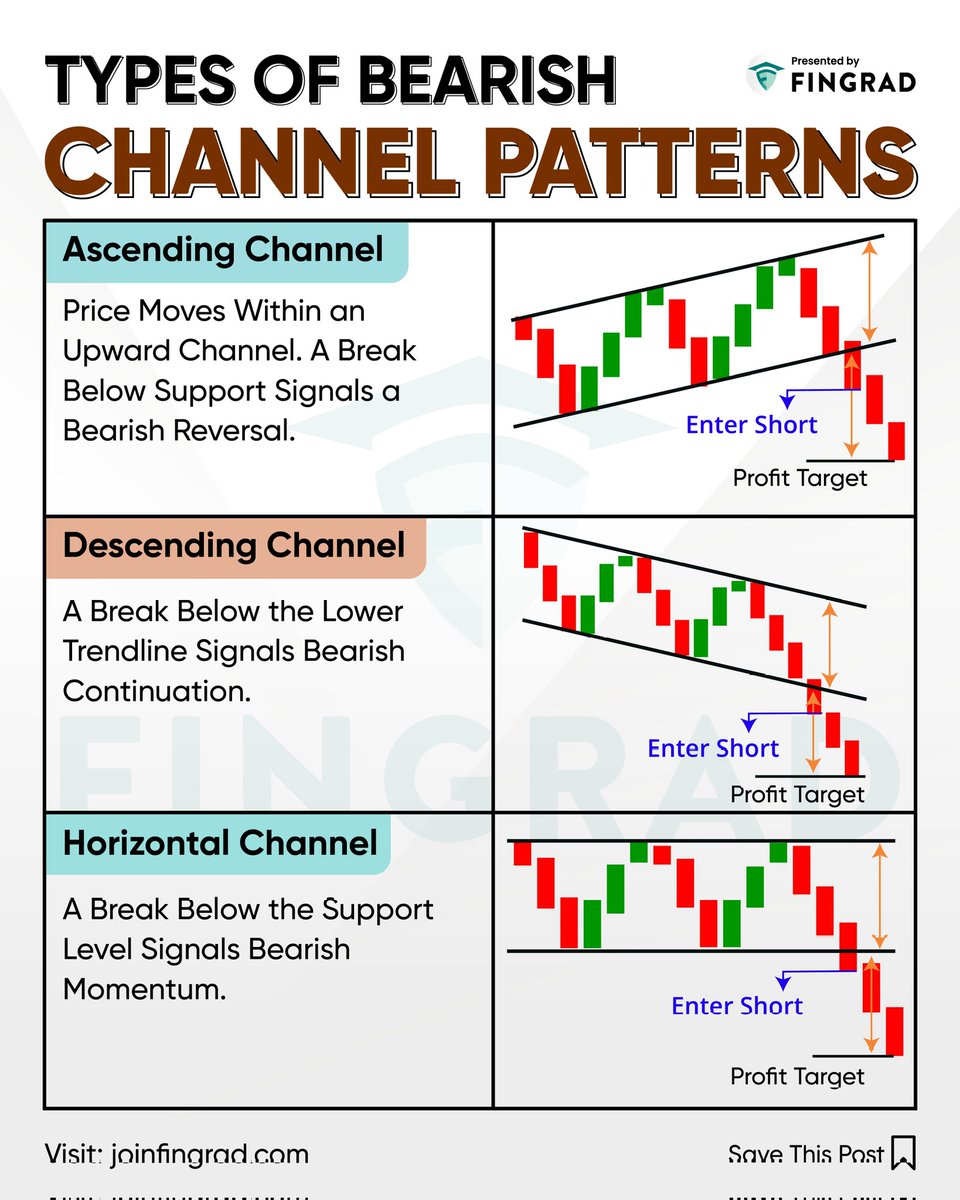
Understanding bearish channel patterns can help traders identify potential breakdowns, plan short-selling opportunities, & set realistic profit targets. Recognizing these setups early improves risk management & supports more informed decisions in different market conditions
6
22
878
Jun 7
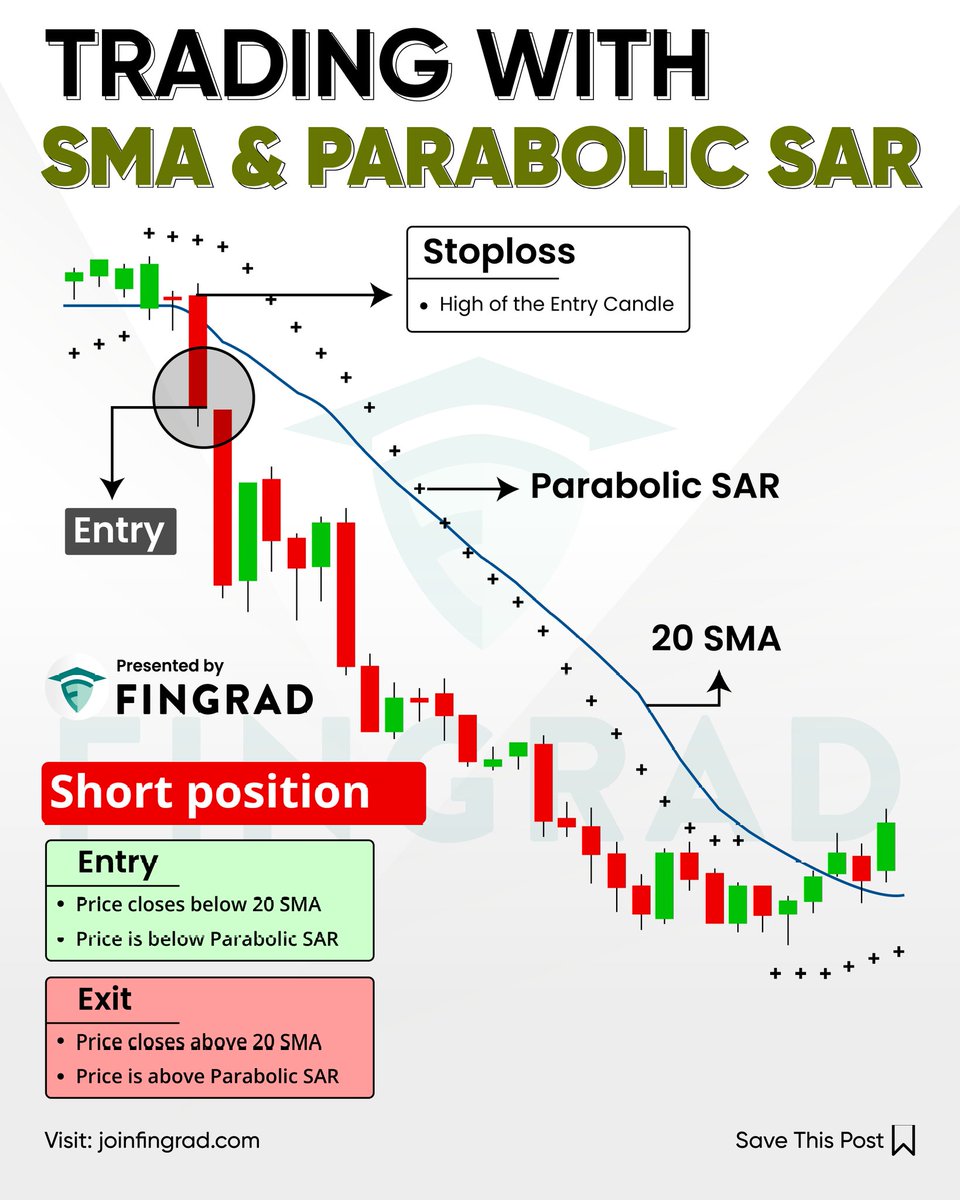
SMA identifies trend direction and averages price. Parabolic SAR shows potential reversals and exit points. Together they help traders confirm trends, time entries, and manage risk in trading decisions effectively.
2
4
43
1,453
Jun 6
The Alligator indicator identifies trend direction using moving averages. MACD confirms momentum and crossover signals. Together, they help traders enter trends early, avoid false signals, and exit when momentum weakens.

5
50
1,583
Jun 5
RSI identifies overbought or oversold conditions. The homing pigeon pattern signals bullish reversal after downtrend consolidation. Combined strategy waits for RSI confirmation and pattern completion before entering long trades with risk control.
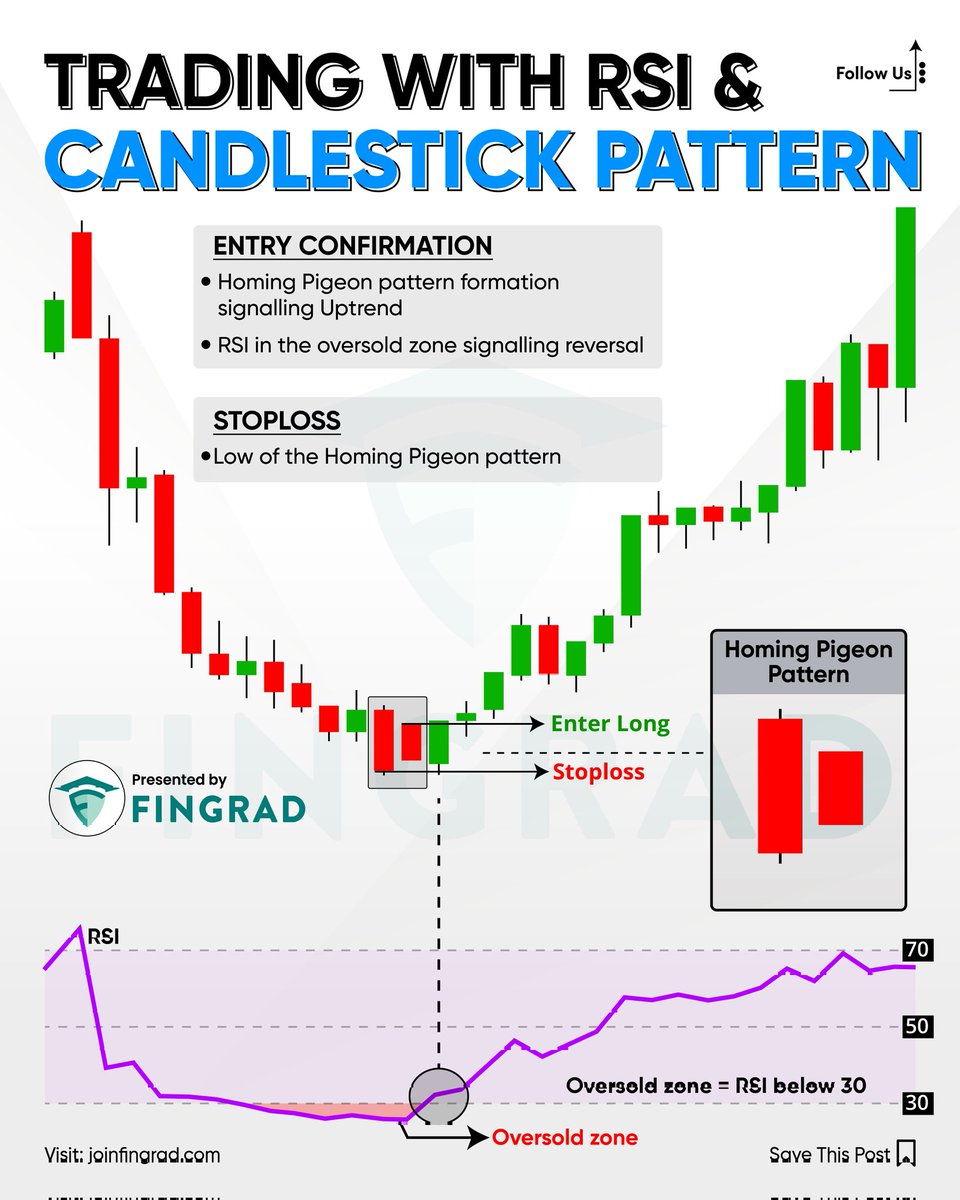
2
34
991
Jun 4
The strategy enhances trading efficiency by mitigating false signals through trend and momentum conflation. The SMA establishes directional bias, while the ROC validates momentum, offering systematic, objective entry and exit execution.

3
30
1,080
Jun 3
The Pitchfork Indicator helps traders identify market trends, support, and resistance levels. In a Bearish setup, traders enter near the median line pullback and exit near the Lower Support zone for potential profits.
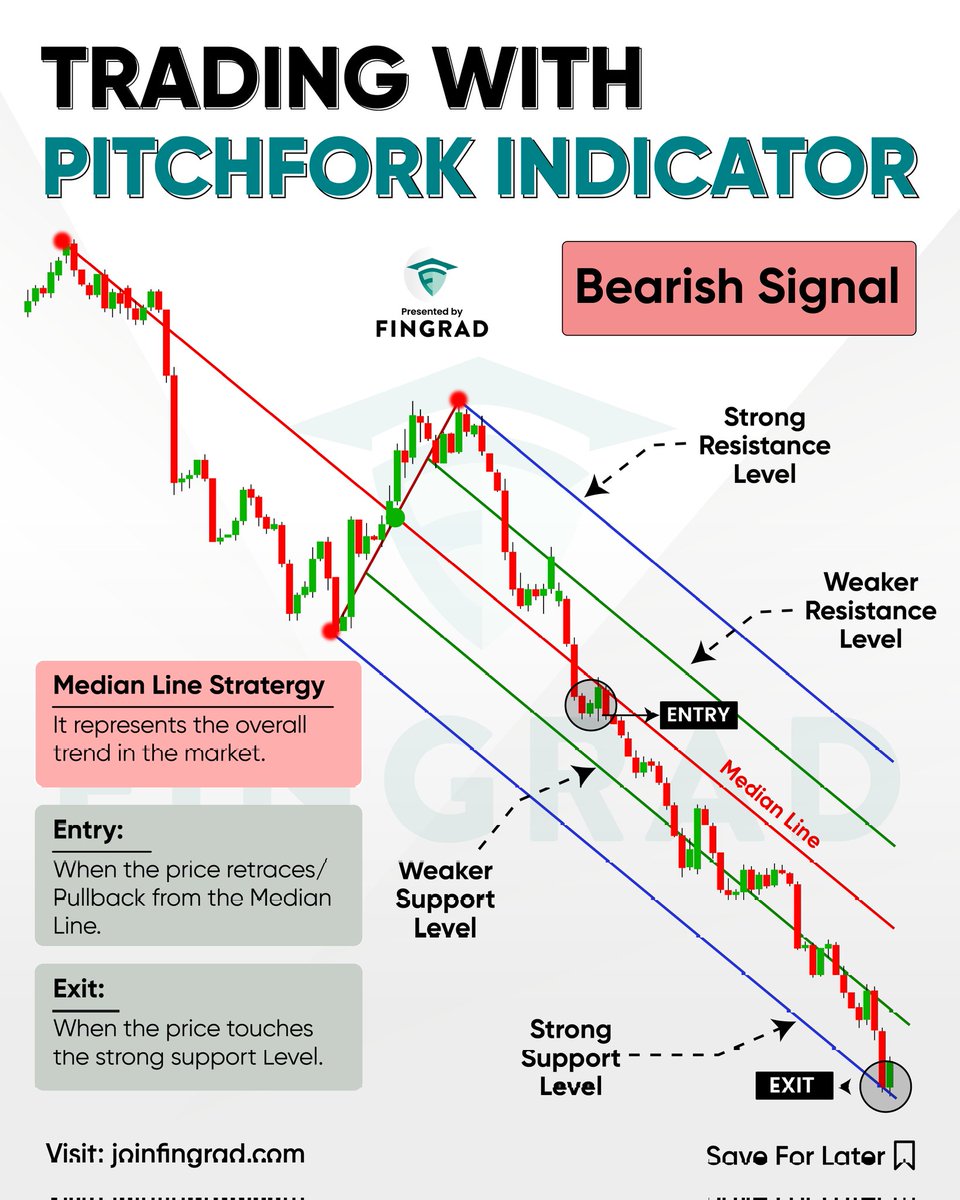
7
40
1,203
Jun 2
This strategy combines Pivot Points for key support and resistance levels with the Awesome Oscillator for momentum. It helps traders identify high-probability breakout entries and clear trend-following targets, effectively minimizing false signals in a bullish market.

5
22
1,283
Jun 1
Trading with RSI & Ichimoku Cloud Indicator helps identify market trends, momentum, and potential entry and exit points. RSI measures overbought and oversold conditions, while the Ichimoku Cloud confirms trend direction and support/resistance levels.
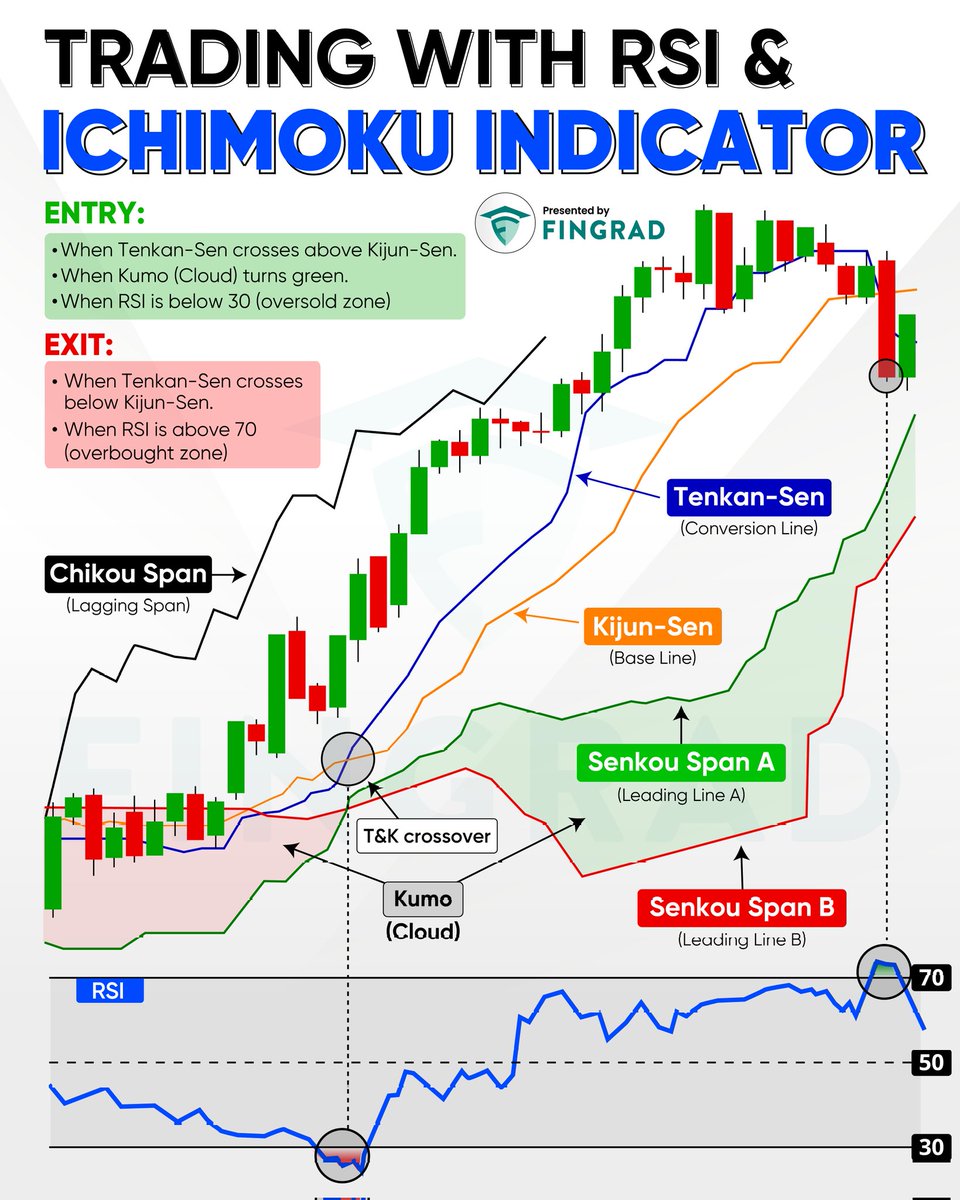
4
31
1,114
May 31
MACD identifies momentum and trend changes, VWAP shows the average traded price and market direction, while EMA highlights trend strength. Together, they help traders find entries, exits, and confirmations.
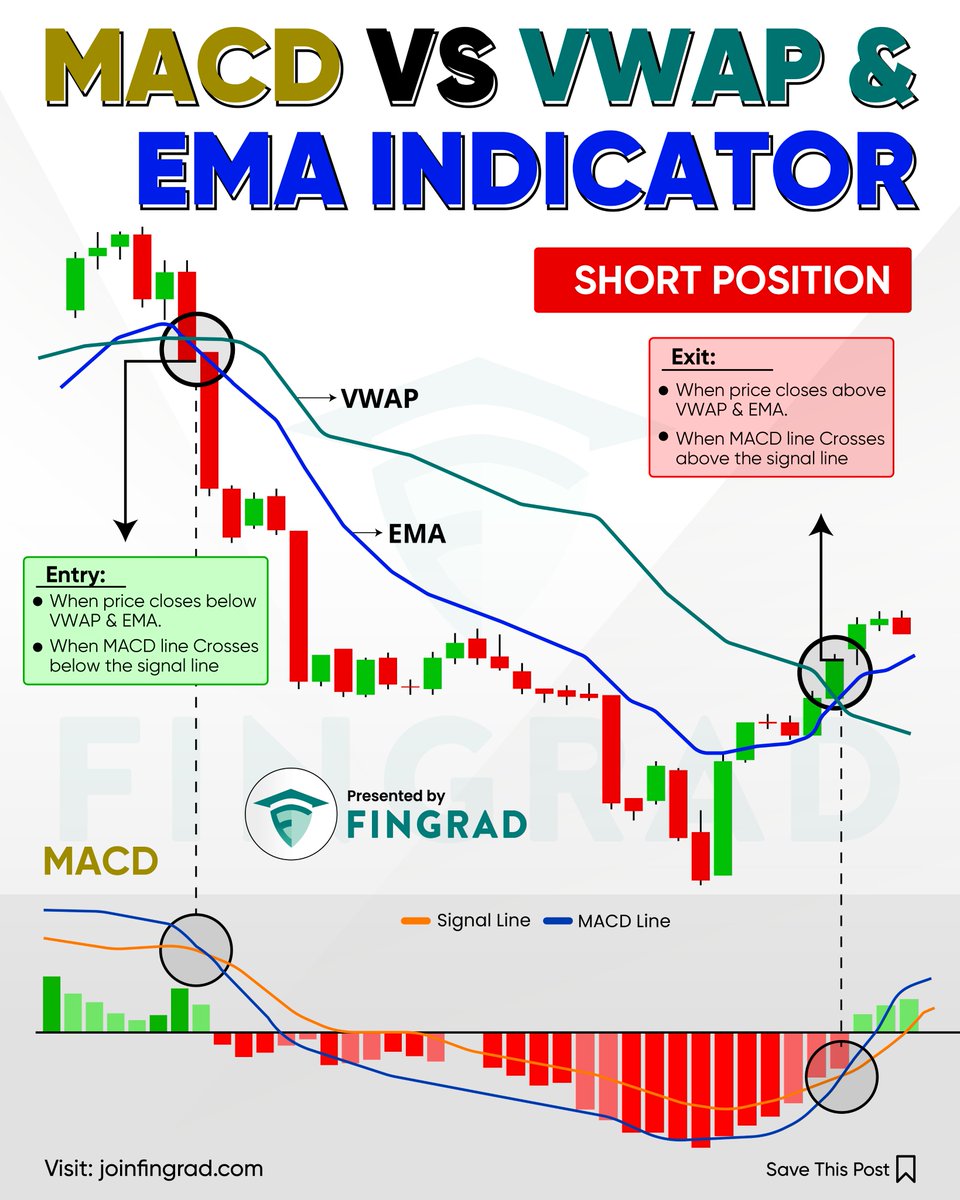
1
8
35
1,338
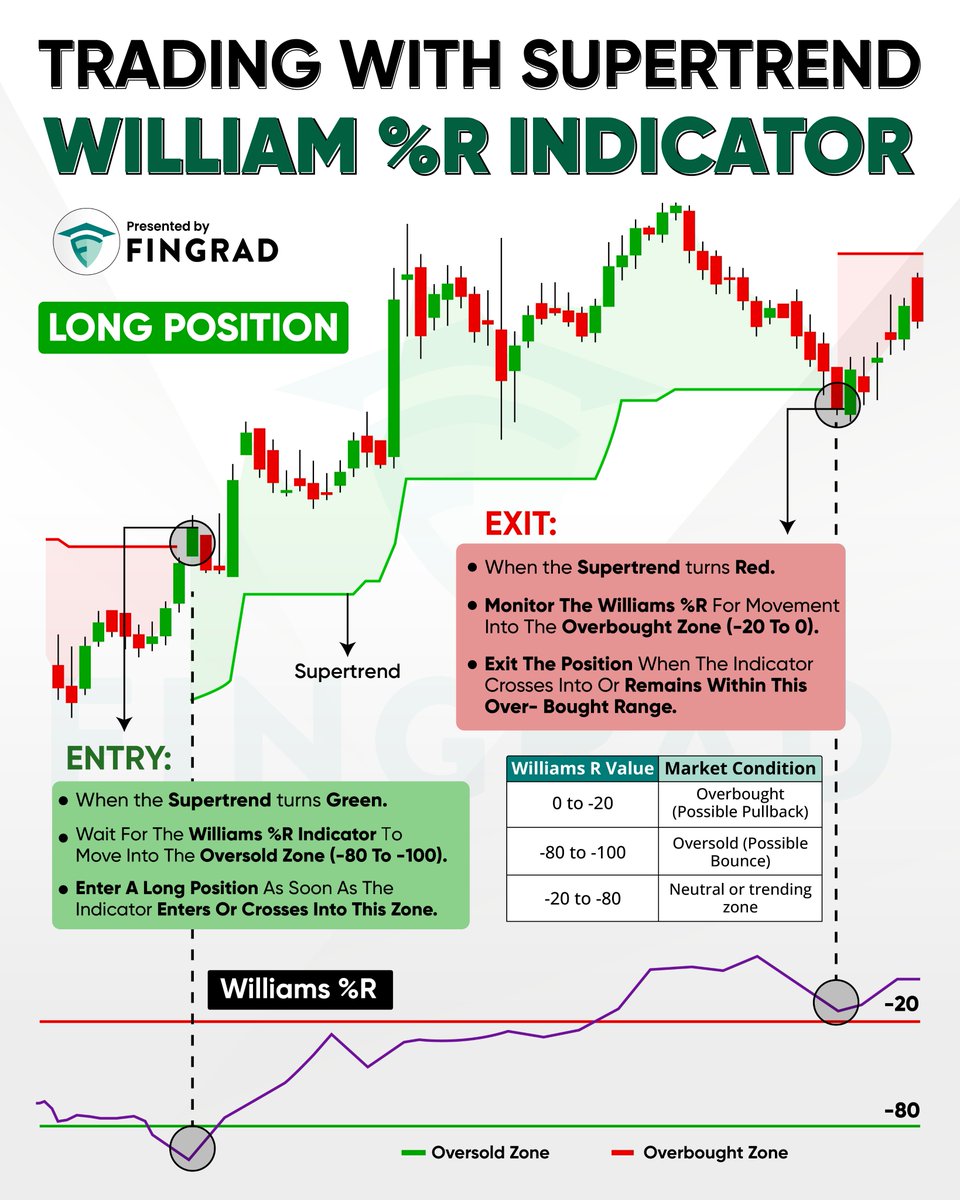
May 30
This strategy combines the Supertrend & Williams %R indicators to identify strong entry & exit points. Traders can enter during uptrends when prices are oversold & exit near overbought zones. It helps reduce false signals, improve timing, manage risk & capture trend-based trading
7
45
1,787