
The Utah Geospatial Resource Center (UGRC) provides mapping technology services to federal, state, and local governments and other organizations.
- Tweets 1,605
- Following 56
- Followers 669
- Likes 184


ALT A brindle-coated, medium-sized dog standing on a dirt hiking trail, viewed from the side and slightly behind. The dog is wearing a green collar, has its ears alertly perked up, and is looking off to the left into the tall green grass that lines the path. The background features lush green trees and a trail winding upward under a partly cloudy sky.
ALT A square graphic designed in a minimalist style resembling a periodic table element icon. The background features a dark slate blue color with subtle, lighter blue curved geometric gradient overlays running diagonally across the bottom. At the center of the image are the large white letters "Ca" written in a bold, clean sans-serif font. Directly beneath these letters, the word "Cadastre" is written in a smaller, slightly thinner white sans-serif font. The entire image is framed by a thin, crisp light gray border.
ALT An illustration depicting a university campus scene under a dark purple sky. In the background stands a large, symmetrical, yellow university building with classical columns and the word "UNIVERSITY" written across the pediment. Green pine trees are scattered in front of the building along a winding path. In the foreground, three students are sitting on a light-colored lawn, dressed in yellow and dark grey clothing that matches the scene's color palette. On the left, a student sits looking toward the center while holding an open book. In the center, another student is viewed from behind, facing a third student on the right who is sitting cross-legged and also reading an open book.
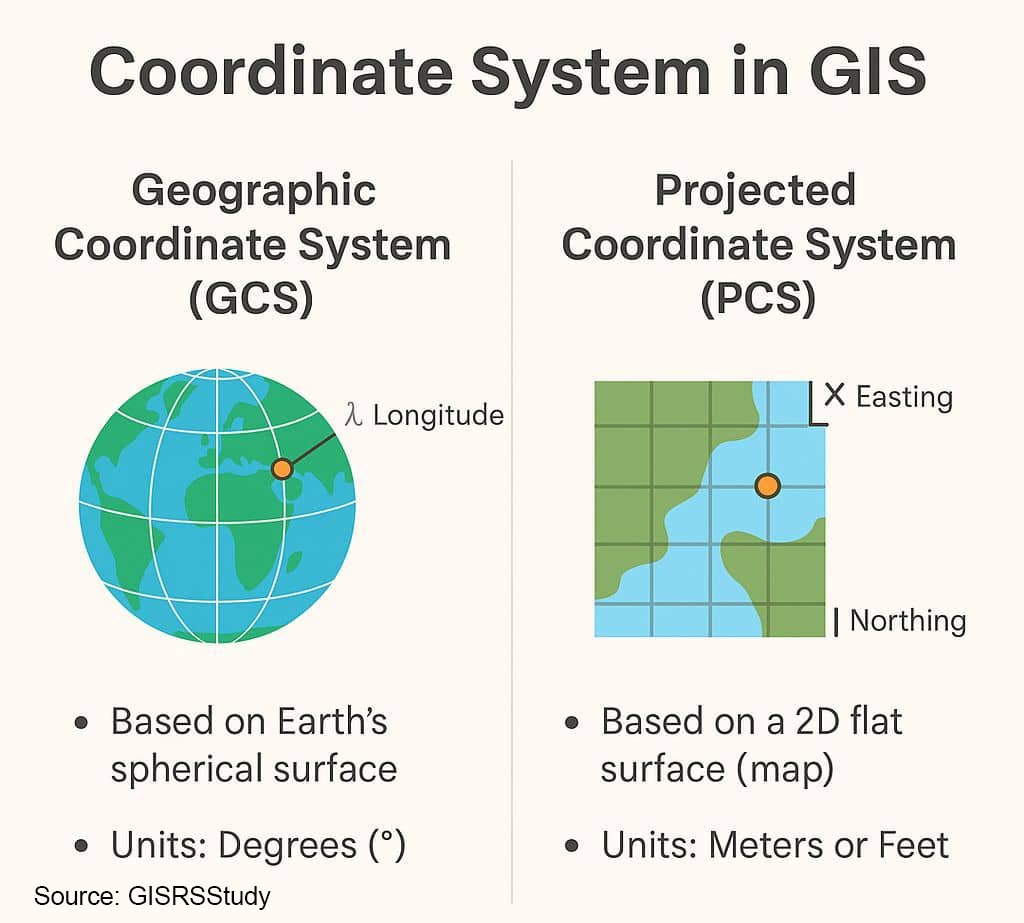
ALT An educational infographic titled "Coordinate System in GIS" that visually compares Geographic Coordinate Systems (GCS) and Projected Coordinate Systems (PCS). The image is divided into two main columns: Geographic Coordinate System (GCS): The left side features an illustration of a 3D globe with grid lines representing latitude and longitude, highlighting a specific point labeled with the Greek letter lambda for Longitude. Text below explains that a GCS is based on the Earth's spherical surface and uses degrees as its units of measurement. Projected Coordinate System (PCS): The right side shows a flat, 2D map grid overlaid onto a landmass and ocean scene, marking a specific point with "X Easting" and "Y Northing" coordinates. The text below describes a PCS as being based on a 2D flat surface (map) and using linear units such as meters or feet. The graphic attributes its source to GISRSStudy at the bottom left corner.
ALT A picture with a muted blue background and subtle circular and star shapes scattered across, displays an image of the United States including Alaska and Hawaii on a central white circle. Written above in a blue font with white lining are the words "BUILDING". In the same center-white circle as the image of the United States, below the image, are the letters "NSGIC", with the phrase "THE NSDI" located below that and with the same blue-with-white-lining font as the word "BUILDING".
ALT An illustrative poster rendered in a vintage travel brochure style displays the caption "WE’VE UNPLUGGED FOR THE DAY!" against a canyon landscape background featuring mountains, cliffs, and a setting sun in shades of orange and brown with a beige text panel at the bottom. Positioned in the center is a solid blue state-shaped cutout with a black electrical outlet on the right side. To the right of the outlet is a black electrical plug with three brass prongs that has been pulled out from the socket.
ALT A light-beige background features a header and footer of vintage world maps on an informational slide, with a dark blue title in a large, serif font that reads, 'The History of GIS: Trivia Challenge Answers.' In the left-hand center of the page, the information, 'GIS Division, November 17, 2021,' is listed in a brown, serif font that also appears at the bottom of the slide, 'Scroll Down to View Questions.'
ALT An illustrated group of friends sits on beanbags and the floor, engaged in lively discussion and collaborating with a laptop, within a cozy, purple-walled space.
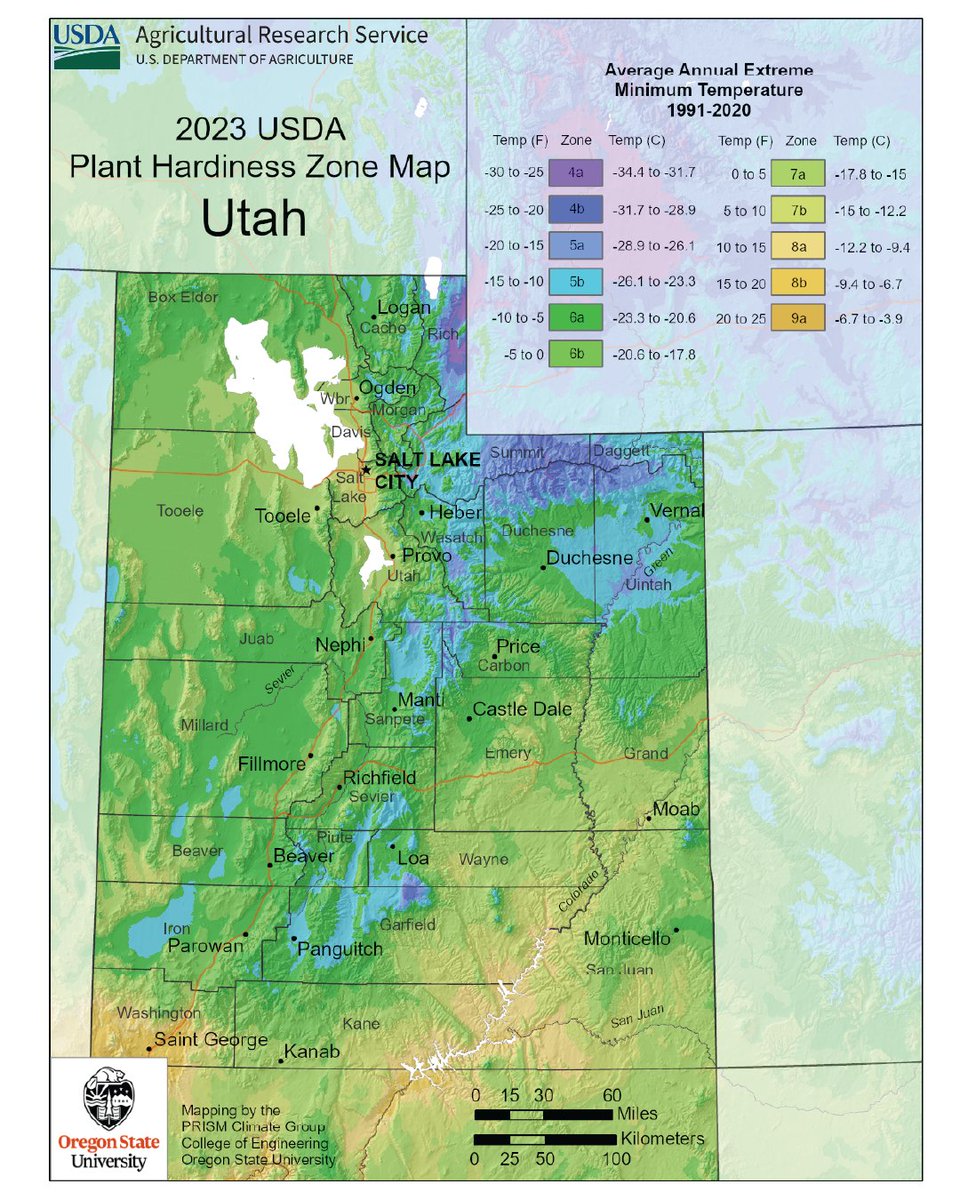
ALT This is an official 2023 USDA Plant Hardiness Zone Map for Utah, created by the Oregon State University PRISM Climate Group. The map displays Utah's climate diversity using color-coded regions that correspond to specific plant hardiness zones. A legend in the upper right-hand corner details that these zones (4a through 9a) are defined by the "Average Annual Extreme Minimum Temperature" based on data from 1991 to 2020, with temperatures listed in both Fahrenheit and Celsius. The map shows zones 4a (the coldest, in dark purple) concentrated in the high-elevation areas of northern and central Utah. The majority of the state, including key areas like Salt Lake City and Provo, falls within zones 6b to 7b (green tones). The warmest zones, such as 8b and 9a (orange and gold tones), are found in the southwestern corner of the state near Saint George. Major county boundaries, cities, and major roads are overlaid to help users identify their specific location and zone. A scale bar at the bottom
ALT A vector illustration in a modern, flat style shows a man with headphones sitting in an olive yellow armchair. The man is wearing a grey t-shirt, dark trousers, and yellow sneakers, with his left leg crossed over his right. He is looking at and working on a light grey laptop that is resting on his lap. To the left is a potted plant with yellow leaves, and on the ground is a white circular rug. The background is a dark grey.
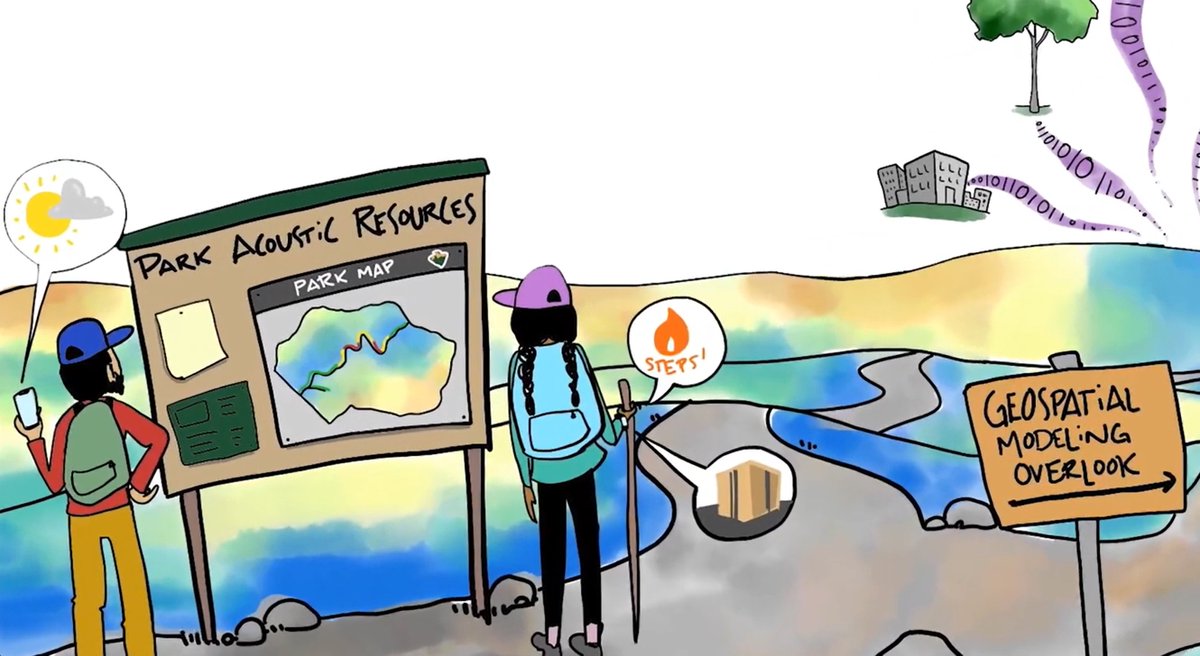
ALT An illustration showing two hikers looking at a sign that says, “Park Acoustic Resources” and “Park Map” with a simple map illustration. To the right of the hikers is another sign that says, “Geospatial Modeling Overlook.”