
Joined February 2020
- Tweets 15,785
- Following 2,806
- Followers 32,383
- Likes 6,994
9,776 Photos and videos


Jun 12
You can actually ignore the noise about EL TACO's alleged deal with Iran - until it actually happens.
Stay focused on whether bitcoin:native closes the week above or below the R/S flip line, and whether Weekly RSI closes trending upward or downward.
Jun 12

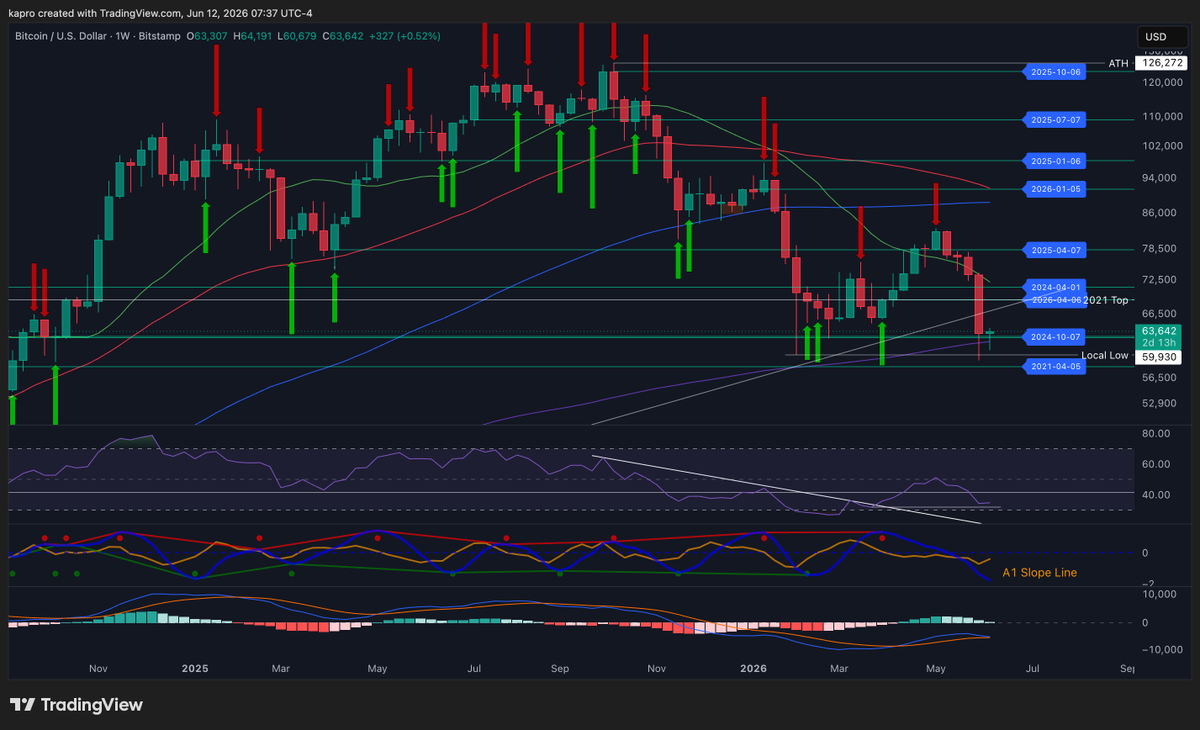
bitcoin:native 's Weekly RSI opened slightly below flat, but quickly took a dive towards the lows. Now it's attempting to revert...
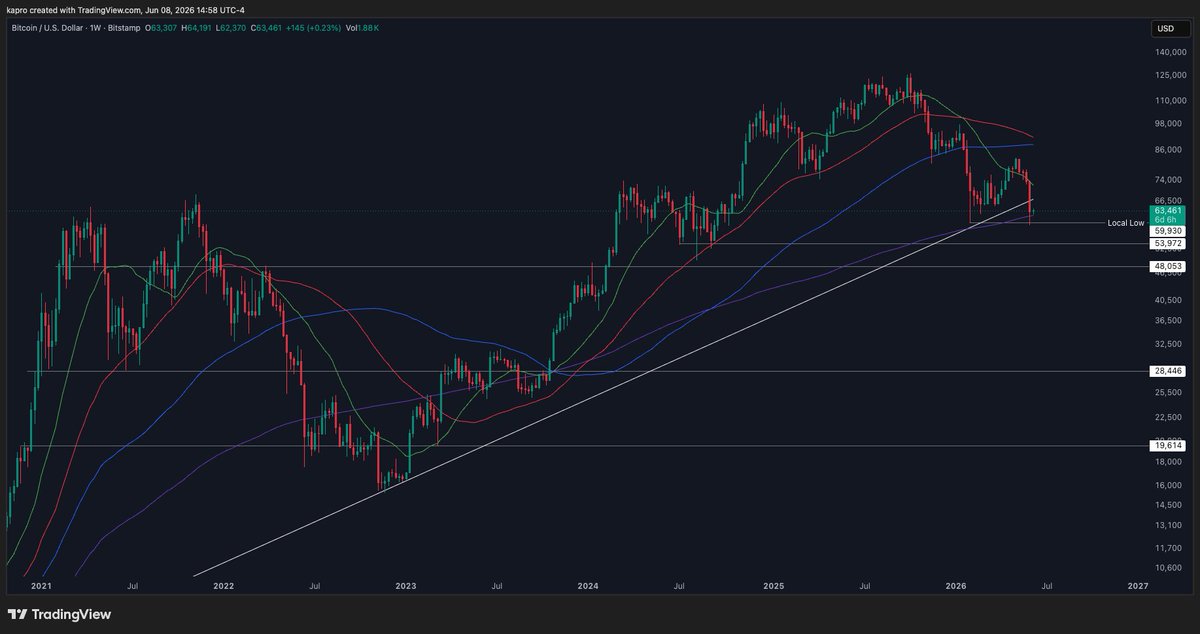
There's a cluster of Timescape Levels that have confluence with the 200 WMA which seem to be serving as the R/S Flip line on momentum.
If Bitcoin can hold above that level (~$62.5k) for the W close, and Trump can close a deal, we could see a significant move higher. If price fails to close above the 200 WMA, and Trump fails to get a deal, expect the downtrend to extend.
1
10
1,514
Jun 11
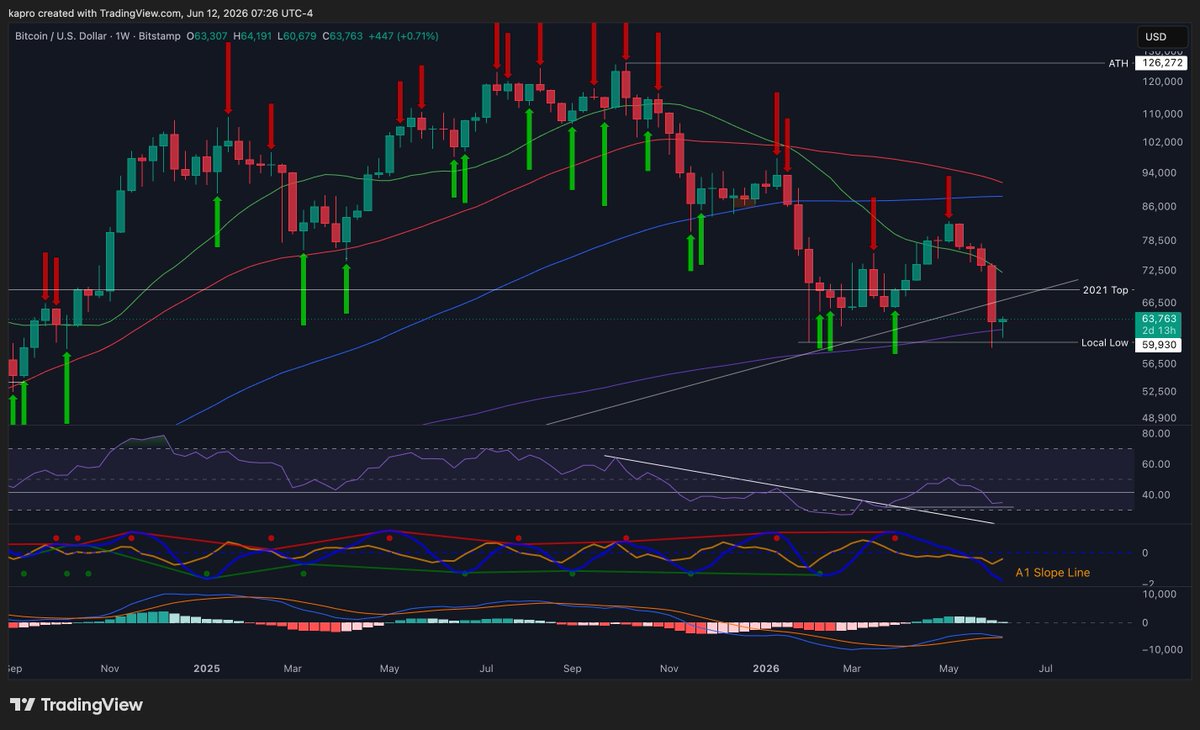
Do you know why this range is important?
$BTC is running into resistance at a cluster of Timescape Levels in the $62.5k - $63.5k range.
In 2024 Bitcoin consolidated between the Timescapes in the $58k - $71k range as the handle of the C & H pattern was being built - a lot of that time was spent between here and $58k.
Losing support at $58k will kick the door open to $48k with a potential stop at $54k on the way down.
These consolidations are healthy, but they also serve as structural resistance and support levels in both directions.
How are you preparing for what comes next?
5
5
26
1,884
Jun 10
With over $300M in bitcoin:native bid liquidity stacked between here and $55k, and ask liquidity razor thin up to $65k, it would take very little effort to push price up to $65k, but there is simply no sentiment for that...yet.
2
2
29
2,340
Jun 9
BTC & ETH ANALYSIS | ARE YOU MISREADING WHERE WE ARE IN THE CYCLE? x.com/i/broadcasts/1mxPaaDwo…
2
4
839
Jun 9
This volatility is a traders dream - full of opportunities in both directions, but if you lack conviction and discipline you're going to get chopped up trying to swing trade.
Are you Long or Short on your last $BTC trade?
1
1
9
1,358
Jun 8
The dynamic combination of optimism that $BTC has printed a bottom, alongside the FUD that it has not, is a classic character trait of bear markets.
The biggest difference between market participants on either side of this debate - is discipline.
Where do you stand in this question?
7
1
30
2,006
Jun 5
BTC & ETH ARE IN THE MOST IMPORTANT ZONE OF THE ENTIRE CYCLE x.com/i/broadcasts/1rGmqqLbM…
Bitcoin is trading in the most important zones of the entire cycle.
Fear is everywhere. The "crypto is dead" narrative is back. Panic sellers are getting triggered, while long term investors are contemplating whether or not this is a buy zone.
The truth is, nobody knows exactly where or when the bottom will print.
In this BTC and ETH analysis, we'll examine the order book, liquidity, key technical levels, and the market structure that could determine whether BTC and ETH are building foundations for the next major move, or if more downside remains ahead - and we’ll identify down range targets so we are prepared for any scenario.
The goal isn't to predict the future.
The goal is to understand the probabilities, protect capital, and be prepared for the opportunities ahead.
1
8
1,061
Jun 4
Interestingly, @BobLoukas has started rebuilding the HODL position in his model portfolio. Not because he saw a liquidity stacking around $60k, but simply because he considers this to be a good range from a technical perspective, and he's not interested in absolute tops or bottoms.
What price ranges do you add to your bitcoin:native HODL position?
Jun 4
On a platform full of noise makers and hopium dealers, it's nice to have rational voices like @BobLoukas offering clear $BTC analysis and guidance on how to build long term positions.
Watch, learn, and share.🧠
1
12
1,922
Jun 4
A cluster of bid liquidity at $60k, the local low at $59.9k, and a Timescape Level at $58.2k are the last things keeping bitcoin:native from the next cascade down.
Take and share the poll to gauge market sentiment.
Jun 4
Did you buy the dip?
$BTC has fallen through the macro support trend line and wicked to the 200-Week moving average - considered a key level of structural support.
What's your approach?
2
1
14
2,643
Jun 3
Are you on the right side of the volatility?
Volatility brings opportunities in both directions. Whether you are on the right side of those opportunities depends on the data your analyzing and whether you have disciplined yourself to be unbiased, patient, prepared, and positioned for the opportunities that present themselves.
Here's what I'm watching. LMK if it's helpful.
Jun 3
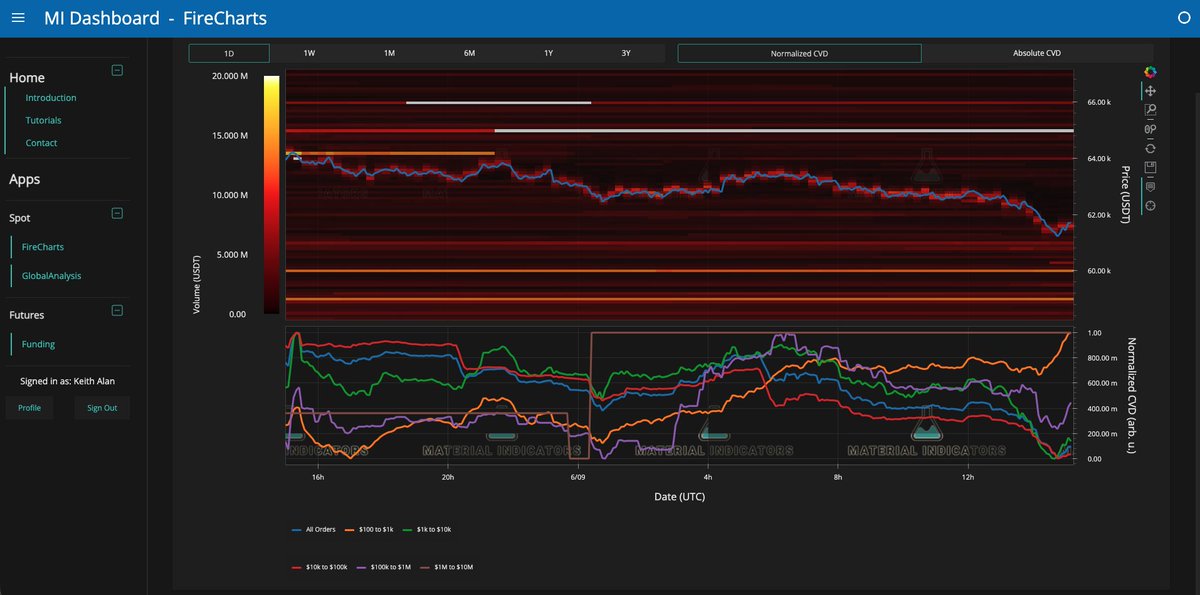
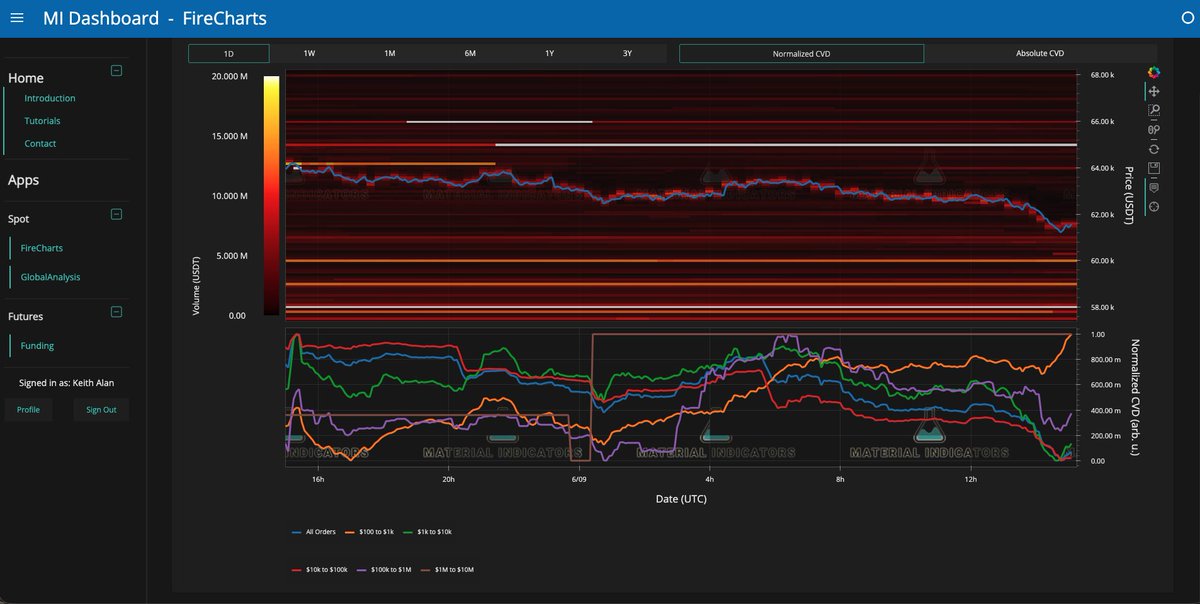
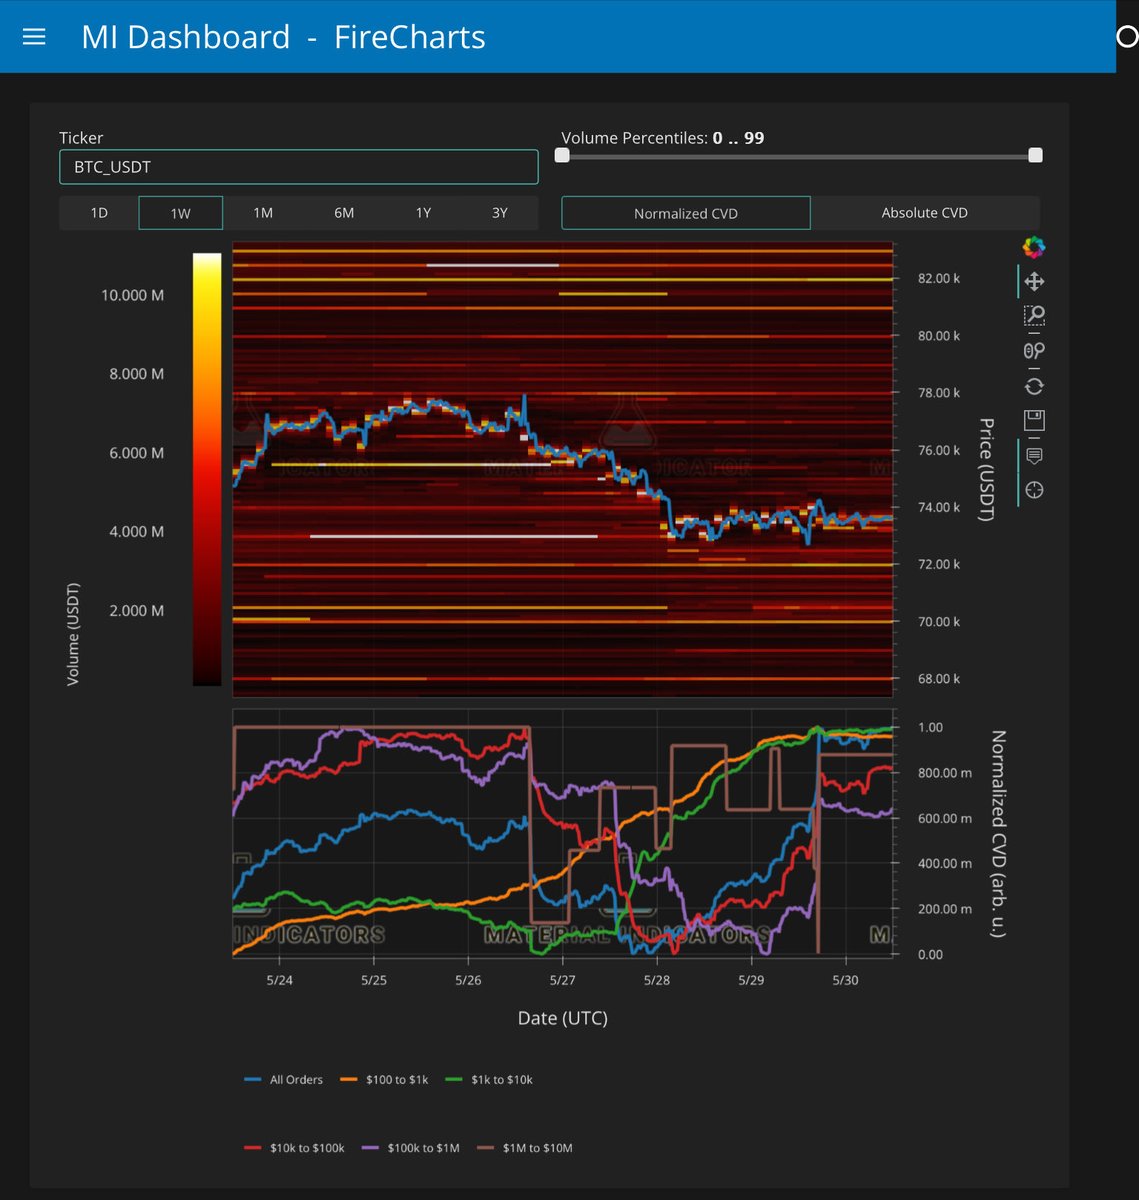
Are you watching the right data?
FireCharts reveals some shifting liquidity dynamics in the bitcoin:native order book on @binance around $65k.
Perma Bulls and hopium addicts desperately want to see support hold at $65k.
Confluence with the macro trend line, and the quick bounce from $65.5k, make it compelling.
The fact that we are now seeing a complete retrace of the bounce - is telling.
Bears want to see price cascade down to hades.
But history has taught us that fast violent moves in either direction aren’t typically sustainable.
As a disciplined trader, you put bias on the sidelines and let the data tell you how things are likely to develop.
Is there a chance that $60k holds as the cycle bottom?
Absolutely… but I’m not rushing to close shorts or start rebuilding a long for the next bull market.
Not yet…
Instead, I’m watching the liquidity games, order flow dynamics, Timescape Levels, and weekly RSI for clues.
A successful retest of support at the trend line or 200-WMA, an exponential increase in bid liquidity, order flow, Weekly RSI reverting, and an R/S Flip at $69k would make me start closing shorts and building longs.
Making a lower low under $59.9k would make me consider adding to shorts.
At this stage - my profits on BTC and ETH shorts are locked, a series of down range TP targets are set, and I’m looking to trade the volatility in either direction as opportunities present themselves.
I won’t wait until the 4-Year Cycle theory tells me what month I should flip long - I’ll let the charts and the underlying data guide that decision.
If you want to see my full analysis, check it here...
x.com/KAProductions/status/2…

1
6
1,883
Jun 2
BTC IS TESTING THE MOST IMPORTANT LEVEL ON THE CHART x.com/i/broadcasts/1kJzDDgaD…
Everything comes down to this level.
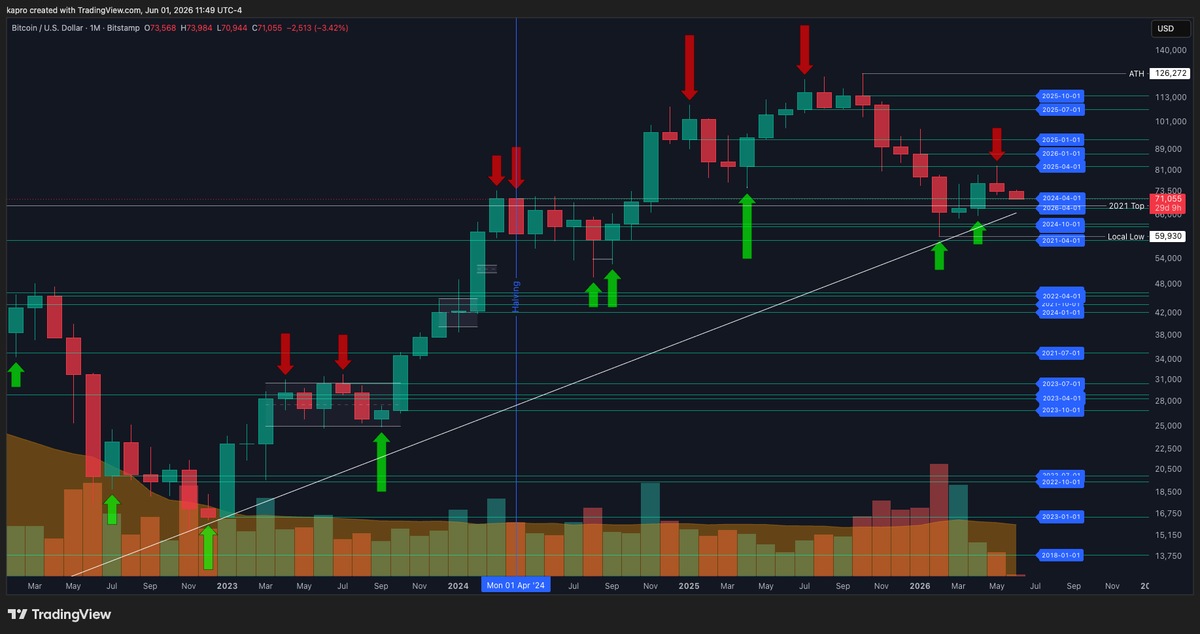
As I write this, Bitcoin is testing what I believe to be the single most important structural level on the entire chart:
The $69k Timescape R/S Flip.
This isn’t just another support line.
This level represents:
☑️ The 2021 Top
☑️ The Q2 2026 Open
☑️ Multiple extended periods of macro consolidation
☑️ The breakout level of the Election Day Trump Pump
☑️ And… the gateway to Bearadise
What happens here will determine where the macro bottom ultimately forms.
If bulls can defend this level and reclaim momentum, we may begin building the foundation for a broader recovery later this year.
If this level fails with weakness and momentum confirmation to the downside, the market could enter a much deeper phase of downside price discovery.
In today’s BTC analysis we’ll break down:
• Best and worst case scenarios
• Key support and resistance levels
• Momentum and RSI signals
• Order flow and liquidity behavior
• And the invalidation levels that will guide us through the next major move
Because right now, this isn’t about narratives.
It’s about structure.
And the signs are getting clearer.
📊 Trade the charts. Ignore the noise.
1
8
1,174
Jun 2
FireCharts shows bitcoin:native bids stacked at $60k. It may take some time to get there, but it's a viable target that will test the local low.
Losing that level would open the gates to Bearadise.

1
1
15
1,528
Jun 2
No idea if this is actually @fundstrat - tbh, it doesn't really matter who it is.
The most important question is, do you think this will hold ethereum:native up for more than a few hours?

1
5
1,067
Jun 1
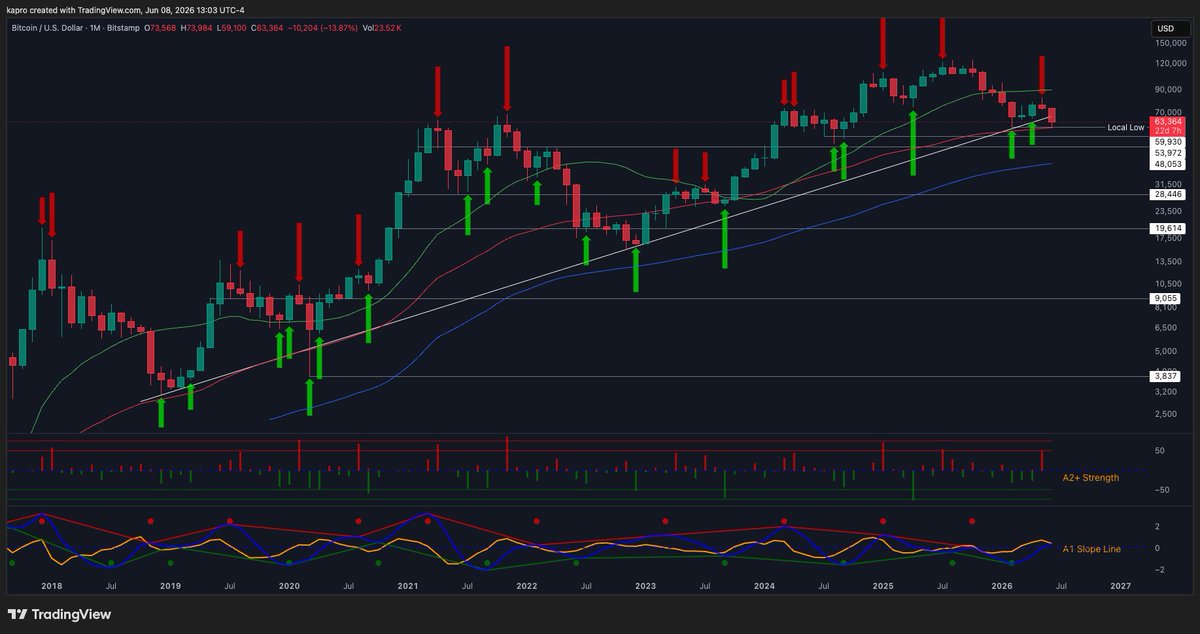
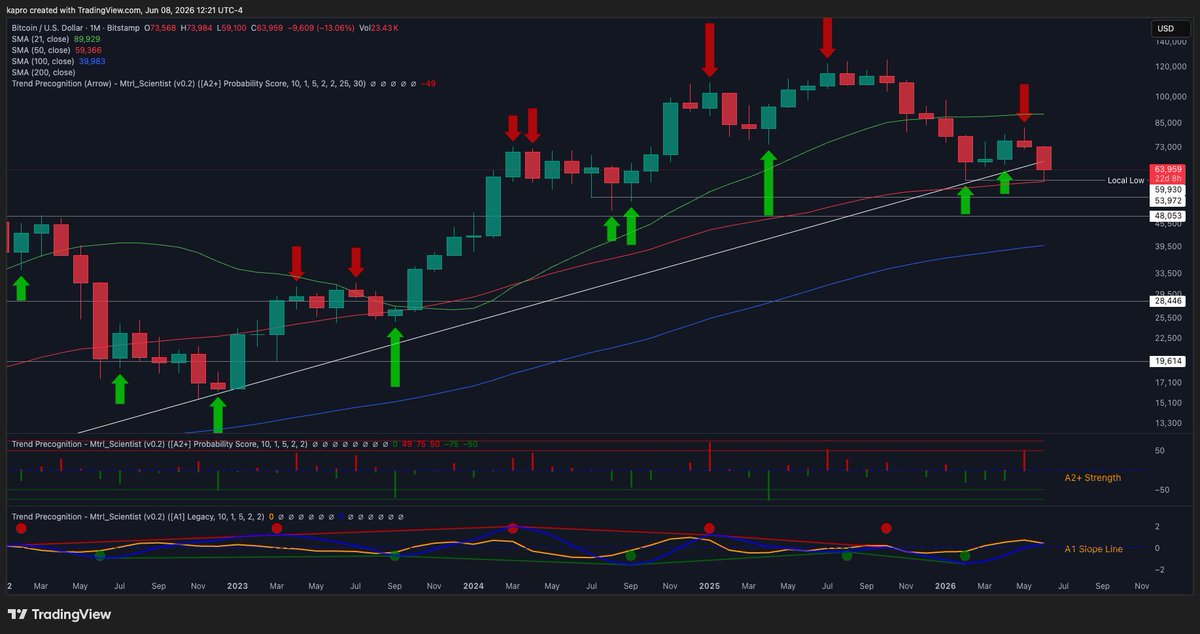
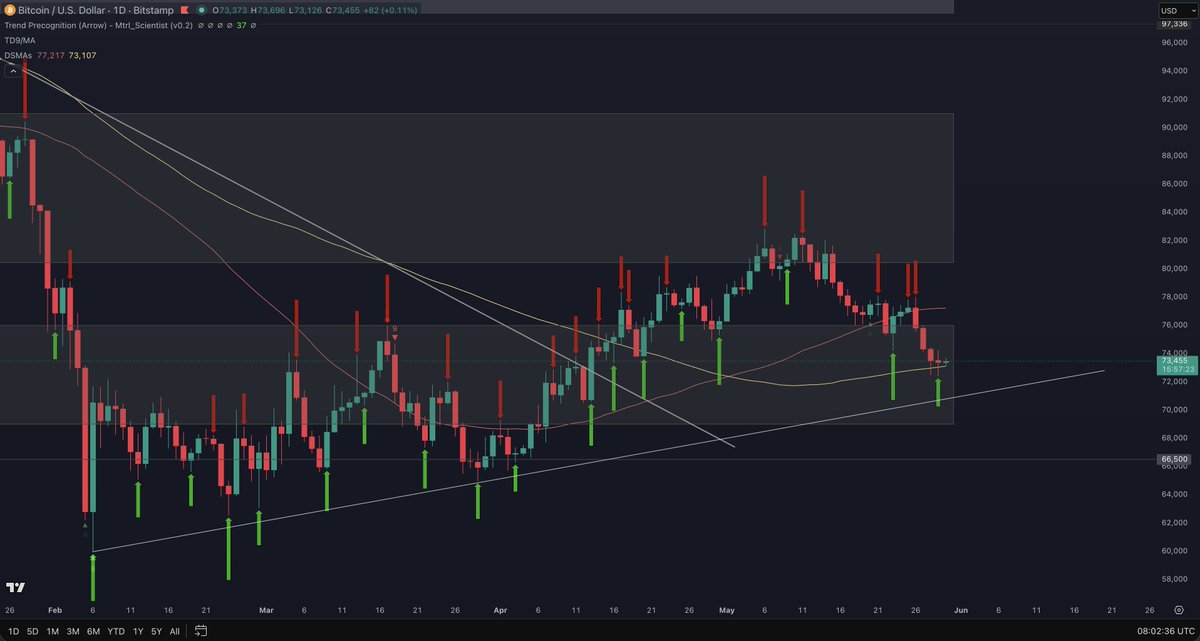
Did Trend Precognition just say, “Go Away” to May?
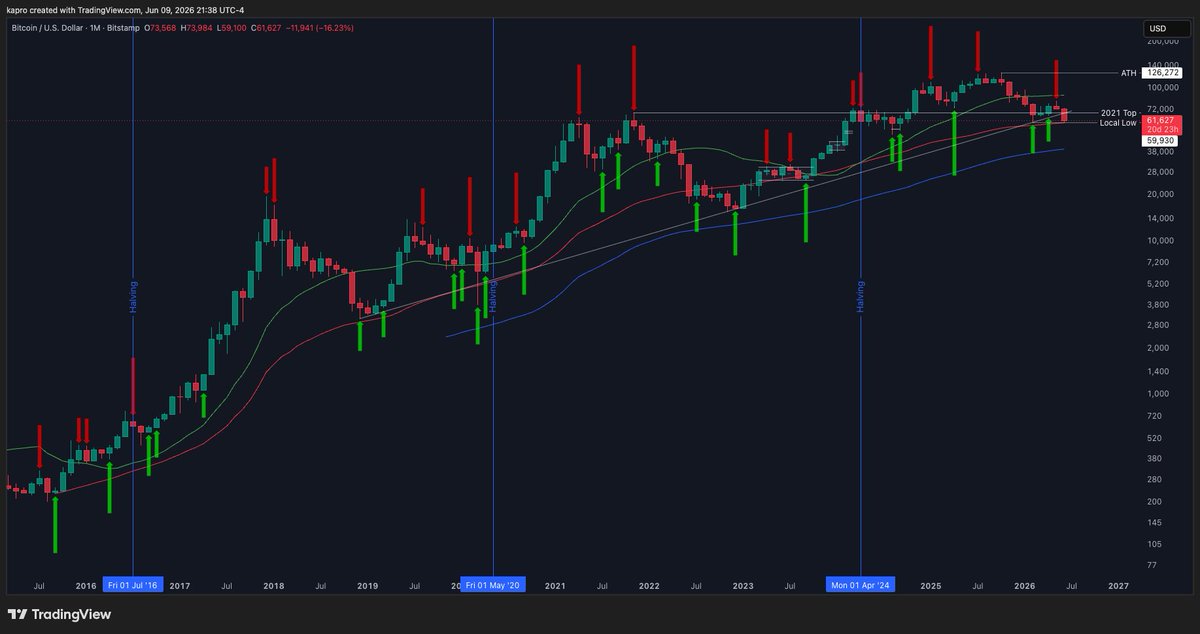
The outlook for June is clearly bearish, but remember, this new Trend Precognition signal technically doesn't validate until this candle closes. As long as bitcoin:native price stays below $82.8k, I expect it to validate.
We still need to watch levels to determine if this is going to develop into a base building consolidation, or the next leg down.
The fact that price just fell through another Timescape level is another sign of weakness. The real test comes at the Q2 2026 Timescapes in the $68k - $69k range.
Losing that level has macro implications that would send Bitcoin to a structural test around the local bottom, the trend line, and the 200-DMA which are clustered in the $59.9k - $65k range.
If bulls lose that range - pack your bags for Bearadise.
2
5
19
1,582
May 30
FireCharts shows that the bitcoin:native order book on @binance is extremely thin, especially to the upside.
TLDR: The path of least resistance is up.
1
15
1,537
May 30
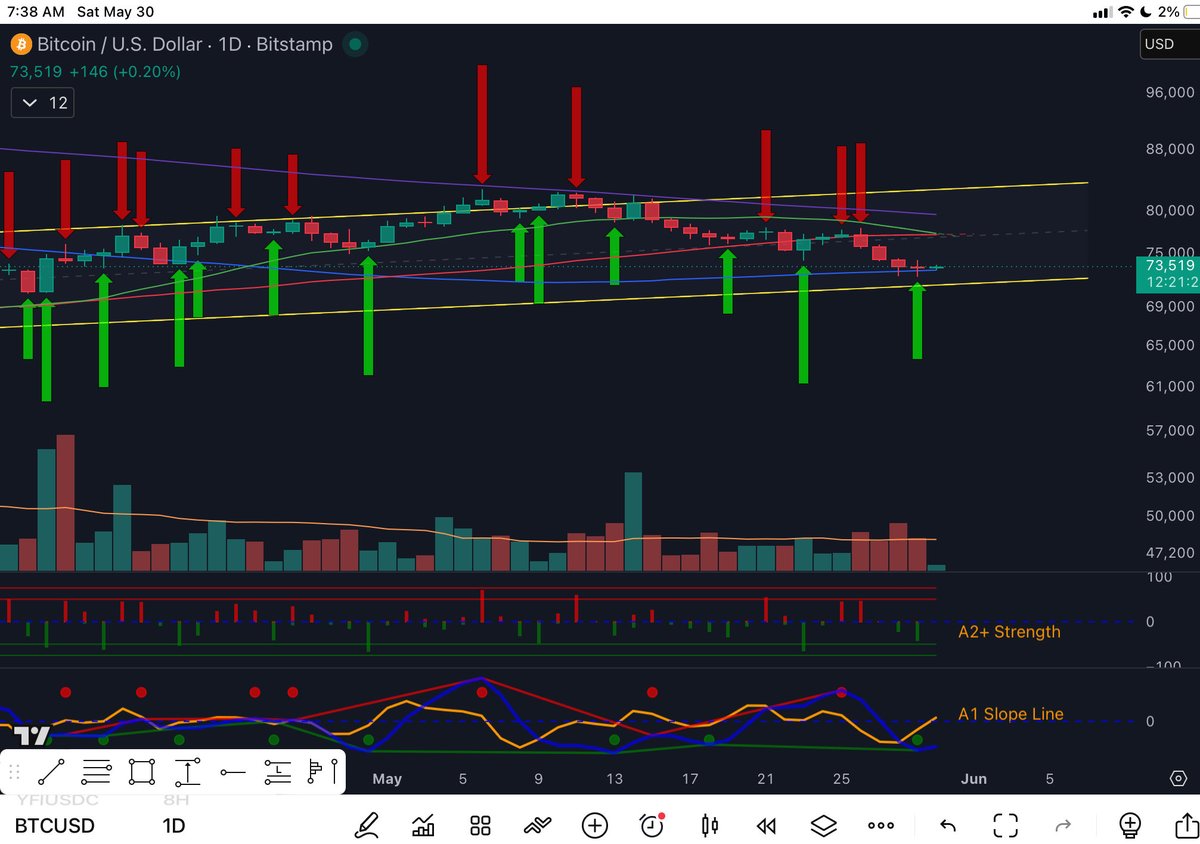
Both Trend Precognition Algos are signaling ⬆️ on the $BTC daily chart, but so far there’s only been enough volume to hold price above the 100 DMA, but not enough to move higher.
Patience prevails.
May 30

Bitcoin (BTC) Update 📊
There it is! 👀🔥
The Trend Precognition Indicator from @MI_Algos is now sending a potential trend reversal signal.
The signal is still relatively weak (37%), so I’m either looking for a second signal or for the strength of the current one to increase.
What makes this especially interesting is that all of this is happening right at the 100-day SMA 🟡
Almost textbook price action 📈
3
3
22
2,434