
Founder ZeroSynapse: real‑time exchange data, math & anomalies. Follow for what smart money is actually doing. NFA. DYOR.
Joined April 2019
- Tweets 496
- Following 110
- Followers 73
- Likes 328
343 Photos and videos
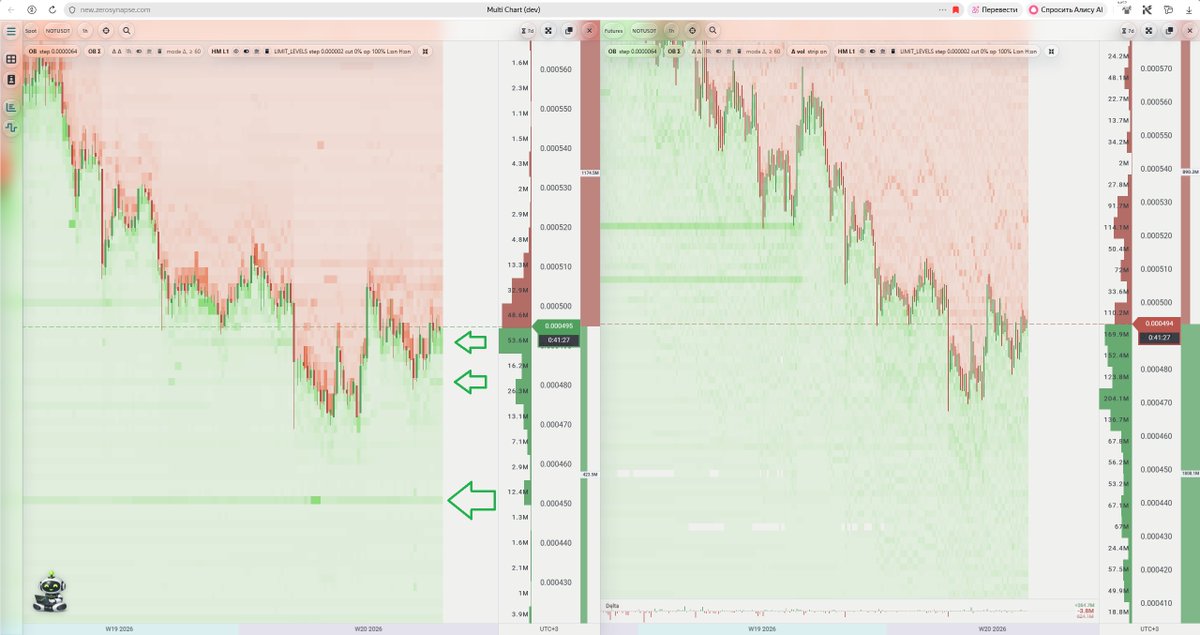


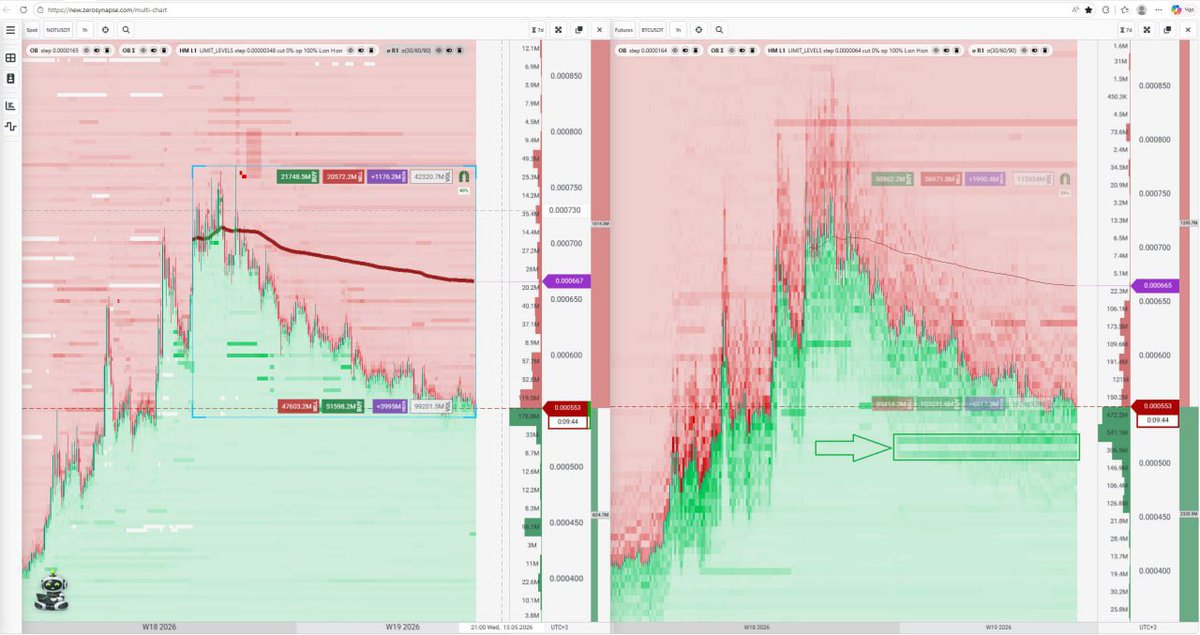


🪙 Heads up: spotting some interesting limit buyer activity on the spot order book for $NOTUSDT.
Bids aren't scattered randomly — there's methodical building happening. This isn't retail demand, it's someone with size preparing to absorb supply. The spot buyer just marked their zone of interest — now the question is whether sellers can push through it.
Watching closely. Our software picks up these moments instantly 👀
1
88
$BTC buyers tried to push price up, but the futures limit seller's manipulation could send price right back down to scoop up real spot liquidity at the level below.
Classic setup: the futures seller is pressing price lower to pick off bids where the actual spot buyer is sitting. This isn't chaos — it's mechanics. Liquidity grab first, then the reversal.
Our software highlights these levels. No guessing — just data 🧠
1
2
104
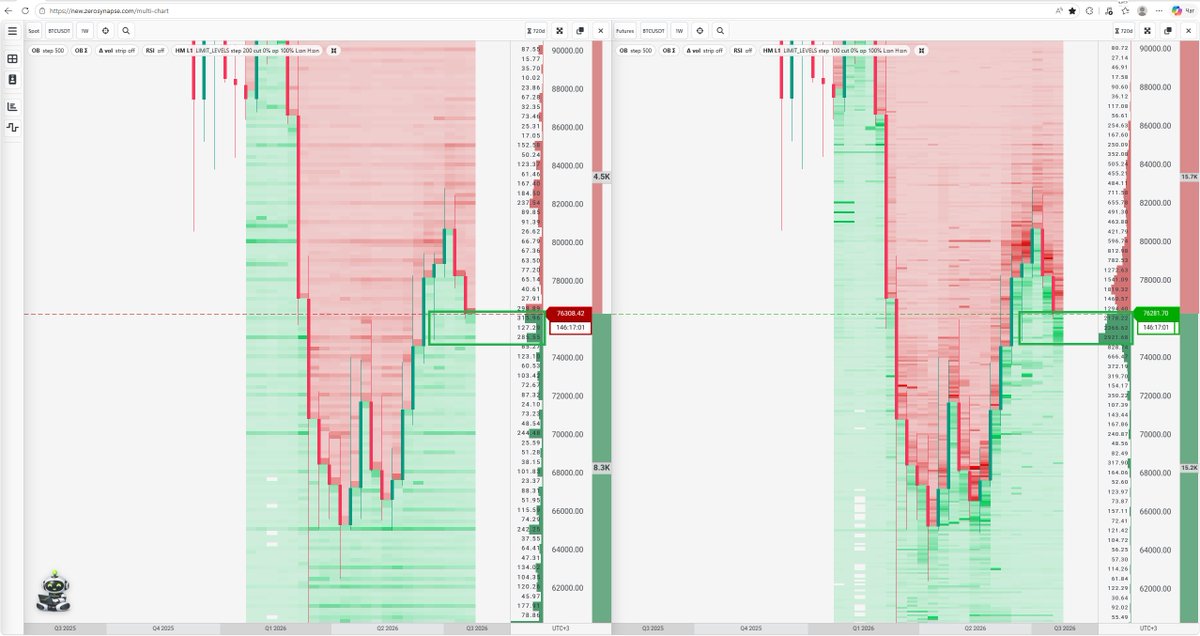
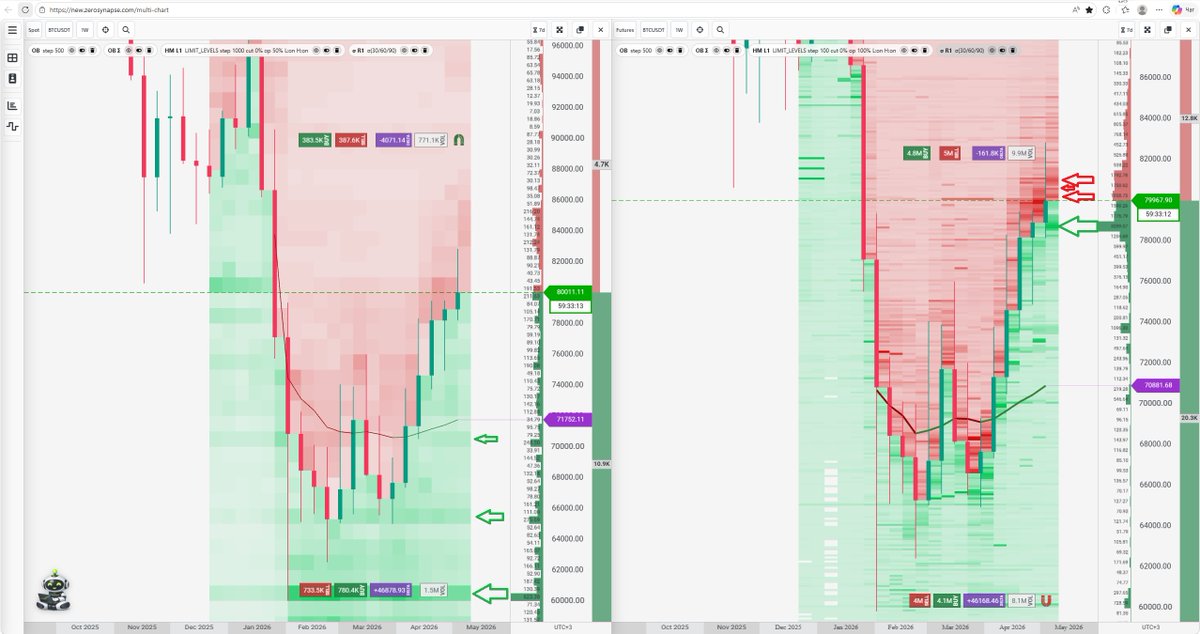
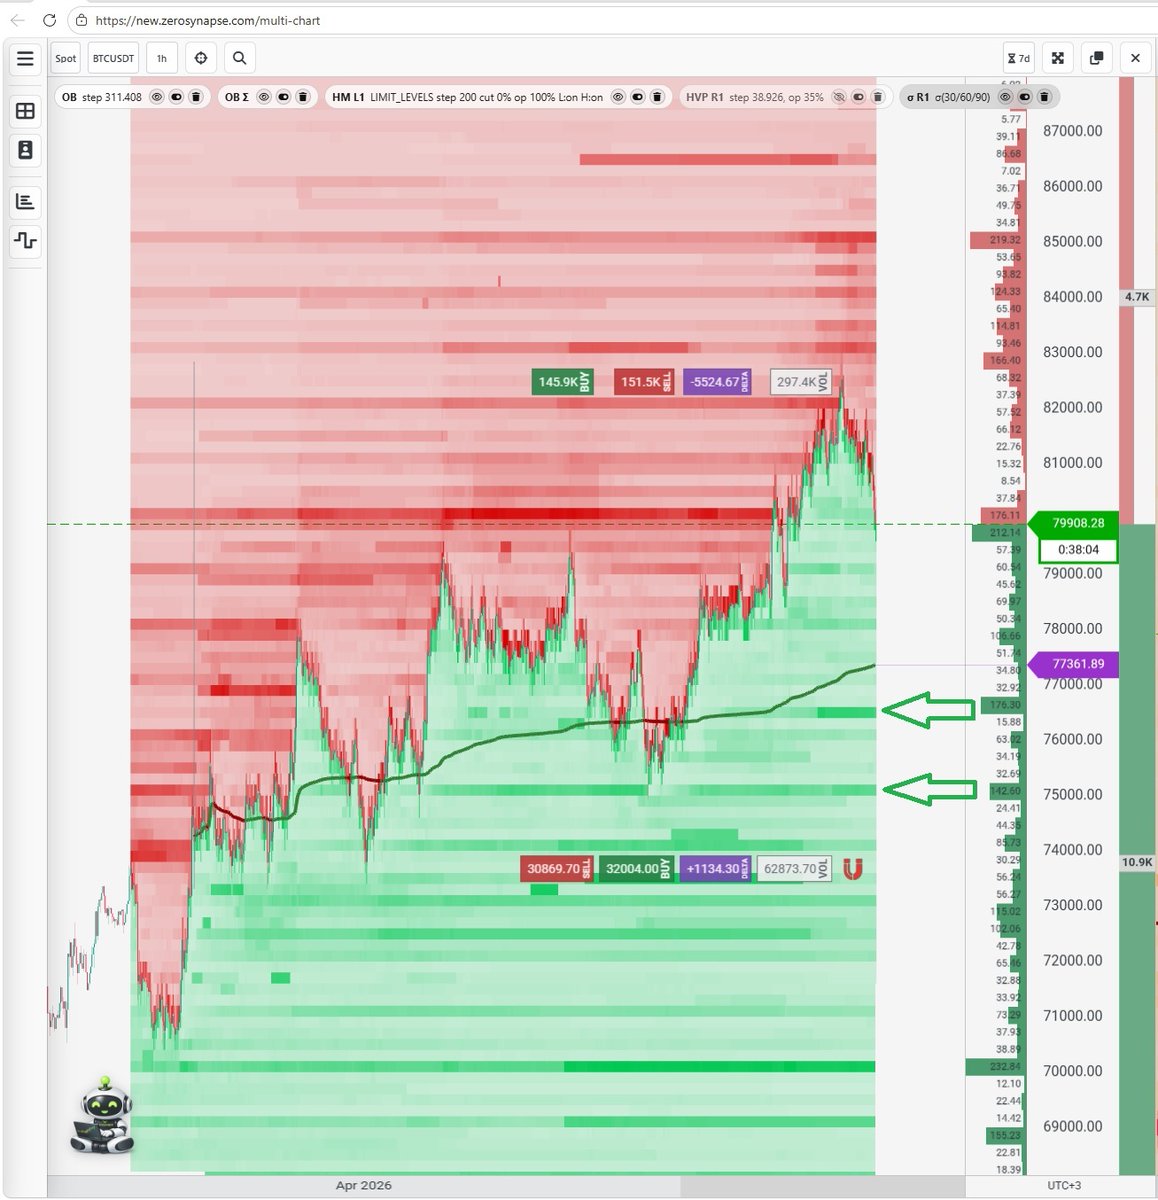
🚨Heads up: $BTC bears popped the champagne way too early 🍾👀
Price should react from the zone with real active liquidity – marked on the chart. And here's the key part: this is the zone where limit buyer interests on spot and futures line up at the same price level 🎯
When active bids stack in both books at the same time, that's not retail hopium – that's prep for coordinated absorption 🔥
Bounce from here or knife straight through? What's your read? 👀
3
208
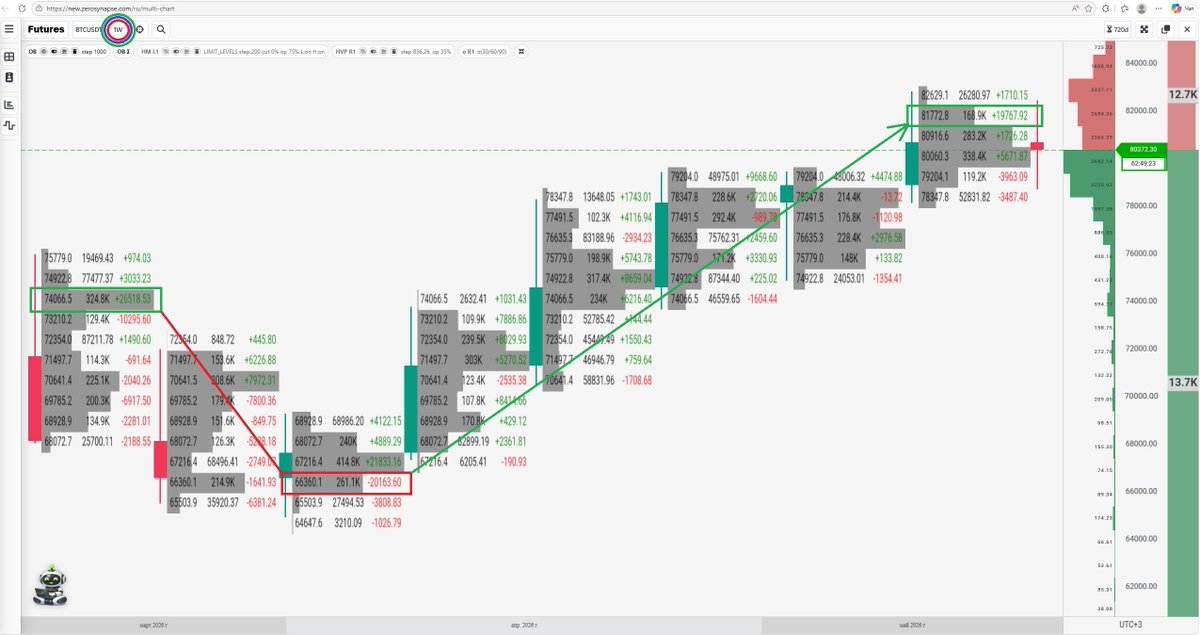
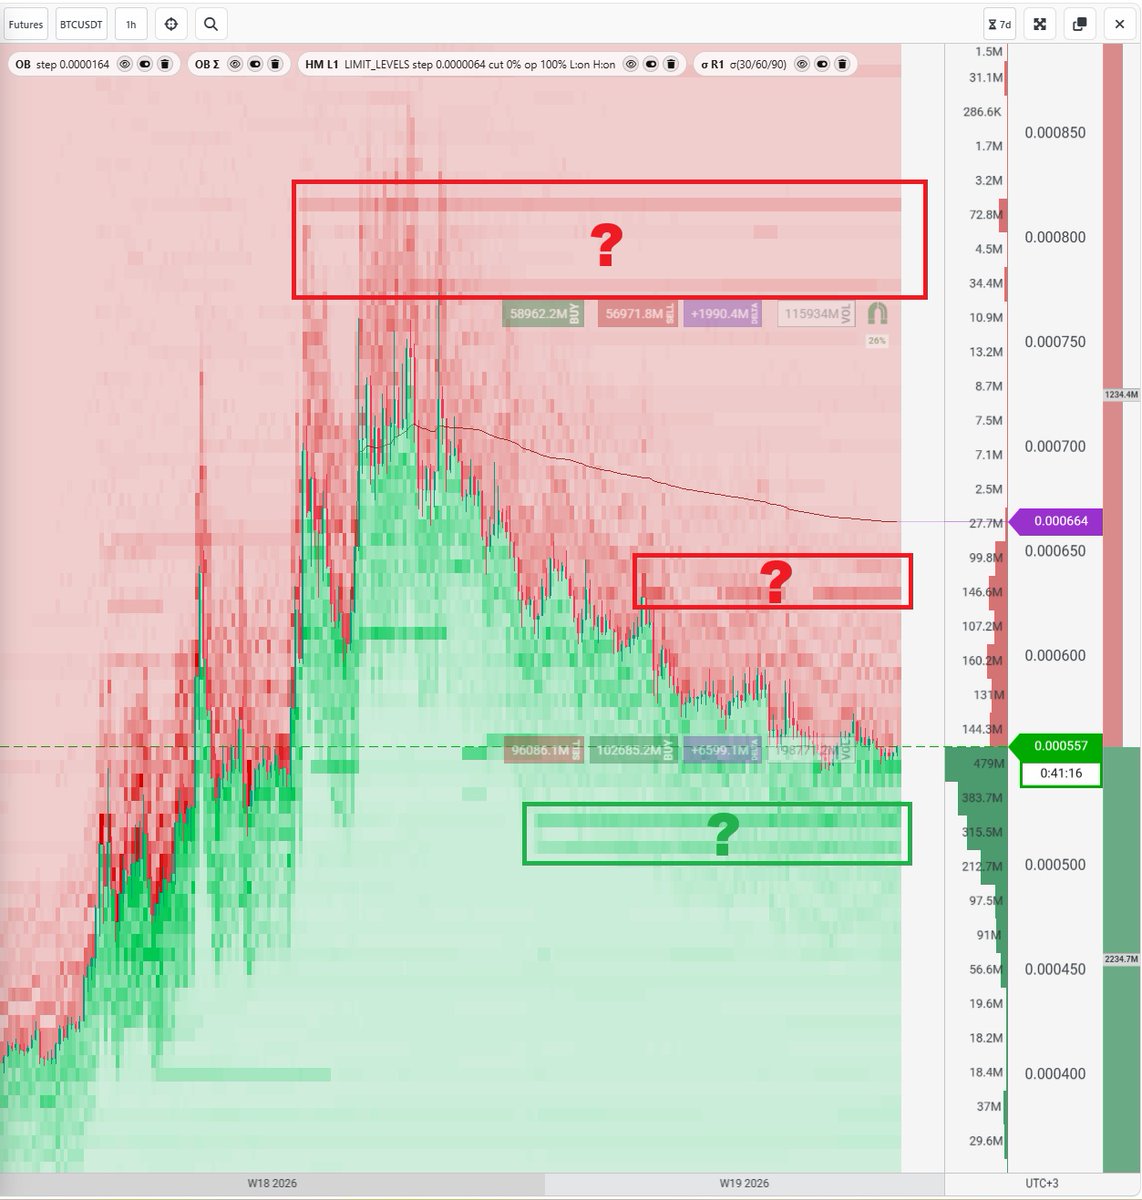
☠️ Attention $BTC traders ☠️
We've identified the deadly traps that wrecked futures traders on $BTCUSDT over the past 3 months. One might be forming right now.
The screenshot shows price clusters with abnormal volume and market order delta values — right after these spikes, price reversed and wiped out traders who got the direction wrong.
Our software spots these zones early — no magic, just pure order flow math. The ones who read the data don't walk into these traps.
Test version live here: new.zerosynapse.com/multi-ch…. Stay tuned — we're currently refining our trap detector 🧠
2
118
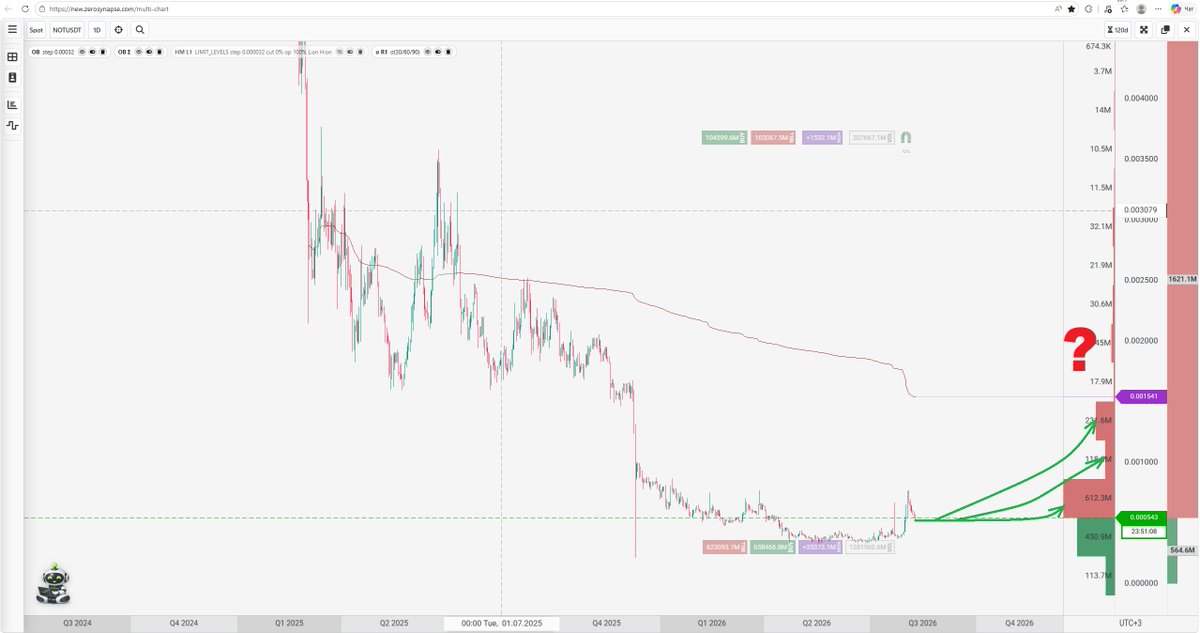
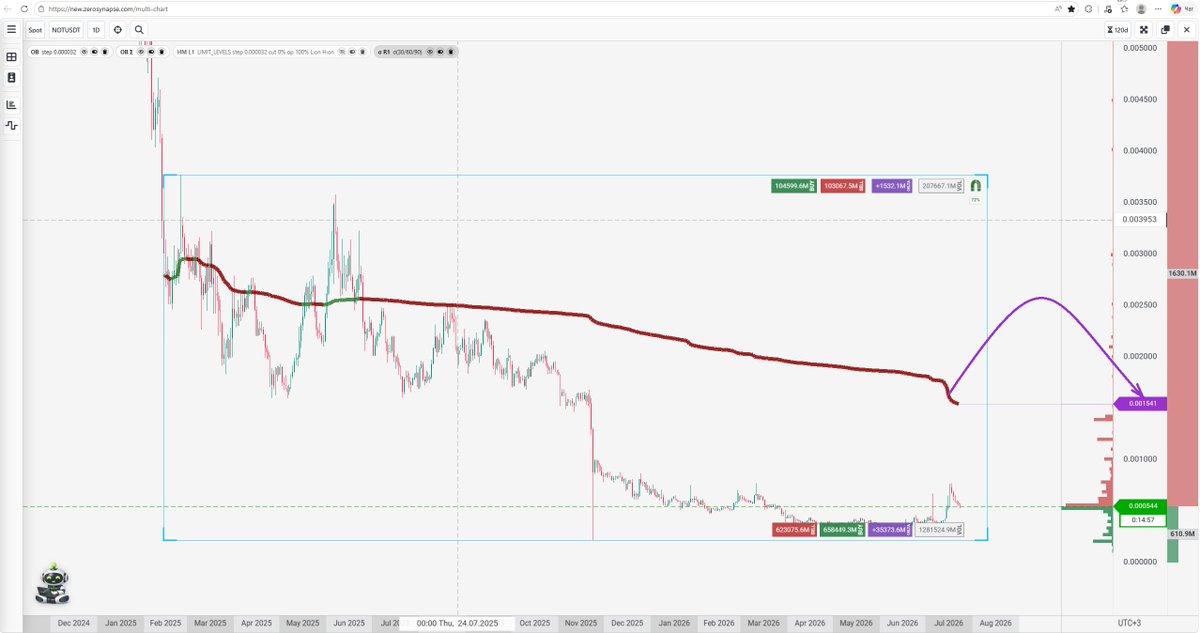
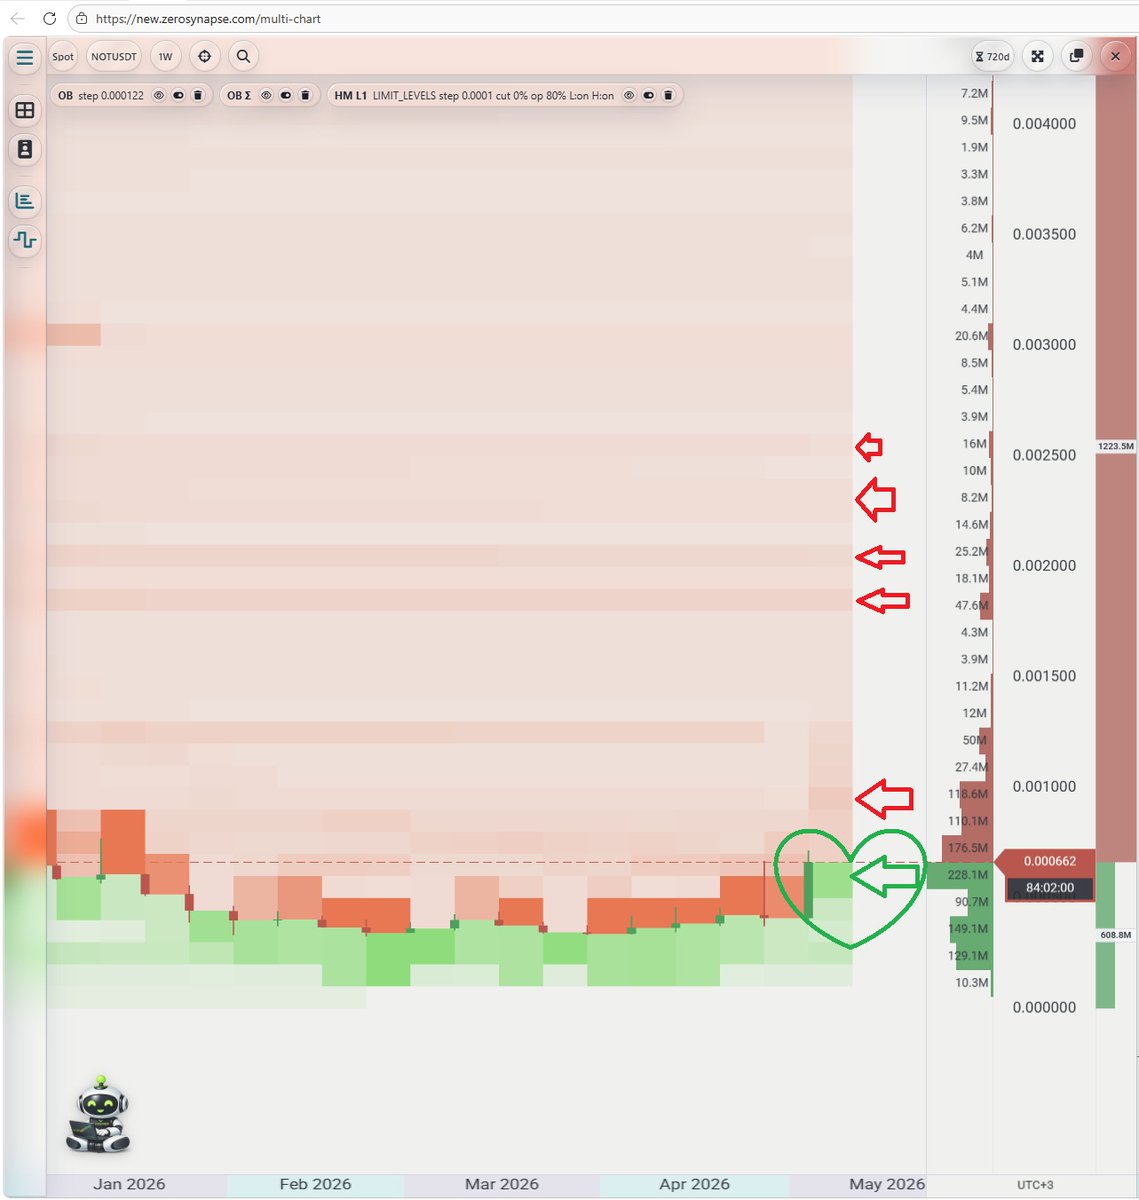
Market mechanics are simple — trades happen when market orders meet limit orders. Look at the screenshot: I've marked the buyer's market order flow with green arrows, chasing seller's limit orders. What you'll notice? There's almost no sell-side liquidity above the VWAP from the past ~1.7 years.
This means whoever's managing liquidity on this coin is gonna have a hard time distributing volume above that level. My take: price bounces off VWAP and stays below it until market participants refill the order book with fresh liquidity.
So I'm expecting an impulsive move toward ~$0.00154 in the near term. 👀

To find the mathematical boundary between seller and buyer, let's calculate the VWAP of all traded volume over the selected period. You can see this boundary on the screenshot. It sits at ~0.00154 — that's the breakeven point for most buyers who've been accumulating this coin over the past ~1.7 years.
Buyers are gonna try to pull price toward this level. But there's one small catch — more on that in the next post…
4
171
To find the mathematical boundary between seller and buyer, let's calculate the VWAP of all traded volume over the selected period. You can see this boundary on the screenshot. It sits at ~0.00154 — that's the breakeven point for most buyers who've been accumulating this coin over the past ~1.7 years.
Buyers are gonna try to pull price toward this level. But there's one small catch — more on that in the next post…
Amin, my bad for not seeing your question right away. Wasn't on purpose, I promise — was deep in preparing the upcoming feature drop for our trading app. To answer you, I'm gonna rely strictly on hard math we run against real exchange data flow.
Makes sense to start with the higher timeframes on $NOTUSDT — let's take the 1D from January 2025 to now. I've marked two zones on the screenshot that got traded through during this period. The upper zone turned out too expensive for buyers, so price dropped a floor lower. This gives us a reasonable assumption: the upper zone belongs to the seller, the lower one to the buyer.
Main takeaway from this chart: price will likely attempt to leave the buyer's zone in order to distribute accumulated volume up in the seller's territory.
2
264
‼️ Been meaning to ask: if our app so clearly exposes algorithmic activity in the order book, maybe I should stop calling bots by the fancy name "smart money"?
Looking at the heatmap now, there's less and less doubt. This definitely isn't a human placing an endless stream of limit orders — it's code. A cold, emotionless algorithm methodically reloading orders while the crowd tries to guess market sentiment.
Our software highlights these footprints — and suddenly "smart money" starts looking an awful lot like a repeating pattern. No magic. Just machines playing by programmed logic.
🧠 What do you think — more honest to call it a bot? Or stick with "smart money"?
1
2
97
Just as surprised as you are 🚨
Big limit players just showed up on $NOTUSDT futures – and they're not letting price slip to the bottom 👀
Heavy bids stacking right under current price. Someone clearly doesn't want $NOT going lower. Whether it's a real defense or a setup for a sweep, time will tell 🎯
But the order book doesn't lie – this kind of footprint doesn't appear by accident
8
18,413
Heads up traders $BTC 🚨
Big money has zero illusions here. They're completely absent as buyers at current spot prices – not a single real bid on the spot book 👀
But on $BTCUSDT futures? Fully active. Pushing, layering, playing with price like it's their playground 🎯
You can see the whole buyer/seller liquidity dance on our order book heatmap – spot empty below, futures is where the game's at.
Spot tells the truth. Futures shows the intent.
1
145
Heads up traders – manipulation in play 🚨
The $BTC limit seller's algos just showed their hand. Anomalous behavior in the order book right off the $83K level . Classic algo footprint, not organic supply. This isn't a trader selling. This is a machine defending a level.

1
18,373
Raw order book data looks like chaos until you know how to read it. Heatmaps turn that chaos into a visual footprint you can actually work with. You stop chasing price and start seeing intent.
No guesswork. No squinting at the DOM. Just the real picture, as it's happening.
Be honest — we built a pretty damn good tool, didn't we? 🧠
73
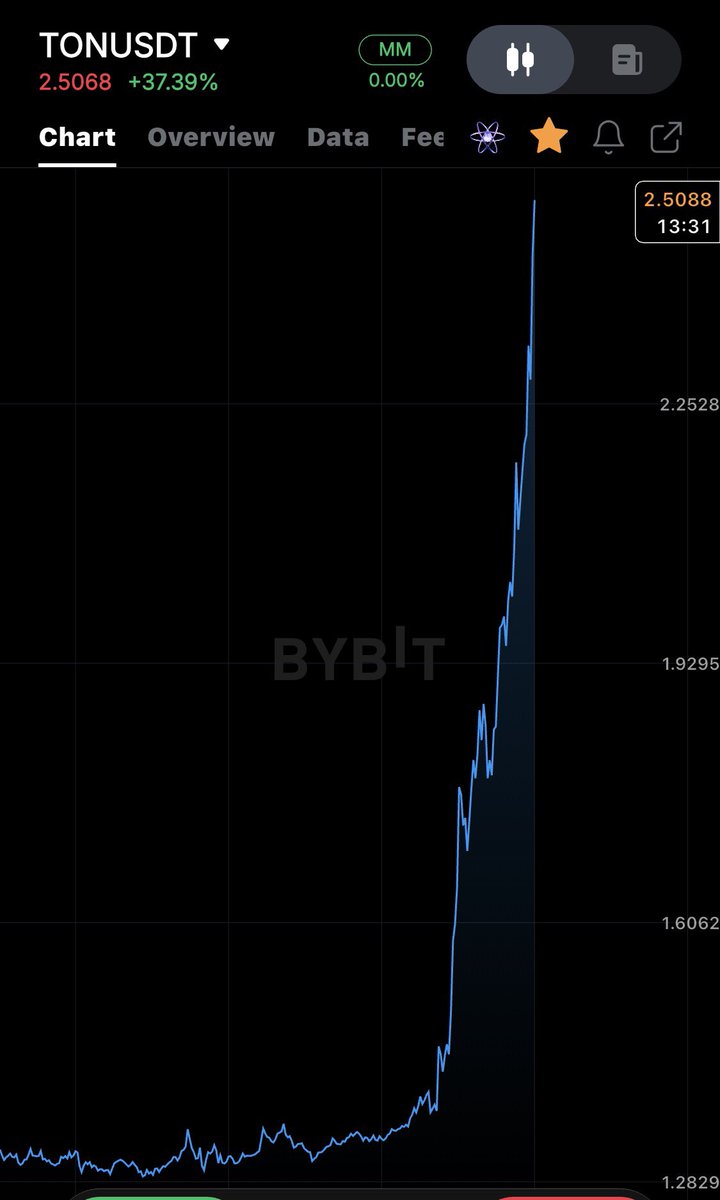
⚡️ Pavel Durov just dropped a comparison of L1 blockchains by finalization time. Guess who's #1?
$TON — ~0.6 seconds. That includes waiting for the next masterchain block plus confirmation. Total time including the first shardchain block is under 1 second. Insane.
For reference:
🔸 Avalanche — ~1 sec
🔸 BNB Smart Chain — ~1.125 sec
🔸 SUI — a few seconds
🔸 Hedera — 2–3 sec
🔸 Solana — ~32-slot lag
🔸 Ethereum — two epochs, that's minutes
🔸 Bitcoin — around an hour
While the crowd's busy chasing meme coins, we're looking at fundamental metrics. TON is technically faster than almost every competitor in the CoinMarketCap top-30. This isn't hype — it's an engineering fact that'll eventually get priced in.
I don't parrot news. I look at real data — through our tools. The same software that highlights liquidity and manipulation in the order book 👀
Follow me — we analyze the market without illusions 🧠
76
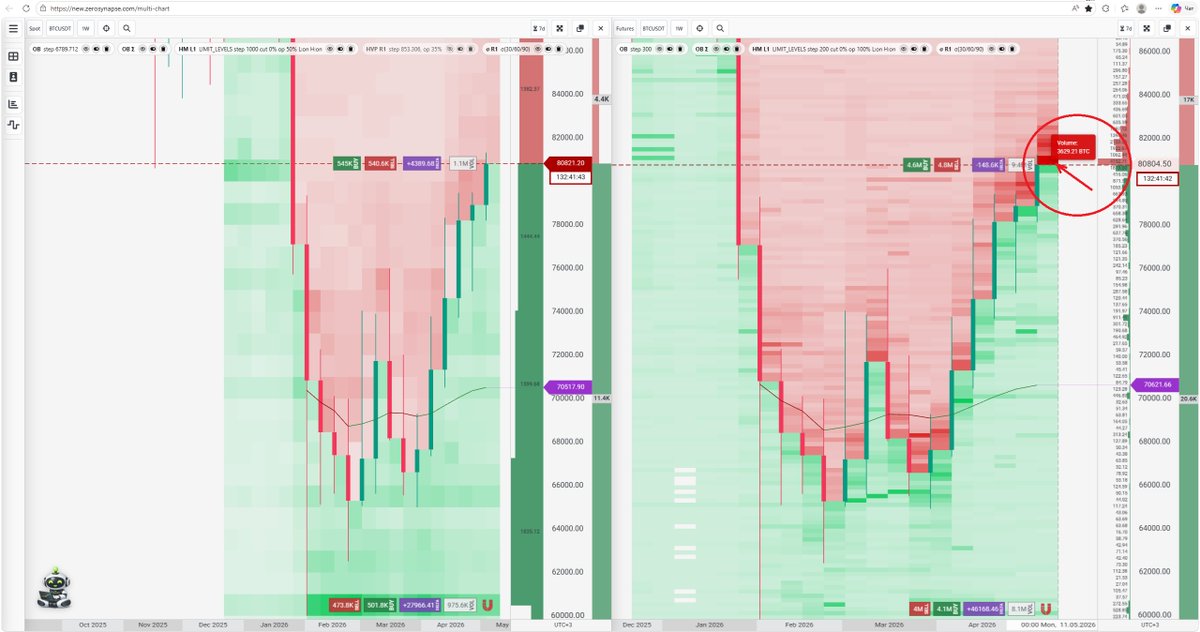
🚨 Heads up: we're seeing clear manipulation by a $BTC limit seller on the 1h timeframe!
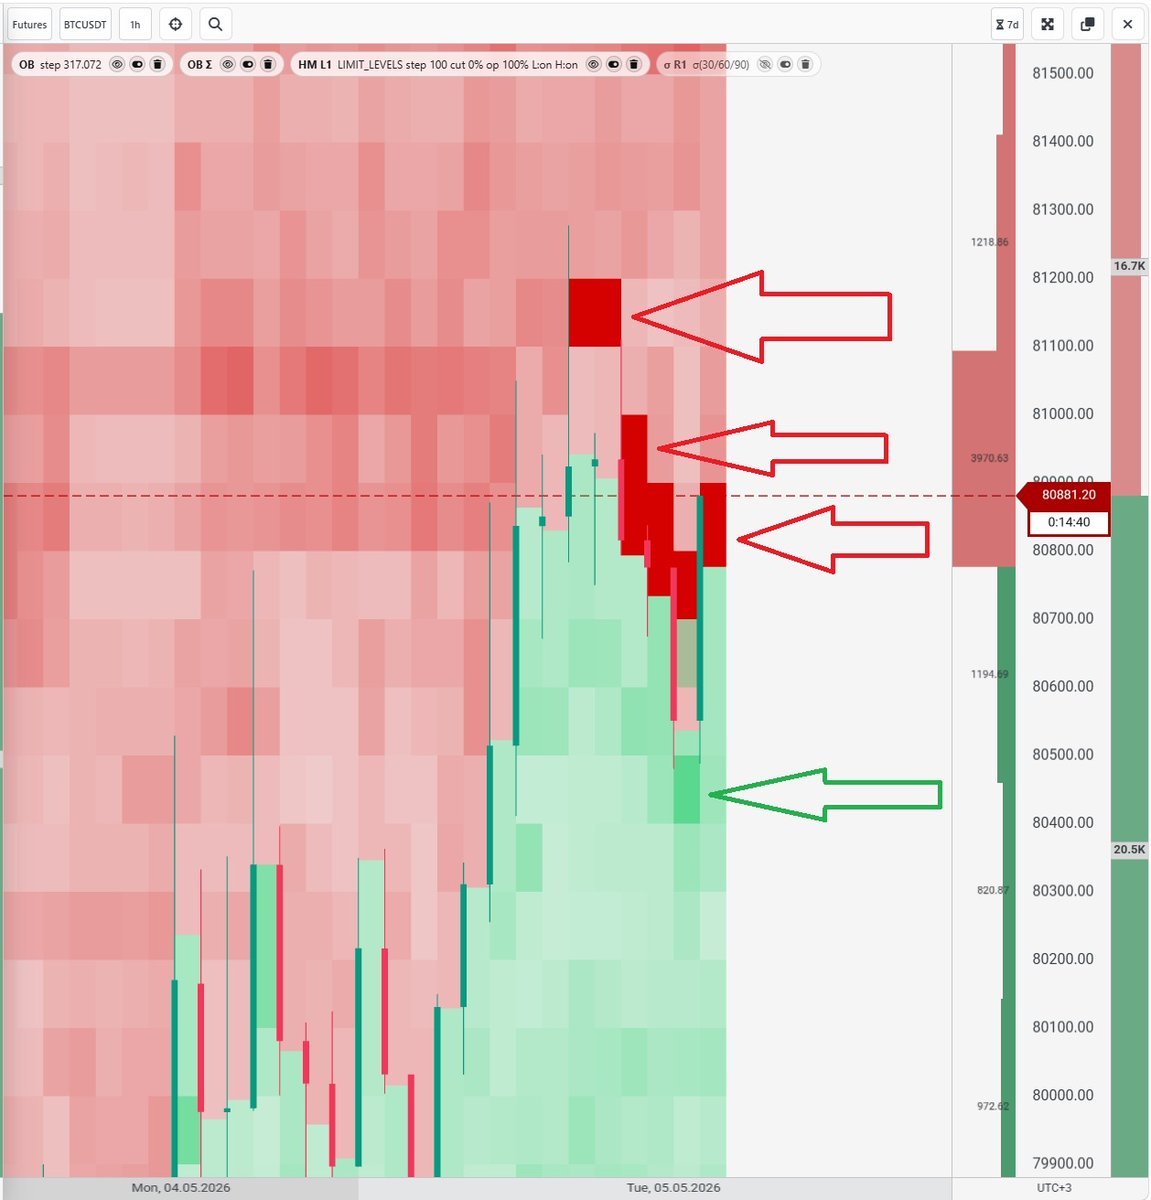
$BTC under heavy manipulation right now.
Want to see what’s actually happening in the order book? Just look at this heatmap.
Massive seller wall sitting at $80,800 — it was chilling at $81,130 earlier, and this guy just dragged it lower. Market buyers keep smashing straight into it, but he reloads the orders every single time. Like a bouncer at the club who won’t let you through no matter how hard you push.
This ain’t random. Big player is deliberately capping the price to scare the weak hands — setting up a classic shakeout and a nice manipulative dip.
Retail sees BTC stalling and panics, dumping their bags. Then the wall magically disappears and price rips higher… but they’re already out.
Classic trap: jumping in right in the middle of the buyer-seller war zone. Smart money loaded way earlier. They’re just taking partial profits and chilling, waiting for the next move.
We don’t chase news narratives or random predictions. We read real liquidity flow through our exchange data application. That screenshot you’re looking at? Straight from the tool we built. No magic — just the raw tape.
🥰Follow for what smart money is actually doing in real time. You loading the dip… or getting shaken out?
1
3
305
$BTC under heavy manipulation right now.
Want to see what’s actually happening in the order book? Just look at this heatmap.
Massive seller wall sitting at $80,800 — it was chilling at $81,130 earlier, and this guy just dragged it lower. Market buyers keep smashing straight into it, but he reloads the orders every single time. Like a bouncer at the club who won’t let you through no matter how hard you push.
This ain’t random. Big player is deliberately capping the price to scare the weak hands — setting up a classic shakeout and a nice manipulative dip.
Retail sees BTC stalling and panics, dumping their bags. Then the wall magically disappears and price rips higher… but they’re already out.
Classic trap: jumping in right in the middle of the buyer-seller war zone. Smart money loaded way earlier. They’re just taking partial profits and chilling, waiting for the next move.
We don’t chase news narratives or random predictions. We read real liquidity flow through our exchange data application. That screenshot you’re looking at? Straight from the tool we built. No magic — just the raw tape.
🥰Follow for what smart money is actually doing in real time. You loading the dip… or getting shaken out?
11
6
34,429