
X-Ray Analysis of Markets, Minds & Power | Uncovering Hidden Forces | Knowledge = Power = Capital
Joined July 2023
- Tweets 1,028
- Following 182
- Followers 313
- Likes 265
220 Photos and videos


Jun 15
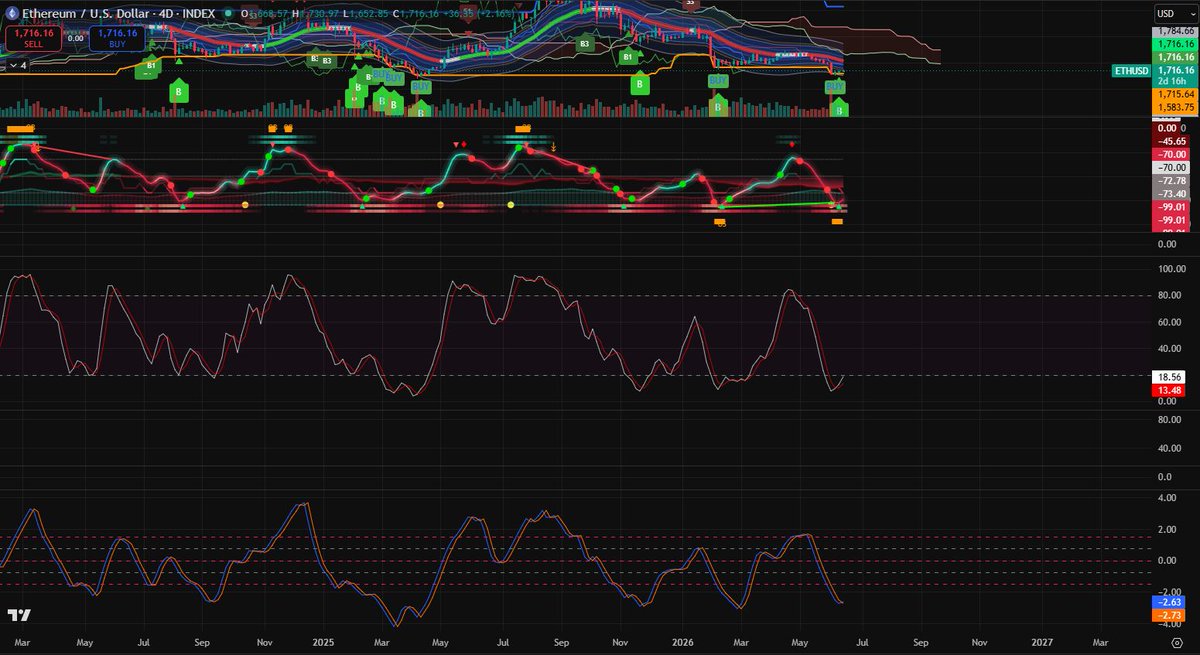
I see something you don't, and that's a bullish divergence on the ETH/USD 4-day chart.
The green line on the first oscillator indicates the bullish divergence from early February 2026 to early June 2026 - a relatively long period and so far, everything remains intact
It's strange, because last week we were in the grip of extreme fear.
As a top investor, you didn't sell your ETH, did you?
Follow @AEON_Analytics
17
Jun 15
Don't you think it's really funny that for the past week you've been looking at the same funny memes showing stressed-out or desperate people, or crypto prices from 6 years ago and today, accompanied by pointless comments like "6 years wasted on crypto" and the like?
So if I can make you panic that easily, then I’m sorry. Plus, there’s a level of fear in the market we haven’t seen in a long time.
AND HEADS UP.
Yes, you can earn capital gains in your preferred currency through cryptocurrencies just as others might earn in 10 years through their jobs.
But there’s a problem:
Finding the information that will help you build a life of financial freedom is becoming harder to come by, because that information is the real gold. Information is everything, especially in a world where you’re constantly inundated with it.
Follow @AEON_Analytics
24
All I see in Crypto X is nothing but destructive posts.
The market is about to deal you the final blow, and in your desperation, you’ll dump everything onto the market.
Take a deep breath and come sit on my Crypto Couch
I analyze cryptos that look strong against BTC.
And one more thing: Accept that dear old Bitcoin has run out of steam.
It’s slowly time for other cryptos to knock the dying king off his throne.
It'll take a little while longer, but it'll happen
Bitcoin = Myspace.
Follow @AEON_Analytics
1
42
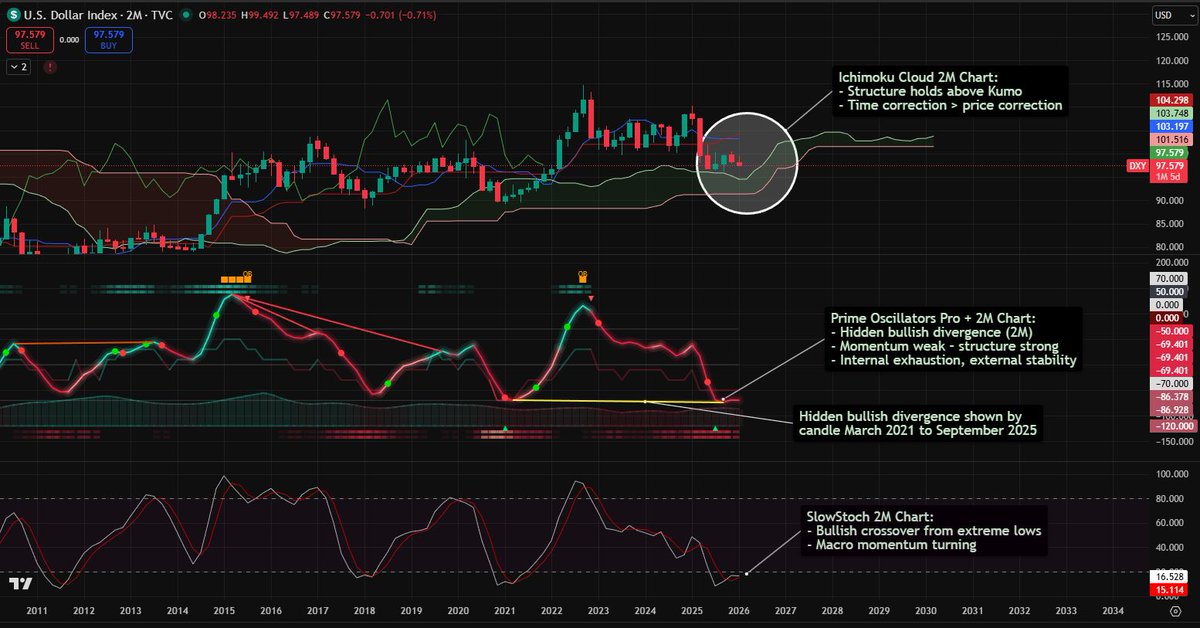
Of course, you had stocked up on dollars because you recognized the hidden bullish divergence on the 2-month chart from March 2021 to September 2025.
Thanks a lot for the fact that hardly anyone was interested in the analysis in January 2026.
Follow @AEON_Analytics
Jan 23

Everyone is talking about a weak USD.
But the DXY 2M chart tells a very different story.
• Price holds structure above the Ichimoku cloud
• Hidden bullish divergence on momentum
• Slow Stoch turns up from extreme lows
This is not distribution.
This is structural dollar strength being ignored.
When the USD moves next, it won’t be slow.
Follow @AEON_Analytics
32
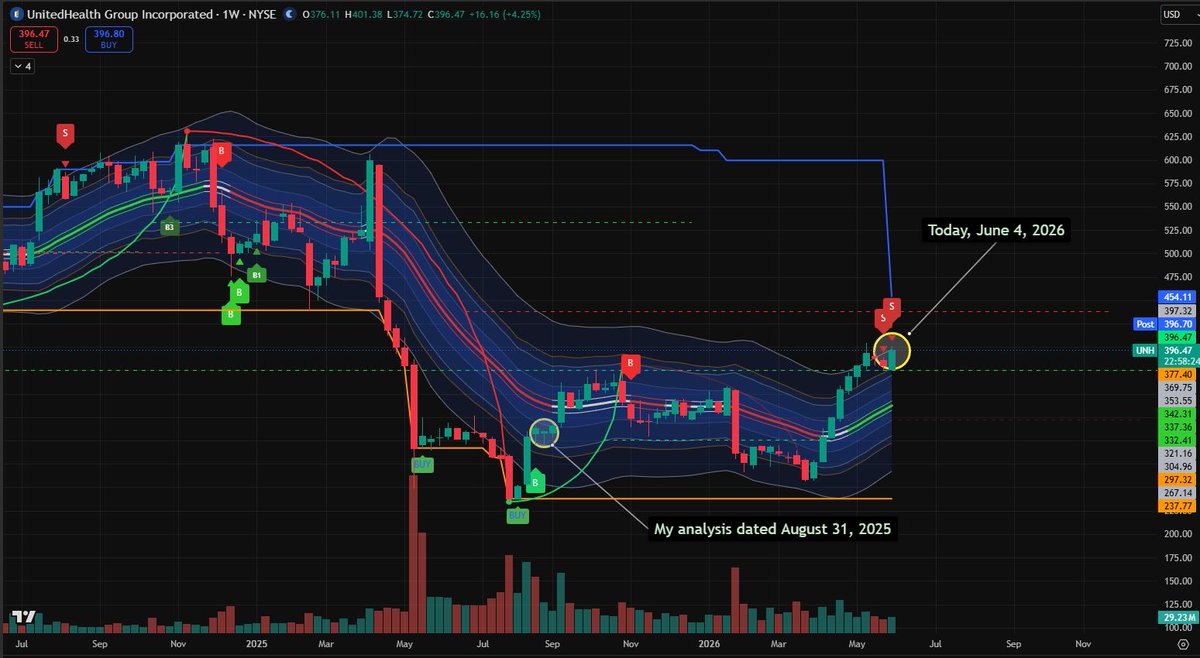
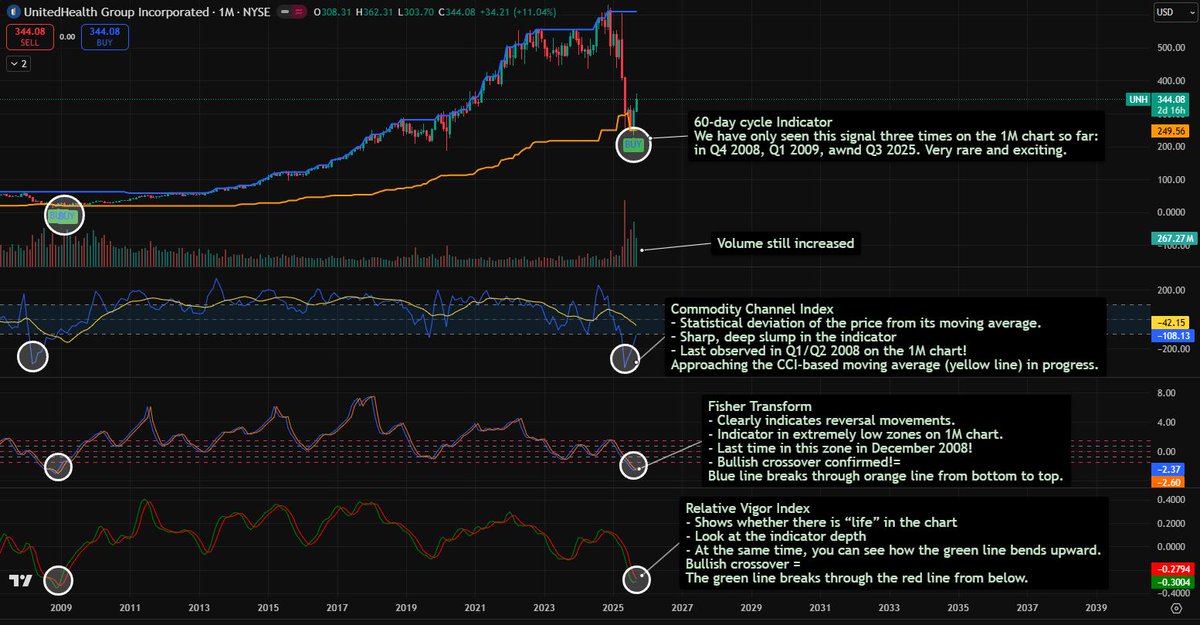
I shared this analysis of UHN United Health Group with you on August 31, 2025.
In it, I mentioned that Warren Buffett’s Berkshire Hathaway had recently made a significant purchase of this stock.
Take a look at the current stock price.
UHN consolidated strongly again on the weekly chart but is trading significantly higher.
My working hypothesis in last year’s analysis was that the stock was experiencing a moment of capitulation on higher time frames.
Follow @AEON_Analytics
31 Aug 2025
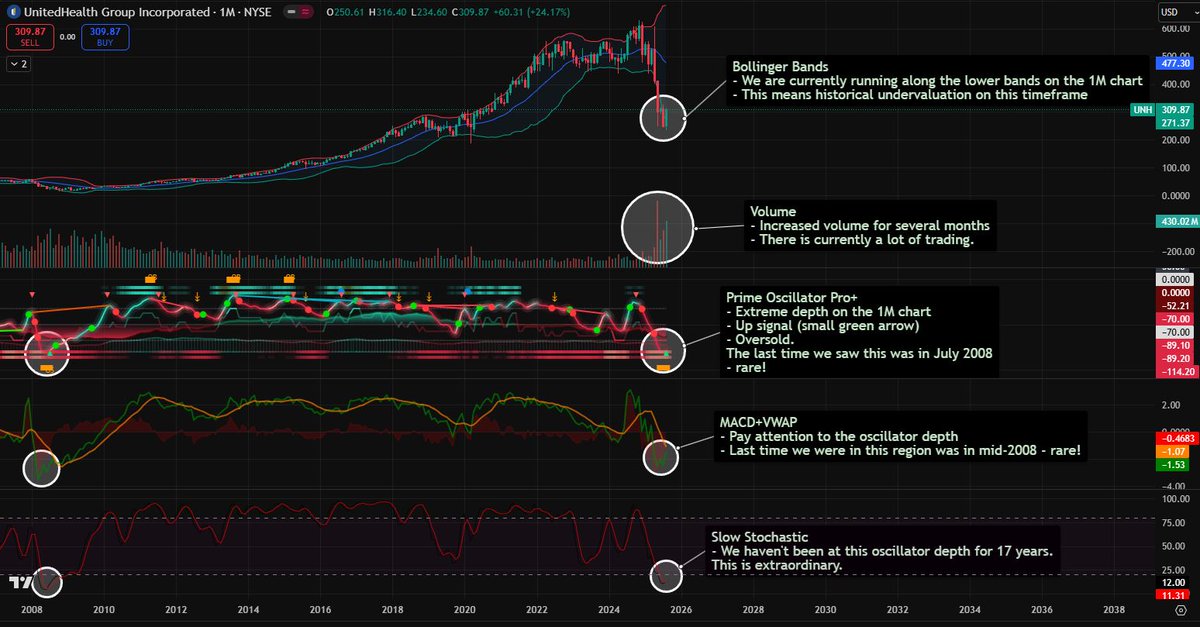
Stock Analysis 📊 | Warren Buffett bets on UNH (UnitedHealth Group)
What’s behind it? A short-term play… or something much bigger most people don’t see?
On the 1M chart (each candle = 1 month), oscillator lows haven’t been this extreme in 17 years.
And now Buffett steps in. 👀
I applied:
Bollinger Bands
Volume
Prime Oscillator Pro
MACD VWAP
Slow Stochastic
👉 Result: Extremely oversold signals early signs of reversal.
👉 Rare setup – historically a turning point zone.
Health may be the next mega-theme. Don’t ignore this move.
Follow @QNR_Oracle for deep market signals.

1
78
I made this analysis public on X on August 25, 2025.
Few people wanted to know the truth because the sky-high BTC prices made everyone feel so good.
The truth lay in the numbers, but they usually ruin that good feeling, which is why there was so much resistance even though the data was clear.
Follow @AEON_Analytics
30 Aug 2025
🚨 BTCUSD 8D Chart – Strange Divergences & Signs of a Bearish Trend Beginning
1️⃣ Tangente Move – From the Aug 4, 2024 candle to Aug 13, 2025 → signals the end of the uptrend. Almost exactly 1 year. Key support sits around $86,400 – if we lose this level, it get brutal.
2️⃣ Prime Oscillator Pro – Clear bearish divergence. Higher oscillator in Nov 2024 vs. lower oscillator in July 2025 → on the 8D, this is a very strong warning.
3️⃣ MACD VWAP with Laguerre Smoothing – I’ve smoothed the oscillator for less lag. We already have a bearish crossover on 8D. Rare, and usually followed by weeks of consolidation.
4️⃣ Slow Stochastic – Broke down through 80 from above and continues falling. Confirms the other signals.
-> Summary: Recently on X you’ve seen endless ultra-bullish posts:
“BTC to $1M soon”
“BlackRock says $700k BTC”
An influencer claiming $1.3M in XRP, predicting $10 XRP soon
->Be careful – this kind of sentiment is a red flag. Remember: in April 2025 when BTC was much lower, no one told you to buy. And in 2022 no influencer or OF model bragged about $1.3M in XRP.
👉 Look at my chart: bearish crossovers, divergences, falling oscillators, and exhausted trends. Expect multi-week consolidation ahead.
Follow @QNR_Oracle for signals without the hype.

27
I'll finish the charts later.
May 29
Missed the move in Stellar ($XLM)?
Then I'd be watching $XRP and $HBAR very closely right now.
Something is brewing.
Explosion soon. 👀
Follow @AEON_Analytics
28
Haha, I wrote this analysis on September 25, 2025 that was when the Crypto X community laughed it off, saying, “That can’t possibly be true because it doesn’t feel right.”
How does it feel now?
Not to mention that even an OnlyFans podcast mentioned that the protagonist had stocked up on XRP.
When are you going to stop losing?
Follow @AEON_Analytics
1 Sep 2025
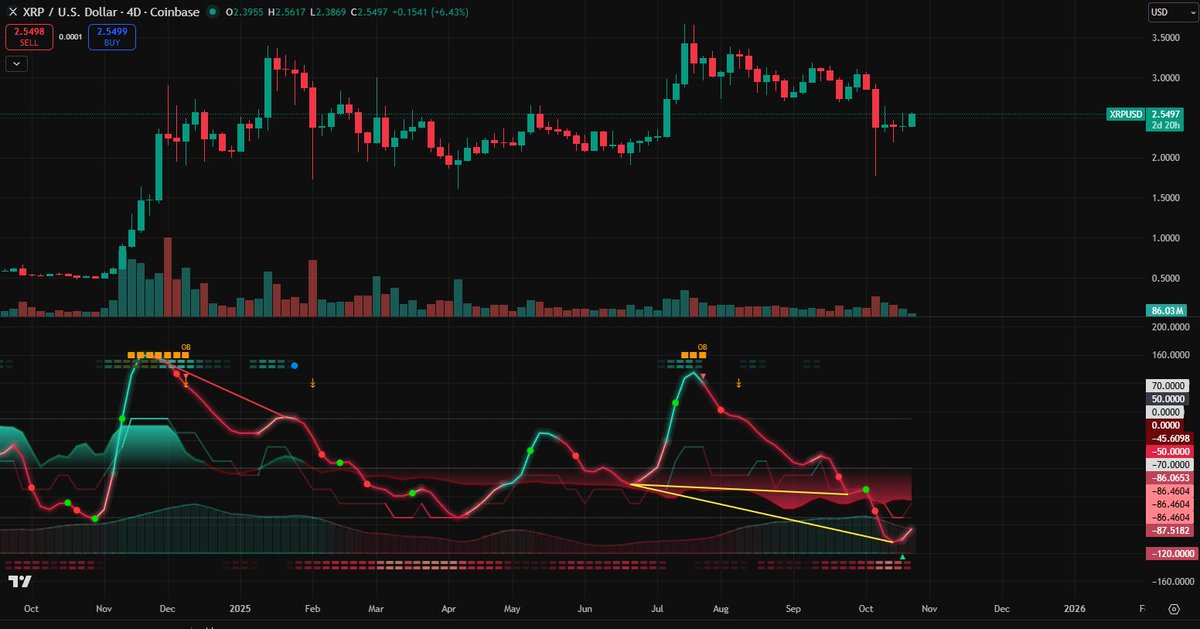
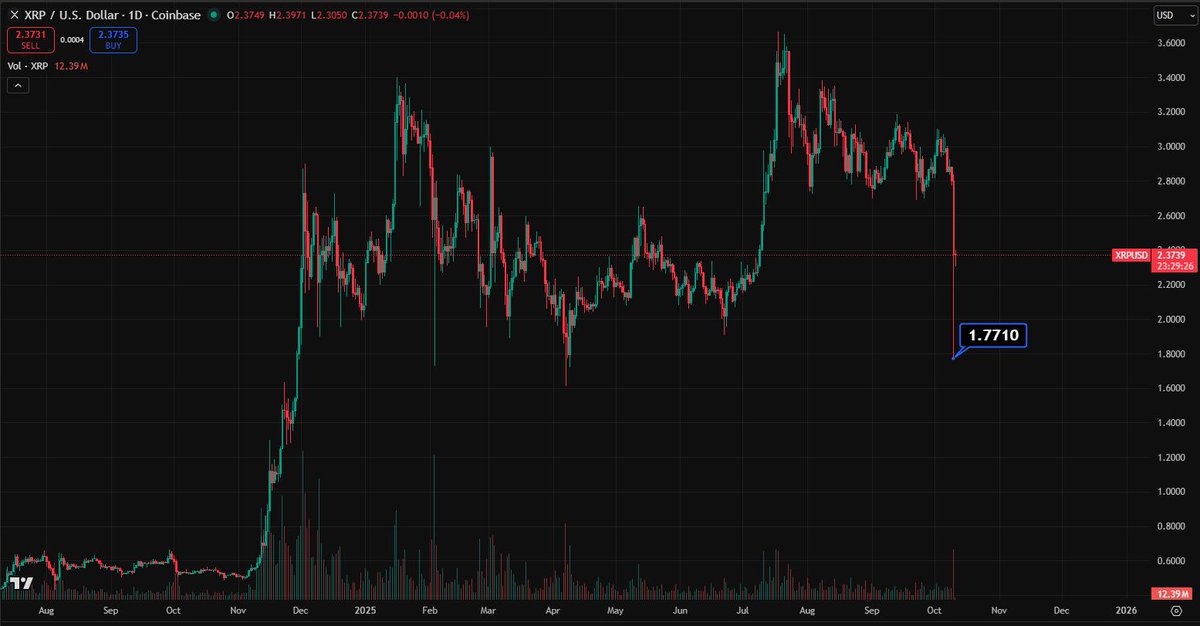
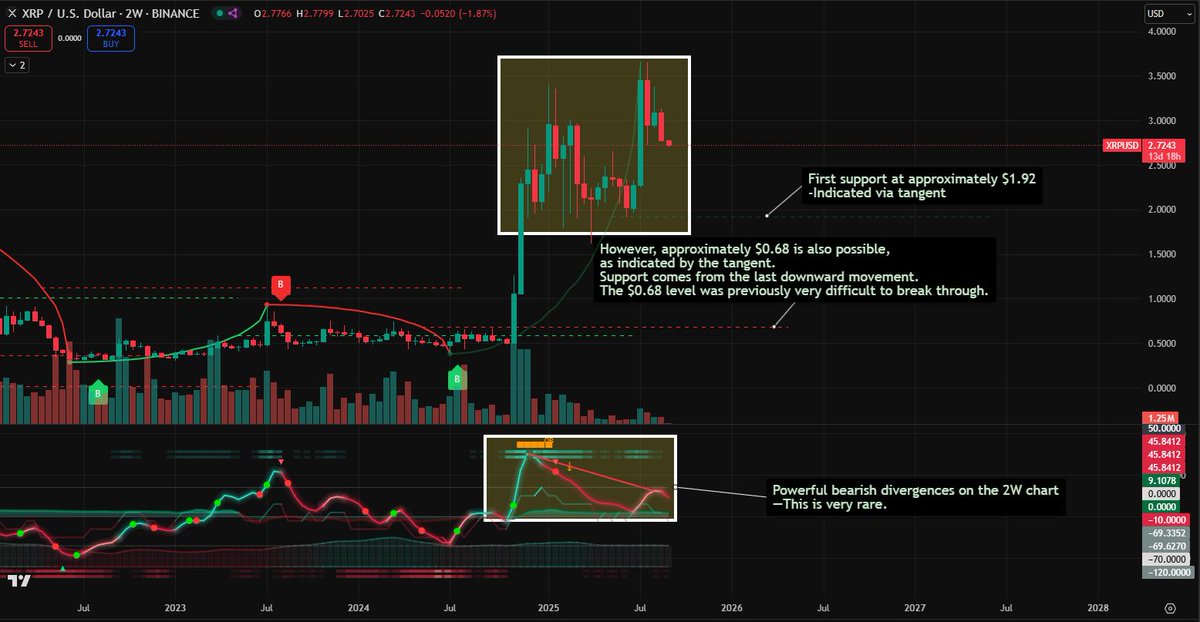
XRP/USD – 2W Chart
Strong bearish divergence on the 2-week chart.
At the same time, two strong support zones are in focus:
1️⃣ Around $1.92
2️⃣ Around $0.68
Drops of 80% from cycle highs are common in mid-term crypto trends.
Don't get caught off guard.
Follow @QNR_Oracle for deep-cycle insights.
56
May 29
Missed the move in Stellar ($XLM)?
Then I'd be watching $XRP and $HBAR very closely right now.
Something is brewing.
Explosion soon. 👀
Follow @AEON_Analytics
140
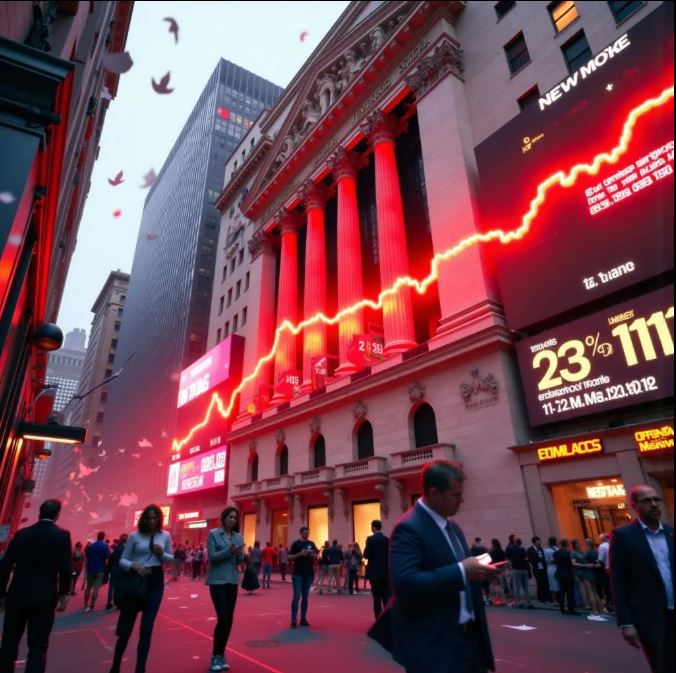
My next two posts on Zora. I think it's all pretty self-explanatory. I hope you haven't bought into the US stock market at its peak, right?
zora.co/coin/base:0x67b9fffd…
zora.co/coin/base:0x78168a21…
206
Feb 21
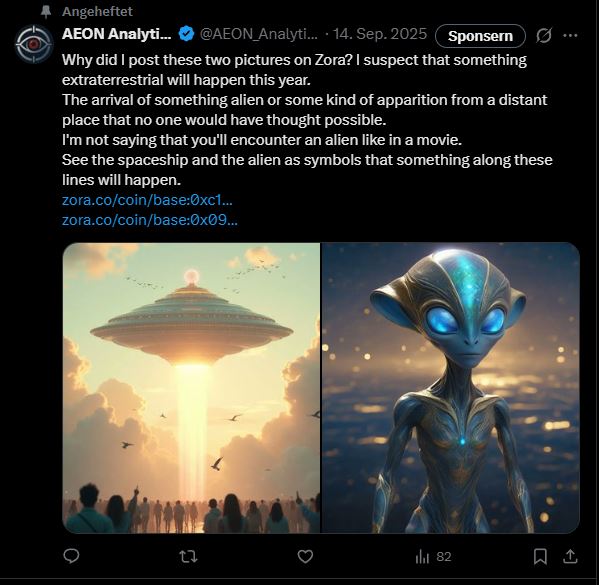
My post on ZORA is from about 7 months ago. My post on X is from September 25, 2025. However, I thought it would happen in 2025.
Feb 20

"Based on the tremendous interest shown, I will be directing the Secretary of War, and other relevant Departments and Agencies, to begin the process of identifying and releasing Government files related to alien and extraterrestrial life, unidentified aerial phenomena (UAP), and unidentified flying objects (UFOs)..." - President Donald J. Trump

215
Jan 23
Everyone is talking about a weak USD.
But the DXY 2M chart tells a very different story.
• Price holds structure above the Ichimoku cloud
• Hidden bullish divergence on momentum
• Slow Stoch turns up from extreme lows
This is not distribution.
This is structural dollar strength being ignored.
When the USD moves next, it won’t be slow.
Follow @AEON_Analytics
1
213
6 Dec 2025
While you are still following major entertaining channels that consistently provide you with a different narrative depending on the market situation. -> On November 21, 2025 <-, I provided you with a detailed factual analysis of the BTC/USD 1W INDEX chart.
That was the day crypto Twitter was overwhelmed with fear. I also gave you a first very likely cluster of $94,000 to $100,000 per BTC.
Already on December 3, 2025, we hit the first cluster with a BTC value of approximately $94,200. Furthermore, I see the next stronger resistance at approximately $103,000.
Follow @AEON_Analytics because information is everything!
21 Nov 2025
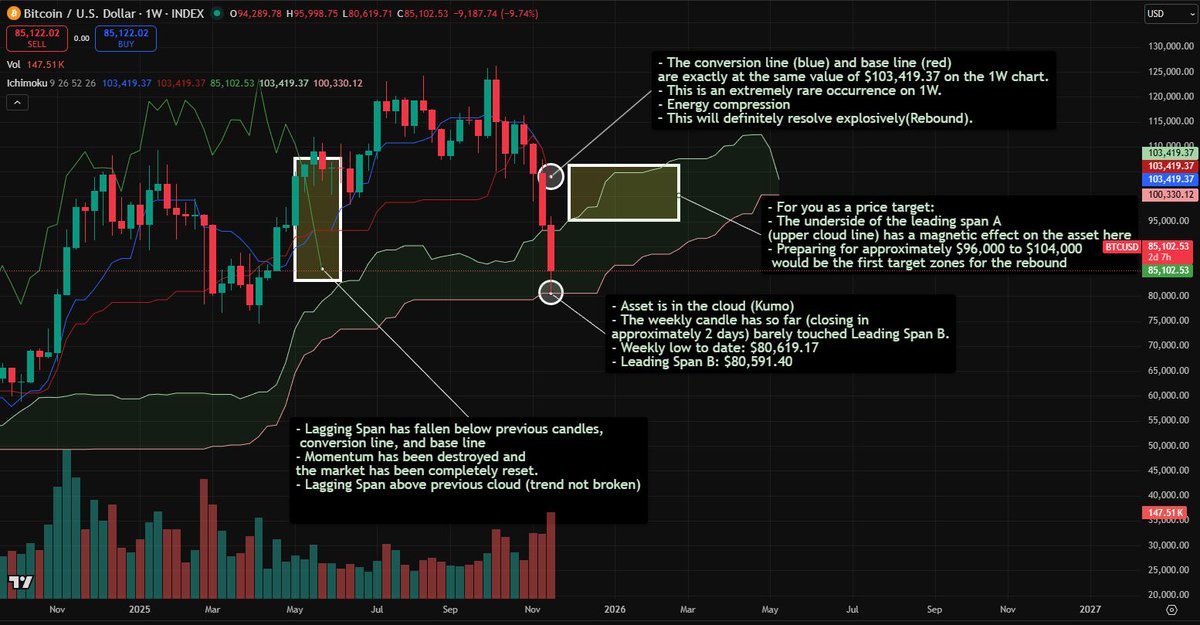
Bitcoin just printed one of the rarest 1W setups in years.
And almost nobody is talking about it.
Here’s what I found after combining:
Ichimoku Cloud Slow Stochastic Prime Oscillator Pro Monte Carlo simulations.
1️⃣ Ichimoku:
Rare Weekly Energy Compression
Tenkan (Conversion) and Kijun (Base) are exactly aligned at $103,419.
This only happens in extreme compression phases before explosive moves.
Price bounced on the lower Weekly Kumo, which is still intact.
Lagging Span fell under previous candles → momentum flush.
BUT it stayed above the historical cloud → trend not broken.
This is the textbook definition of a structural reset, not a trend collapse.
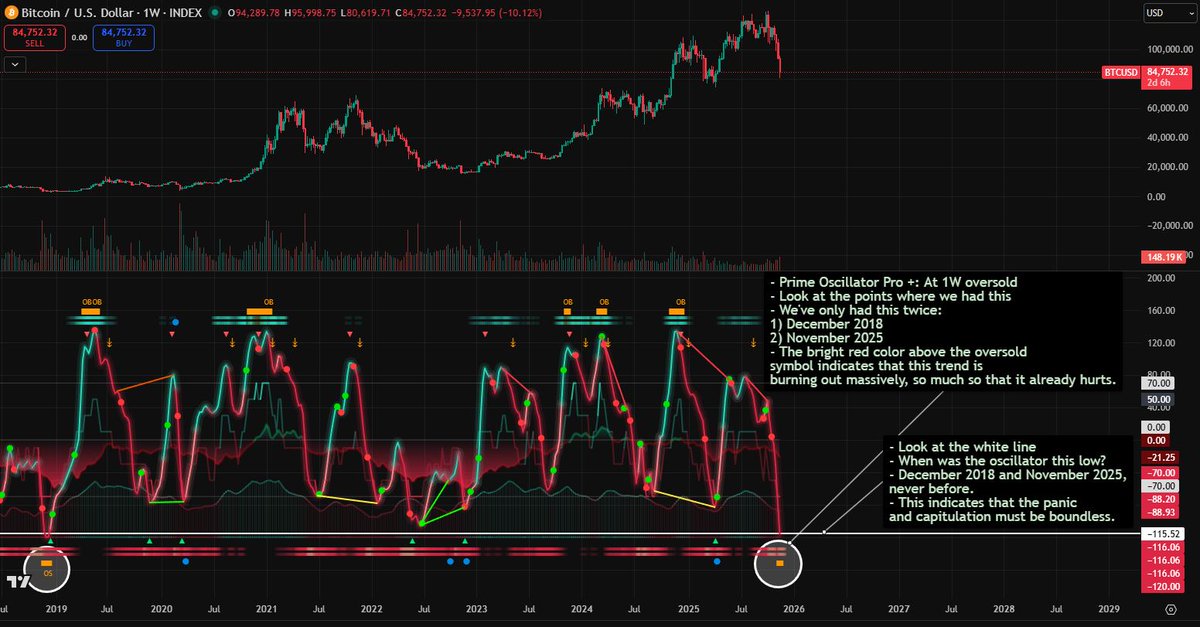
2️⃣ Oscillators Are at Historic Capitulation Levels
Prime Oscillator Pro (1W):
Only two times in BTC history have we hit this level:
December 2018
November 2025 (now)
Both marked macro bottoms.
The bright red exhaustion band shows the downtrend is literally burning out.
Slow Stochastic (1W):
As oversold as in 2019 and 2022 bottoms.
No flattening yet, but we’re at extreme readings not seen in years.
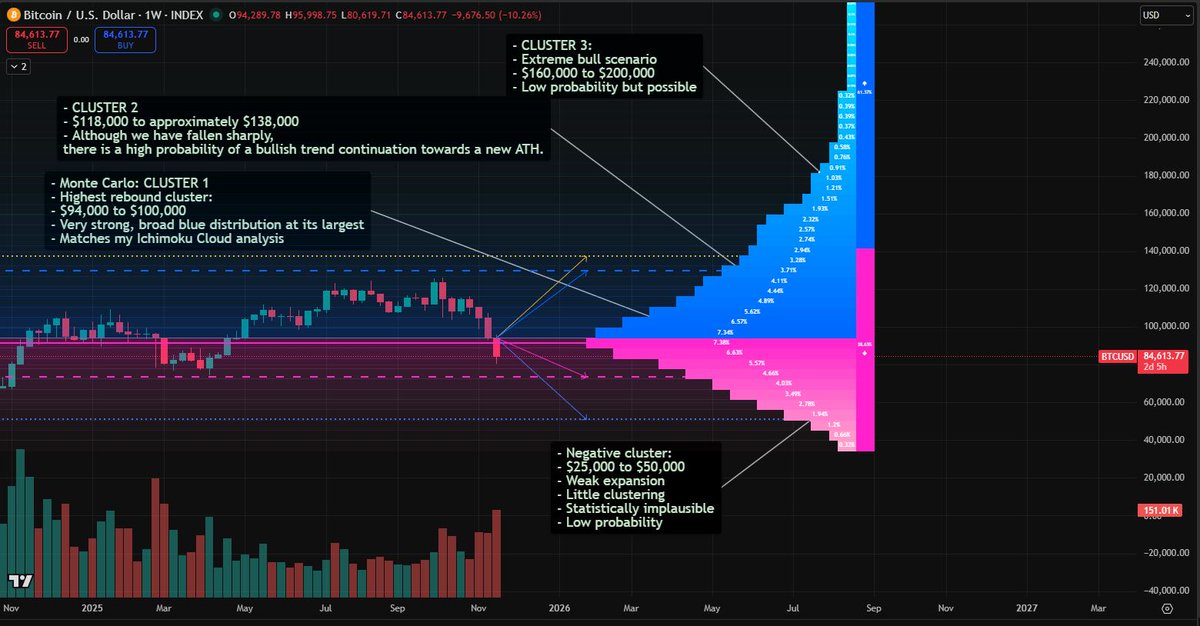
3️⃣ Monte Carlo (1W): The Statistics Are Wild
The 500-path simulation shows:
Highest probability cluster: $94,000–$100,000
Strong continuation cluster: $118,000–$138,000
Extreme tail scenario: $160,000–$200,000
Downside cluster ($25k–$50k) is weak, narrow, and statistically unlikely.
In short:
Even after the crash, the statistical model favors trend continuation over breakdown.
Conclusion:
This is not a breakdown.
It’s a weekly momentum flush inside an intact macro uptrend.
If this setup resolves the way similar structures have in the past,
the next major move could surprise a lot of people to the upside, not the downside.
Key Levels to Watch:
$96,000–$104,000 → First rebound magnet
$118,000–$138,000 → High-probability continuation cluster
$160,000–$200,000 → Extreme tail, but possible
Follow @QNR_Oracle

1
1
191
1 Dec 2025
Of course, you are not swapping your cryptos for stablecoins such as USDT or USDC at this point because you know that these two have been overbought for three weeks now.
- 1W chart USDT dominance and USDC dominance - Prime Oscillator Pro
Nevertheless, many are swapping for USDT or USDC. This is pure emotion against the data.
Do you want to give in to the pressure too?
113
21 Nov 2025
Bitcoin just printed one of the rarest 1W setups in years.
And almost nobody is talking about it.
Here’s what I found after combining:
Ichimoku Cloud Slow Stochastic Prime Oscillator Pro Monte Carlo simulations.
1️⃣ Ichimoku:
Rare Weekly Energy Compression
Tenkan (Conversion) and Kijun (Base) are exactly aligned at $103,419.
This only happens in extreme compression phases before explosive moves.
Price bounced on the lower Weekly Kumo, which is still intact.
Lagging Span fell under previous candles → momentum flush.
BUT it stayed above the historical cloud → trend not broken.
This is the textbook definition of a structural reset, not a trend collapse.
2️⃣ Oscillators Are at Historic Capitulation Levels
Prime Oscillator Pro (1W):
Only two times in BTC history have we hit this level:
December 2018
November 2025 (now)
Both marked macro bottoms.
The bright red exhaustion band shows the downtrend is literally burning out.
Slow Stochastic (1W):
As oversold as in 2019 and 2022 bottoms.
No flattening yet, but we’re at extreme readings not seen in years.
3️⃣ Monte Carlo (1W): The Statistics Are Wild
The 500-path simulation shows:
Highest probability cluster: $94,000–$100,000
Strong continuation cluster: $118,000–$138,000
Extreme tail scenario: $160,000–$200,000
Downside cluster ($25k–$50k) is weak, narrow, and statistically unlikely.
In short:
Even after the crash, the statistical model favors trend continuation over breakdown.
Conclusion:
This is not a breakdown.
It’s a weekly momentum flush inside an intact macro uptrend.
If this setup resolves the way similar structures have in the past,
the next major move could surprise a lot of people to the upside, not the downside.
Key Levels to Watch:
$96,000–$104,000 → First rebound magnet
$118,000–$138,000 → High-probability continuation cluster
$160,000–$200,000 → Extreme tail, but possible
Follow @QNR_Oracle
1
346
19 Nov 2025
HOLD!
Fear and paranoia are so high that we can no longer reach most people with facts and figures.
I'll tell you exactly how it feels.
It feels like we're at the bottom of a bear market.
It's absolutely crazy what's going on here.
I just saw the 1W BTC/USD Index Chart - Prime Oscillator Pro - oversold on a weekly basis.
The last time I saw that was at the end of 2018.
Hang in there for a few more days.
Things will get better soon
Unfortunately, most people will come away empty-handed and will buy your coins at the highest prices.
1
2
96
17 Nov 2025
You'll think I'm crazy, but the downward trend is slowly drying up, especially on the 1W chart.
In addition, I would have a buy signal here at the current price zones.
I could see that clearly using the Heikin Ashi and SlowStoch indicators, and I see charts that are absolutely and brutally oversold.
It feels a bit like summer 2021 to me.
On top of that, we are in a state of extreme fear and, of course, there are constantly bearish posts, such as the big wallets dumping everything.
I saw the same kind of news in April 2025.
I'll get back to you later with a chart and explain exactly what I mean.
1
67