
Joined June 2022
- Tweets 2,964
- Following 338
- Followers 5,207
- Likes 883
1,688 Photos and videos


Pinned Tweet

28 Jun 2022
Agora Policy is a Nigerian think tank and non-profit committed to finding practical solutions to urgent national challenges. We conduct policy research, facilitate frank and purposeful dialogues, and build capacity for governance, policy and advocacy.
5
39
123
🚨Inflation Watch
The latest figures released by @NBS_Nigeria show that headline inflation rose to 15.93% in May 2026 from 15.68% in April. Food inflation also rose to 16.96% from 16.06% within the same period, surpassing headline inflation for the second consecutive month.
1
4
4
335
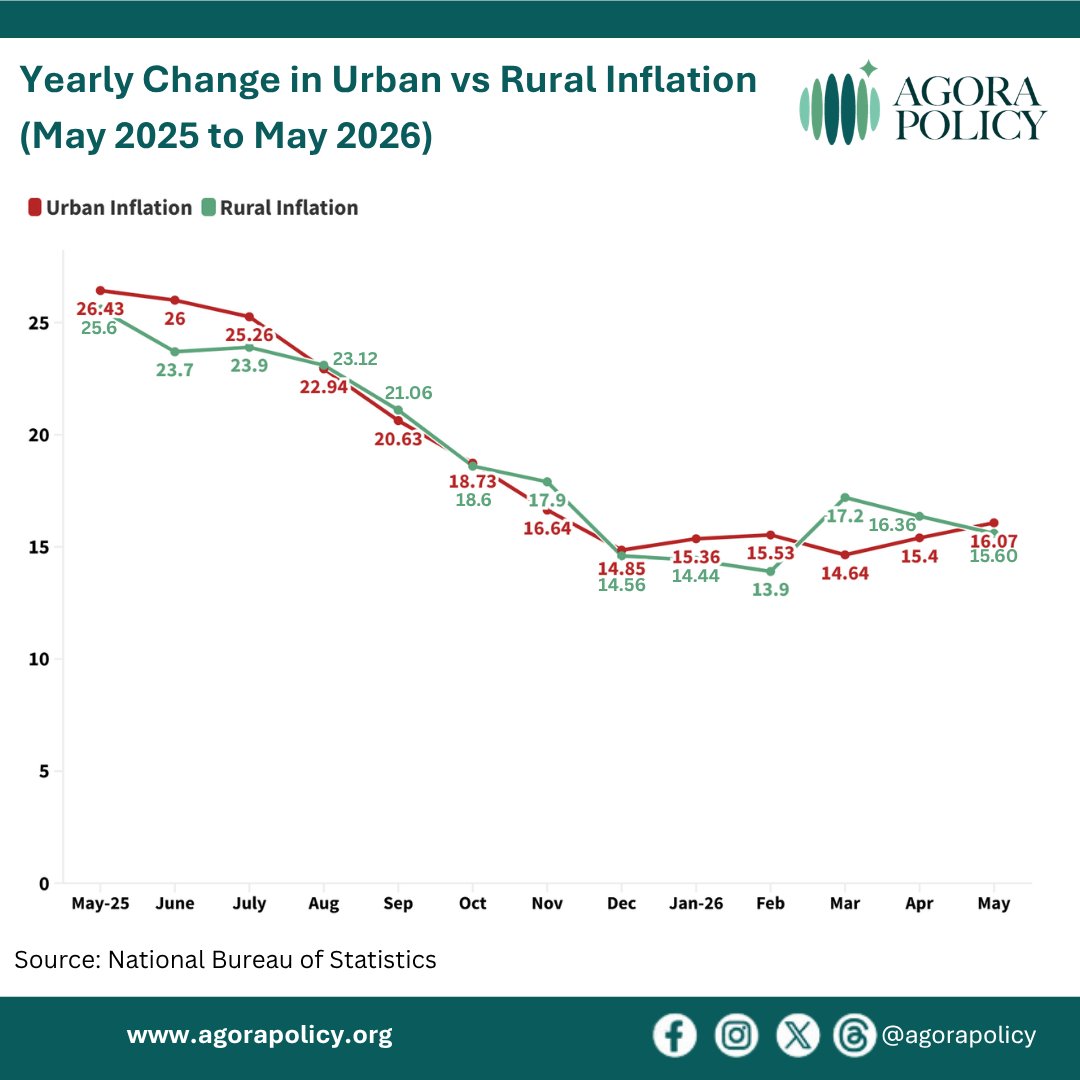
In May, urban inflation increased to 16.07% from 15.4% in April while rural inflation eased further to 15.60% from 16.36% over the same period.
1
41
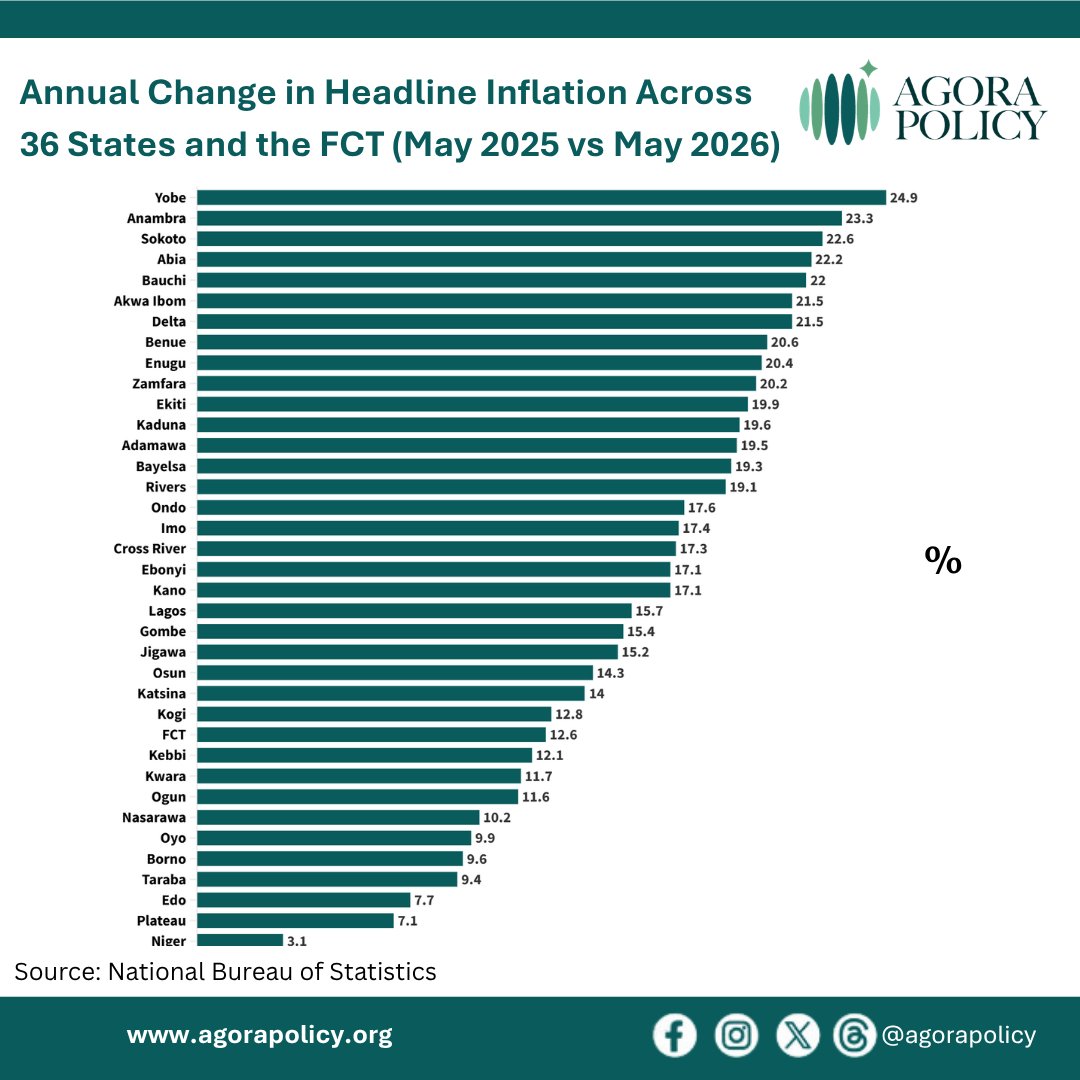
At the state level, Yobe, Anambra and Sokoto recorded the highest y/y headline inflation rates while Niger, Plateau and Edo had the lowest.
For food inflation, Adamawa, Kwara and Rivers had the highest rates whereas Borno, Taraba and Bayelsa recorded the lowest.

36
Jun 10
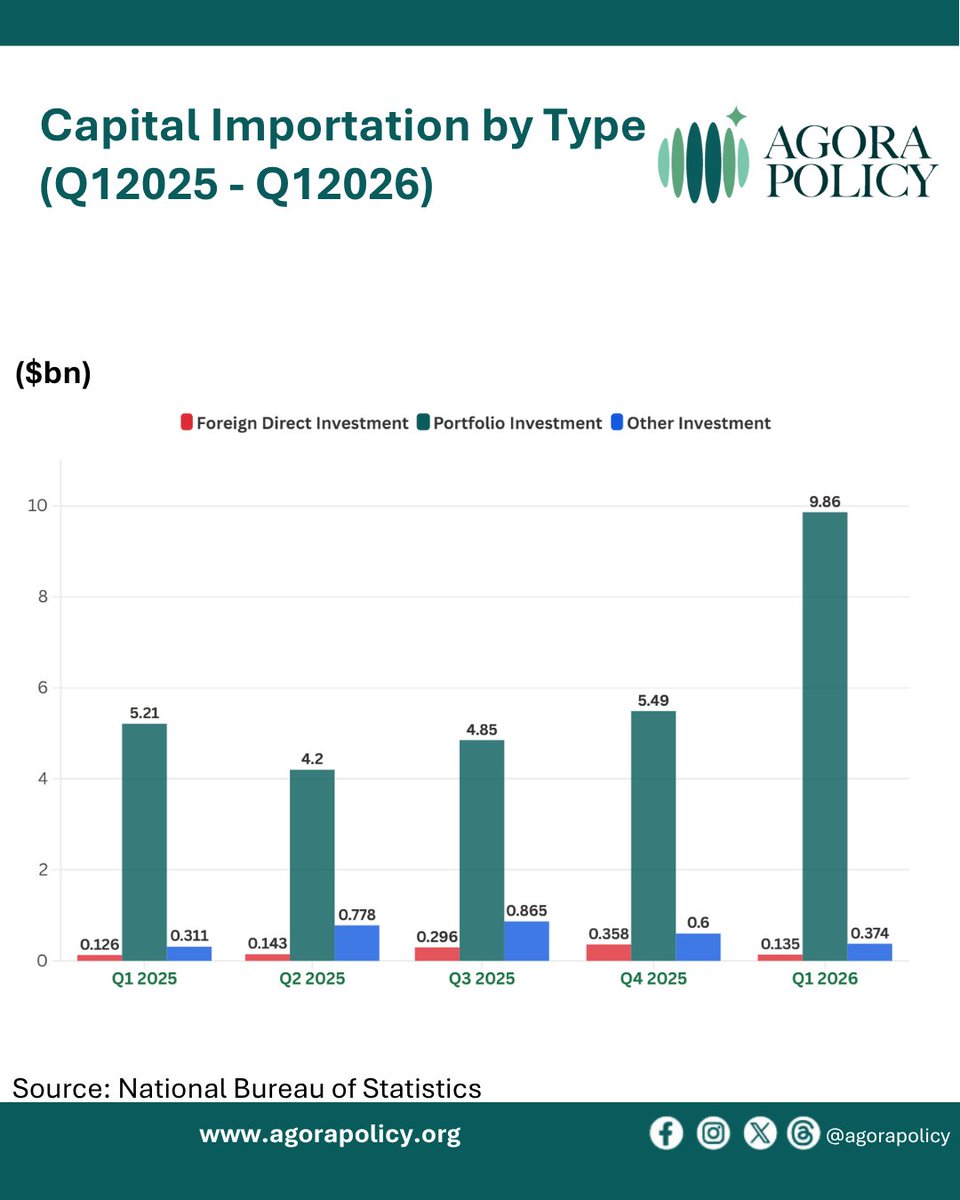
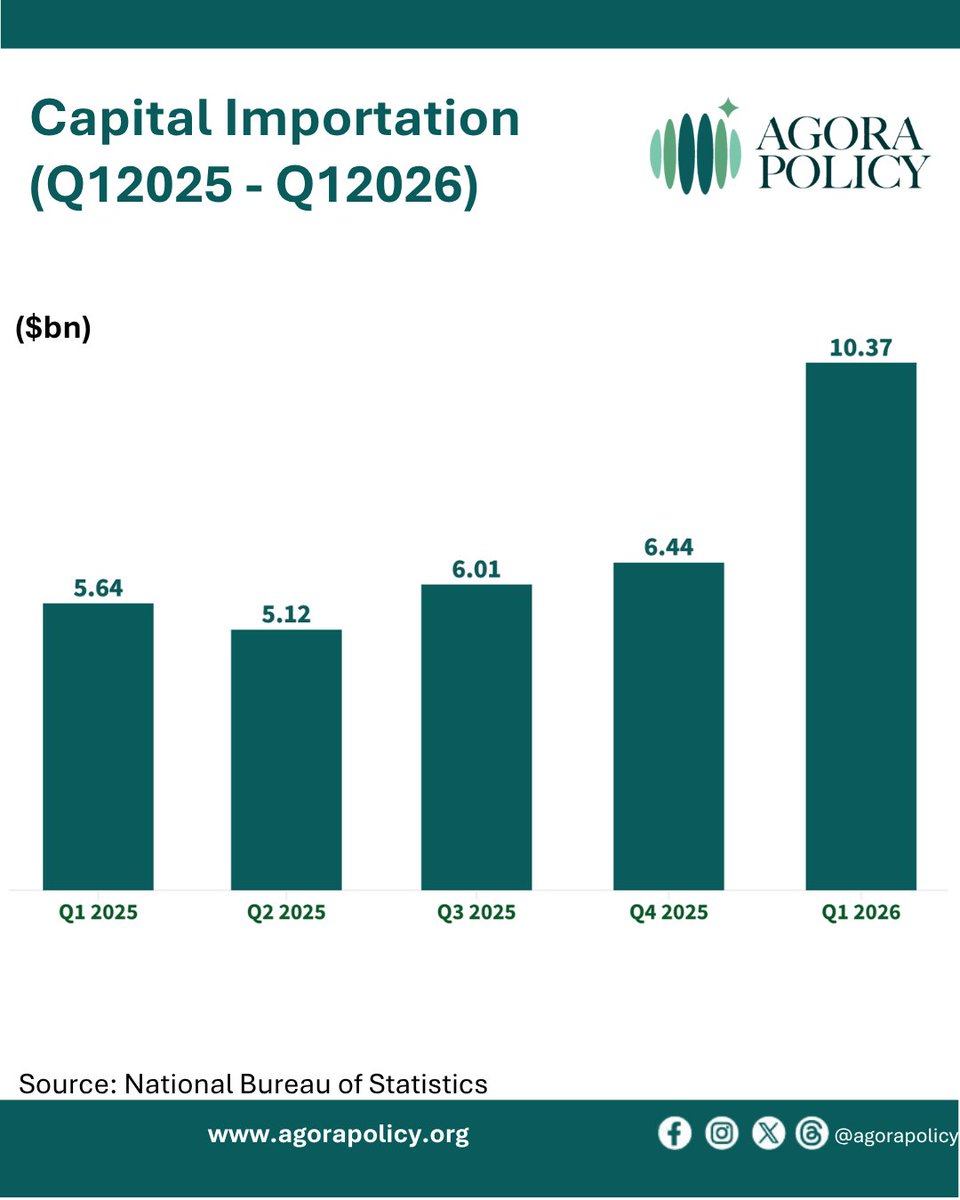
🚨Capital Importation Highlights (Q1 2026)
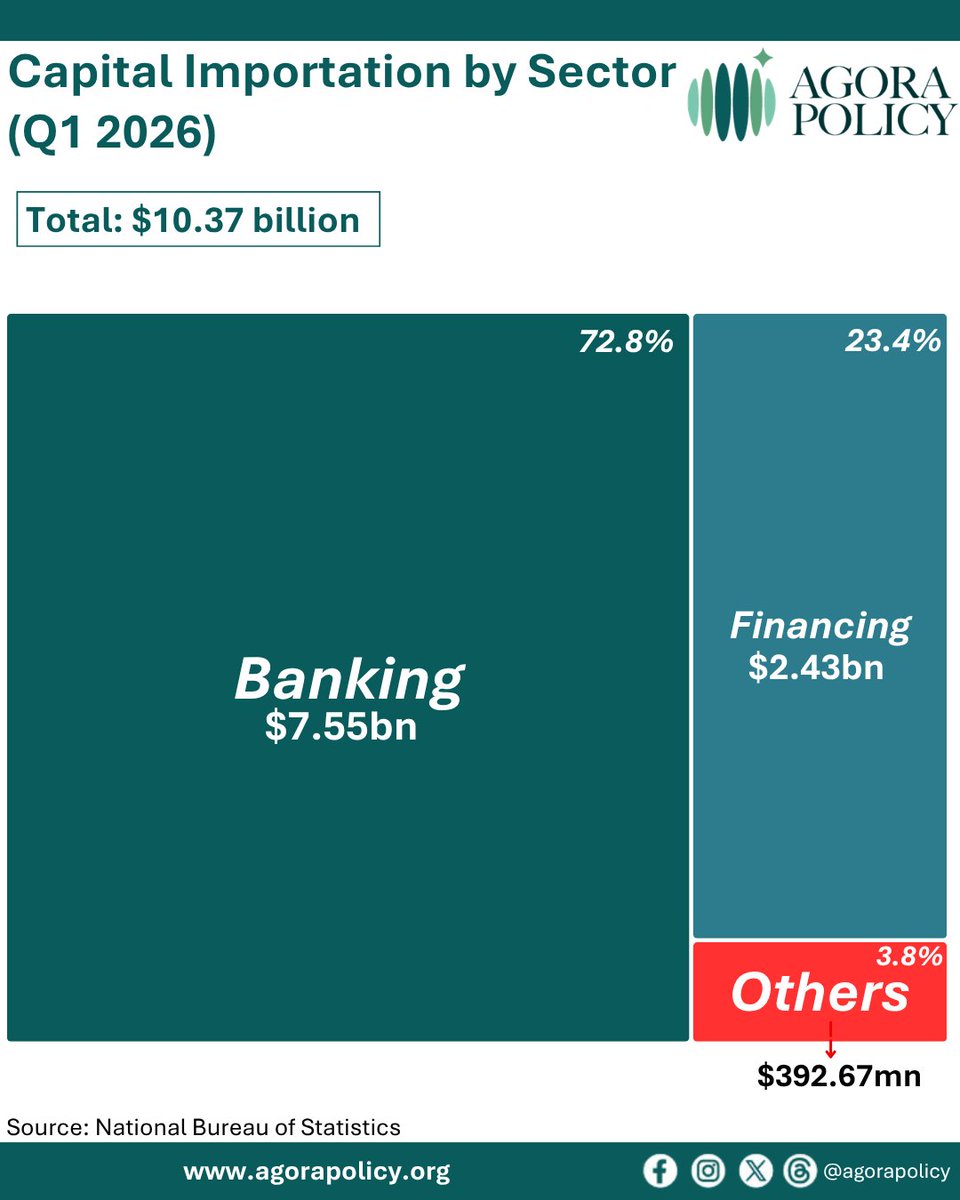
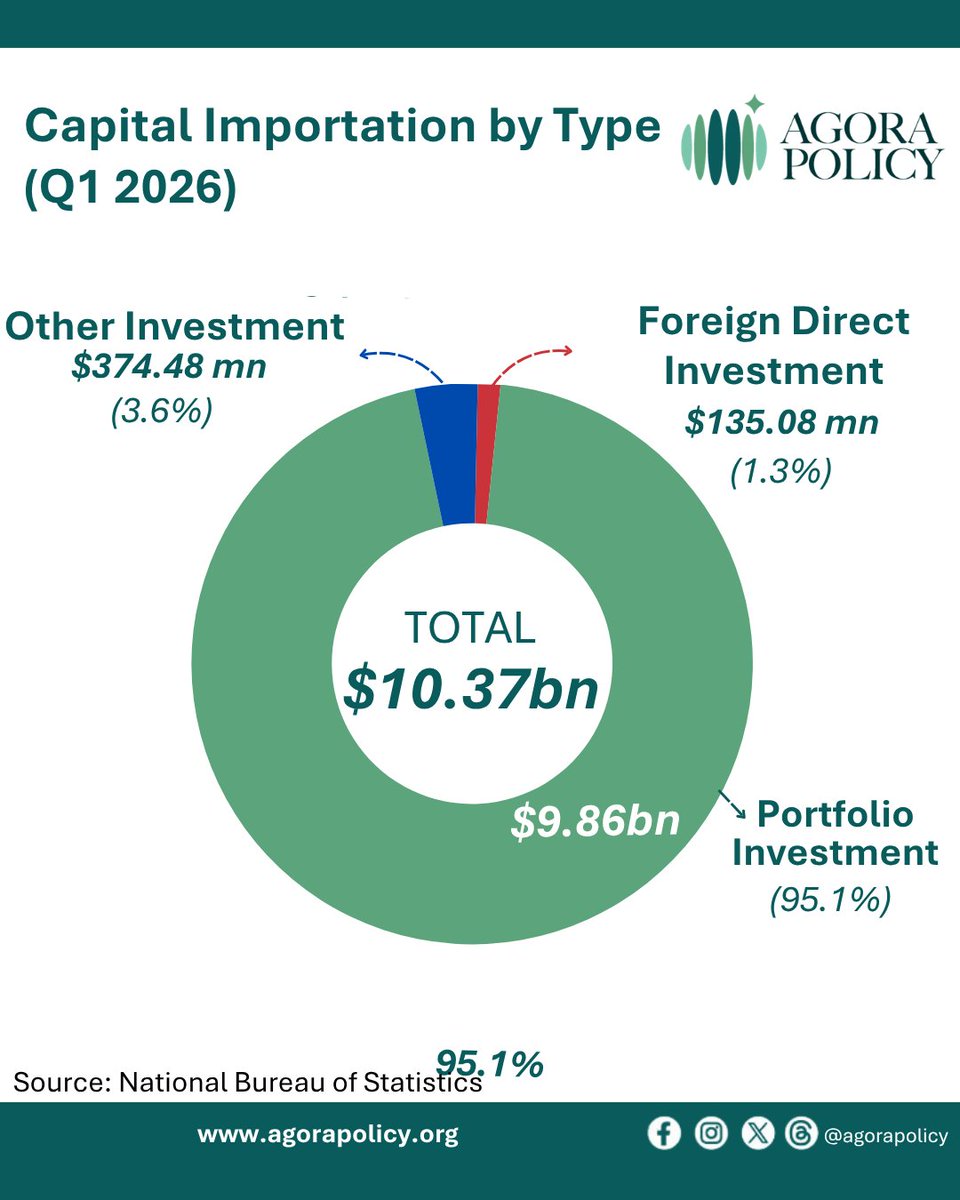
Nigeria's capital importation rose to $10.37bn in Q1 2026, up from $6.44bn in Q4 2025 and $5.64bn in Q1 2025. This represents the highest level of capital inflows recorded in the last five quarters.
2
6
6
391
Jun 10
The Banking sector attracted the largest share of capital inflows in Q1 2026, receiving $7.55bn of total capital imported.
The Financing sector followed with $2.43bn, while all other sectors accounted for $392.67mn combined.
1
59
Jun 10
The United Kingdom, United States, and South Africa were the top sources of capital inflows into Nigeria in Q1 2026.
The UK led with $5.08bn, followed by the US with $3.18bn, while South Africa contributed $984mn.
65
Jun 8
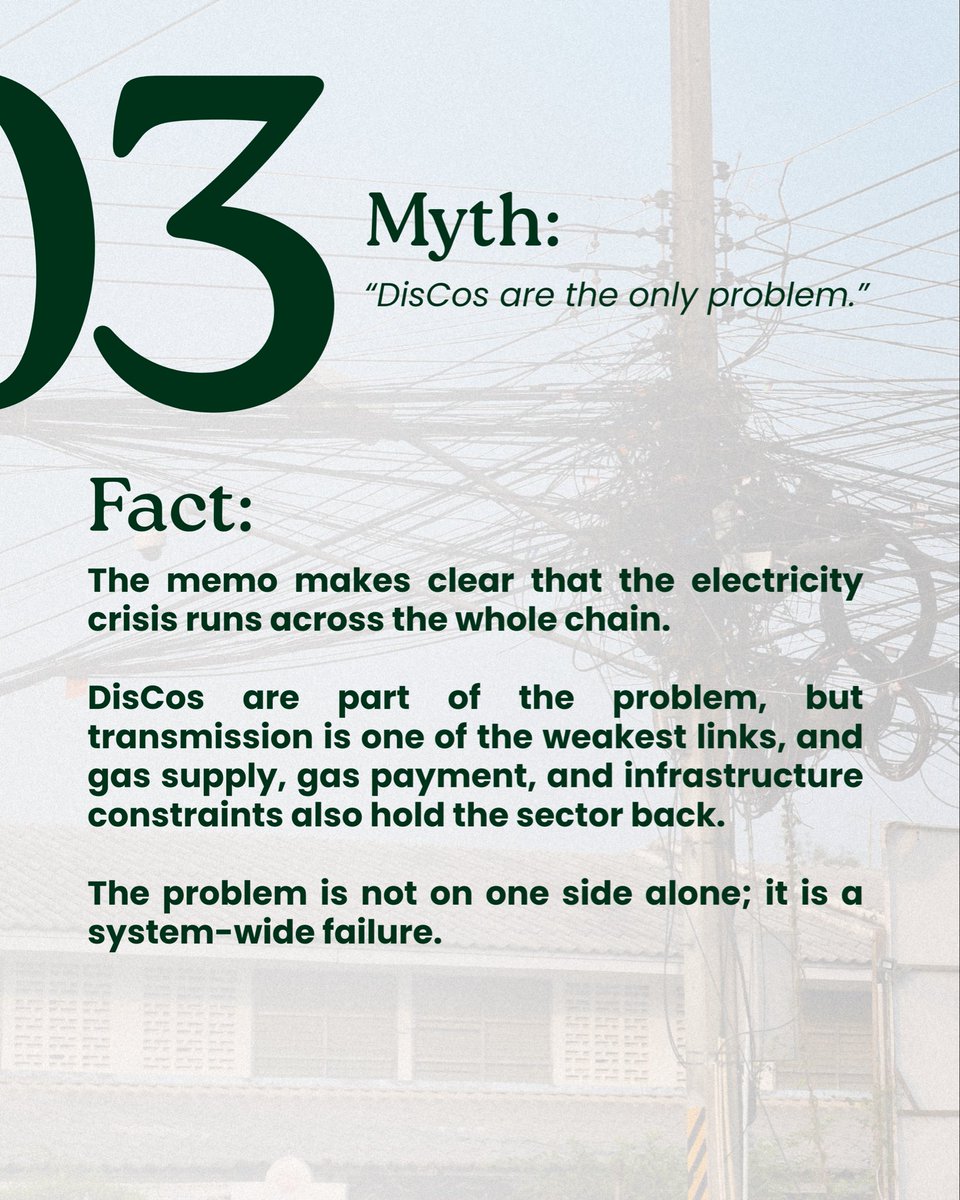
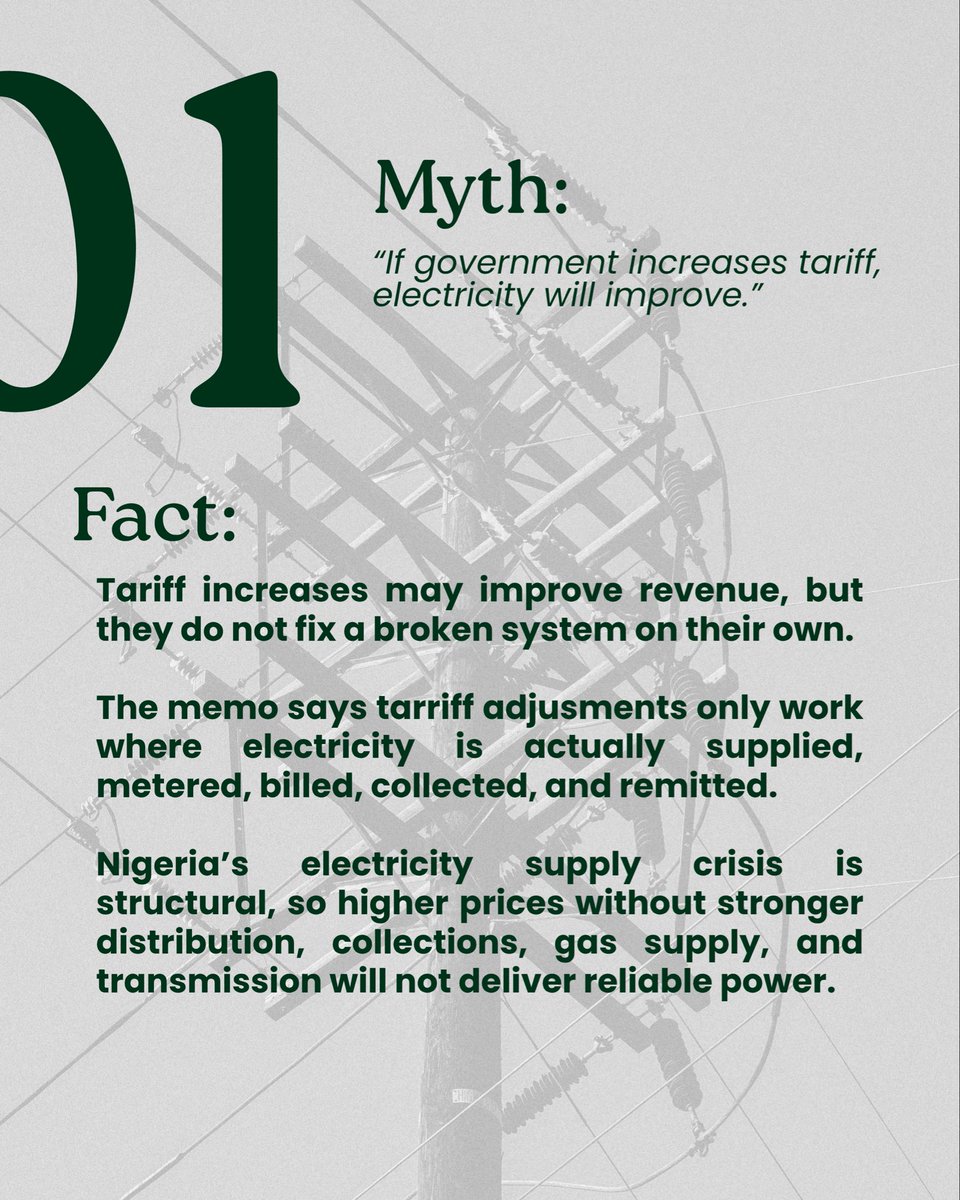
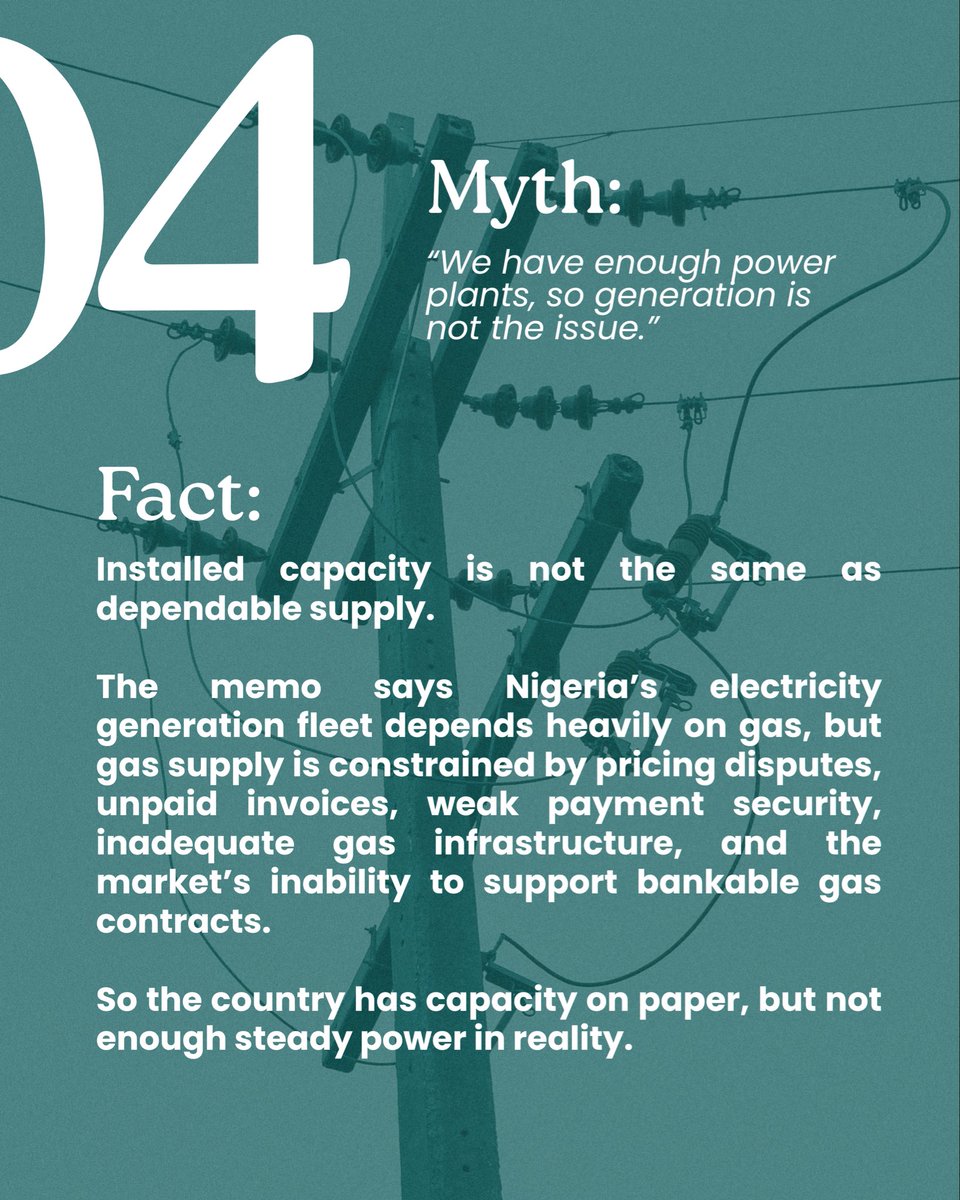
🚨 MYTH VS REALITY: Nigeria's Electricity Sector
Will higher tariffs automatically improve electricity supply? Are DisCos the only issue?
Our latest policy memo argues that Nigeria's electricity crisis is deeper than these common assumptions.
1
19
24
805

Jun 5
🚨GDP Highlights (Q1 2026)
Nigeria's GDP expanded by 3.89% in Q1 2026, higher than the 3.13% recorded in Q1 2025. However, this growth was lower than the 4.07% recorded in Q4 2025.

1
6
8
773
Jun 5
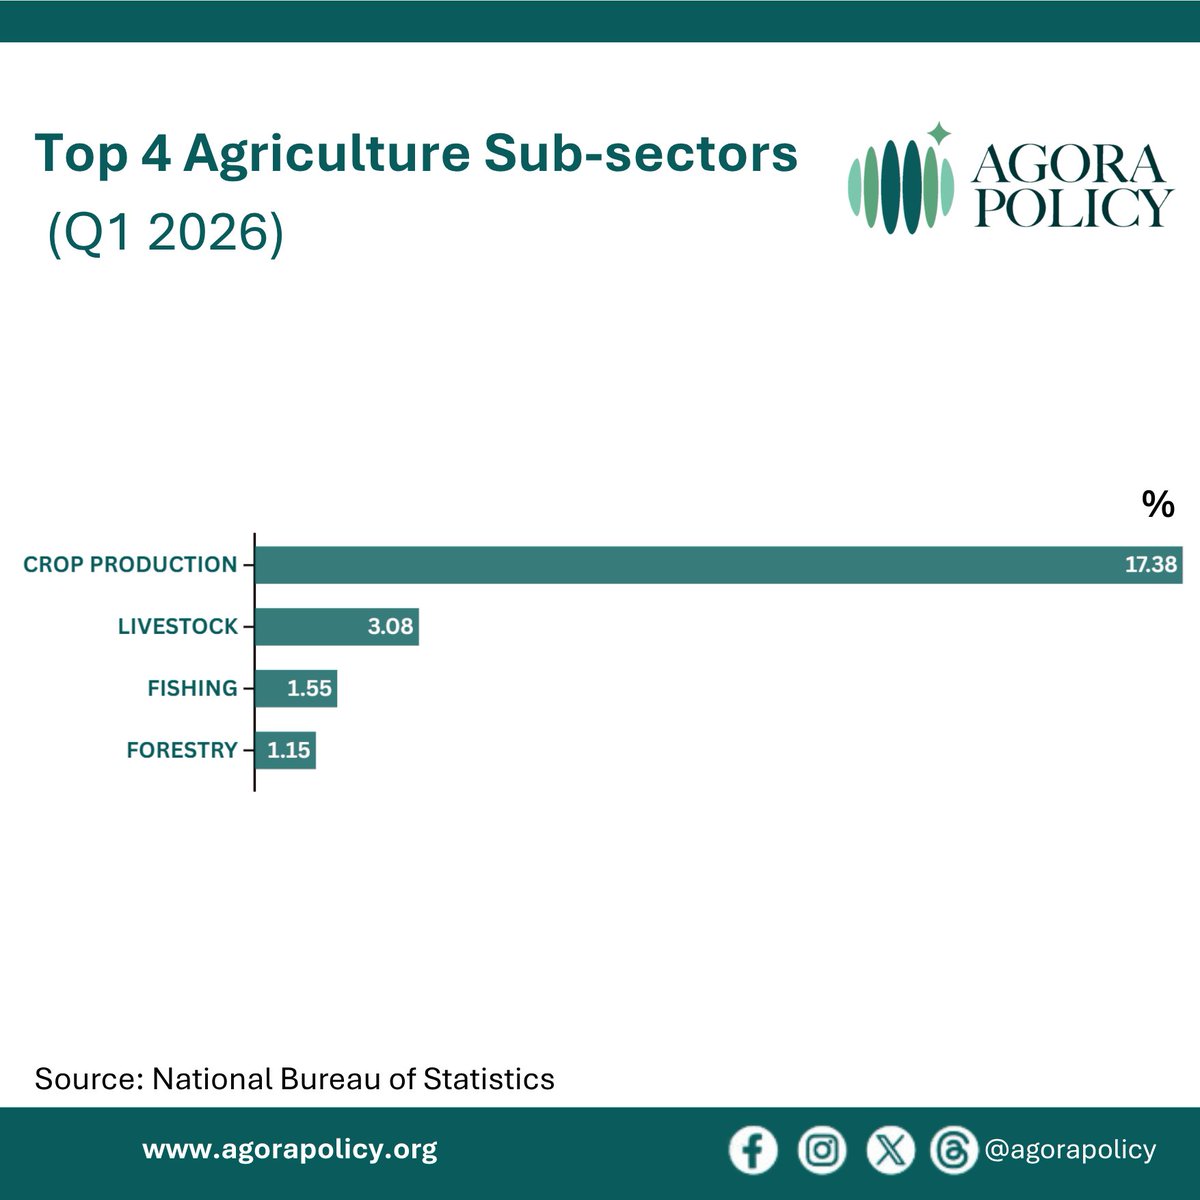
Crop Production remained the dominant agricultural activity in Q1 2026, contributing 17.38% to GDP. Livestock contributed 3.08%, while Fishing and Forestry accounted for 1.55% and 1.15% respectively.
1
117
Jun 5
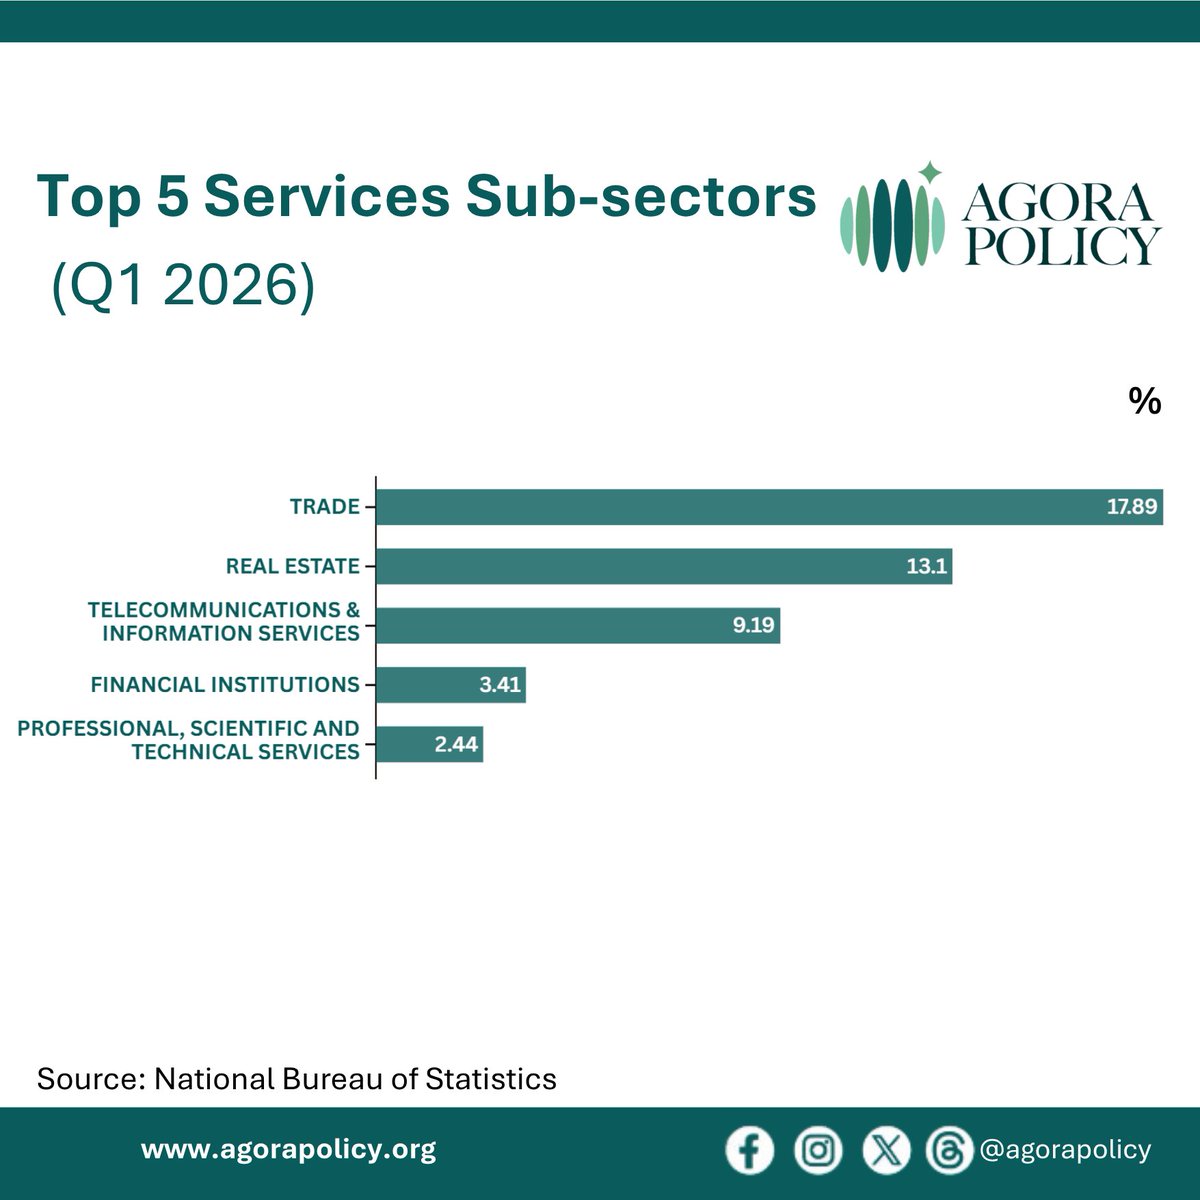
Trade remained the largest services sub-sector in Q1 2026, contributing 17.89% to GDP. Real Estate contributed 13.10%, while Telecommunications & Information Services accounted for 9.19%.
104