AIDD project is funded by the European Union’s Horizon 2020 under the Marie Skłodowska-Curie grant agreement No 956832. #machinelearning #drugdesign #AI #ITN
Joined January 2021
- Tweets 477
- Following 76
- Followers 479
- Likes 303
151 Photos and videos


We have moved to bsky.app/profile/aidd.bsky.s… No posts will be at twitter/X anymore.
1
74
https://bsky.app/profile/aidd.bsky.social retweeted

26 Jan 2025
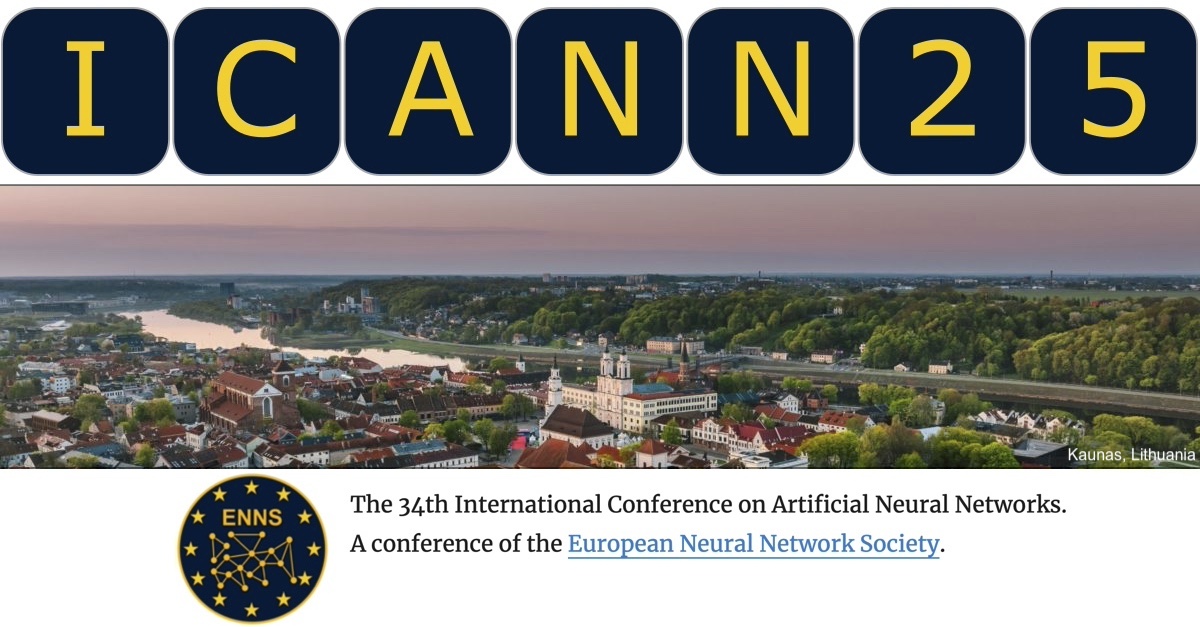
34th International Conference on Artificial Neural Networks #ICANN2025
Call for Papers, Special Sessions, Workshops & Tutorials
Kaunas, Lithuania
Sep 9 - 12, 2025
See: e-nns.org/icann2025/call-for…
#ENNS #AI #NeuralNetworks #ML #MachineLearning
3
8
382
https://bsky.app/profile/aidd.bsky.social retweeted

30 Dec 2024
new: "Human-in-the-loop active learning for goal-oriented molecule generation" jcheminf.biomedcentral.com/a…
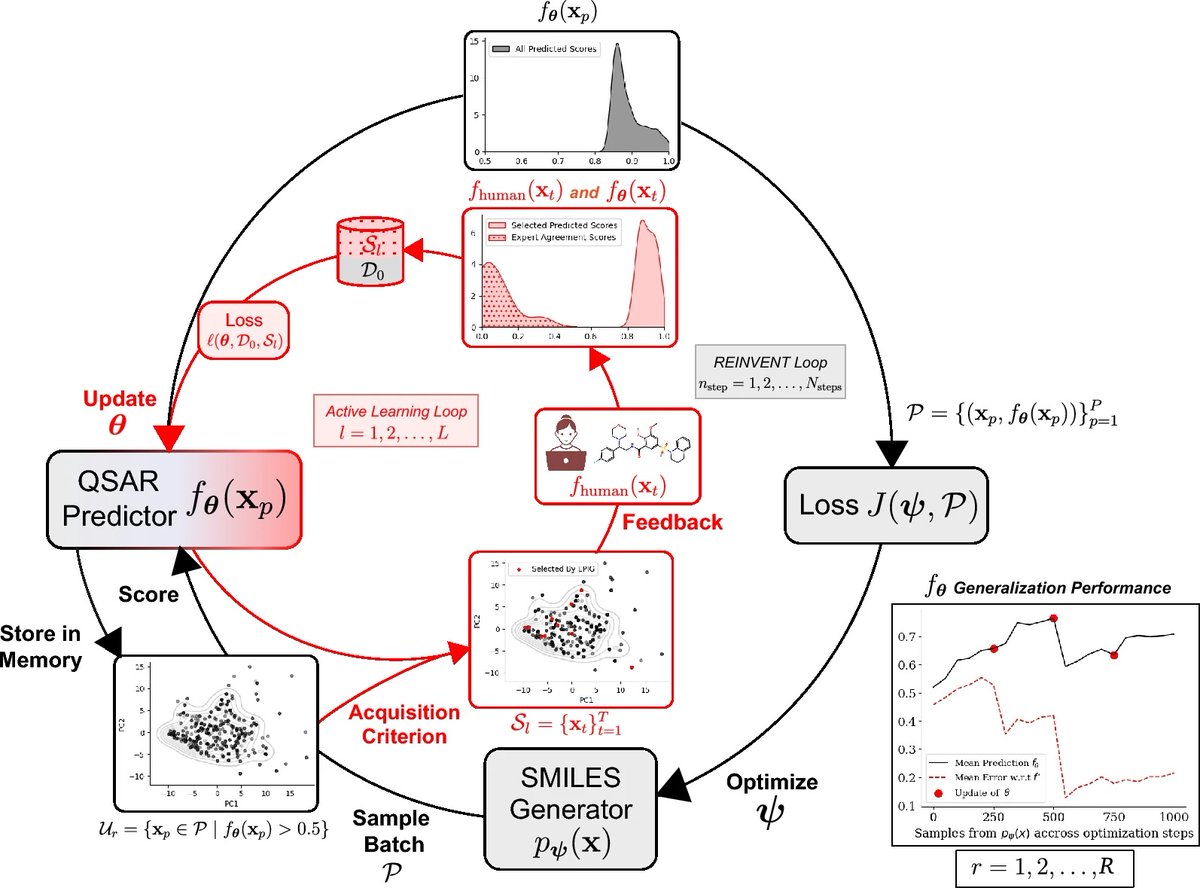
ALT Fig. 1: HITL-AL for goal oriented molecule generation.
6
15
950
https://bsky.app/profile/aidd.bsky.social retweeted
30 Dec 2024
new: "Be aware of overfitting by hyperparameter optimization!" jcheminf.biomedcentral.com/a…
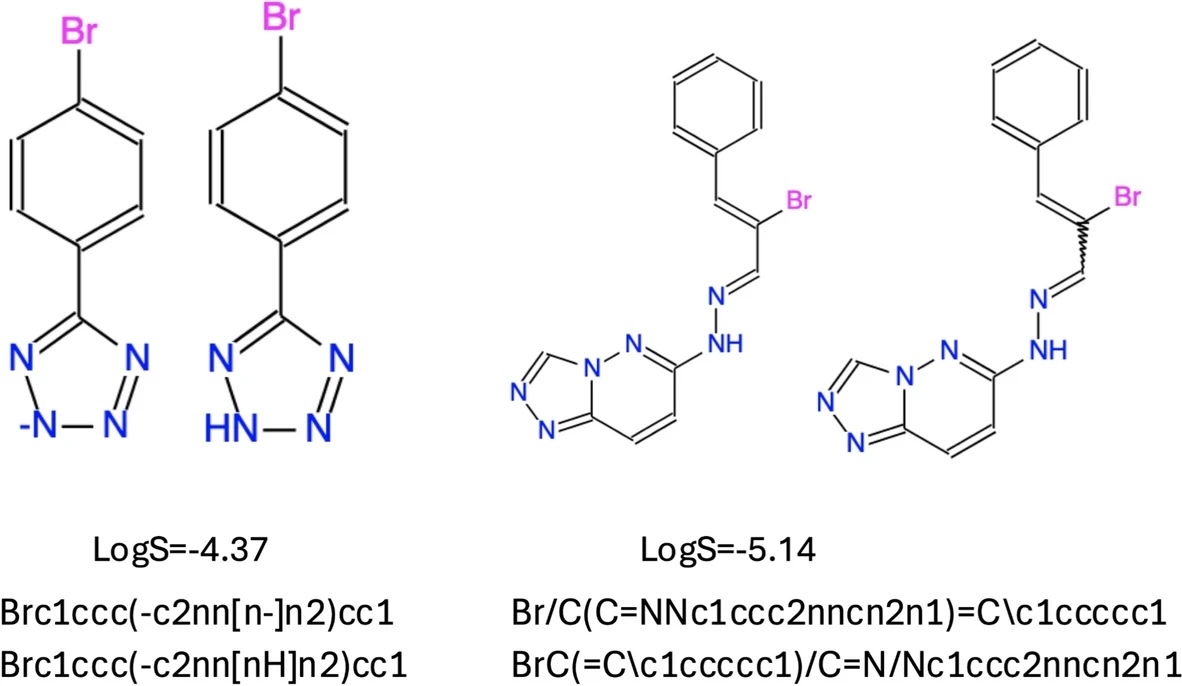
ALT Fig. 1: Examples of duplicated structures with exactly the same solubility values but different SMILES.
5
15
1,010
Hyperparameter optimization is frequently employed in machine learning, but optimization of a large space of parameters could result in overfitting.Use of pre-optimized hyperparameters can give similar or better performance up to 10000x faster: jcheminf.biomedcentral.com/a… @jcheminf
1
4
150
https://bsky.app/profile/aidd.bsky.social retweeted

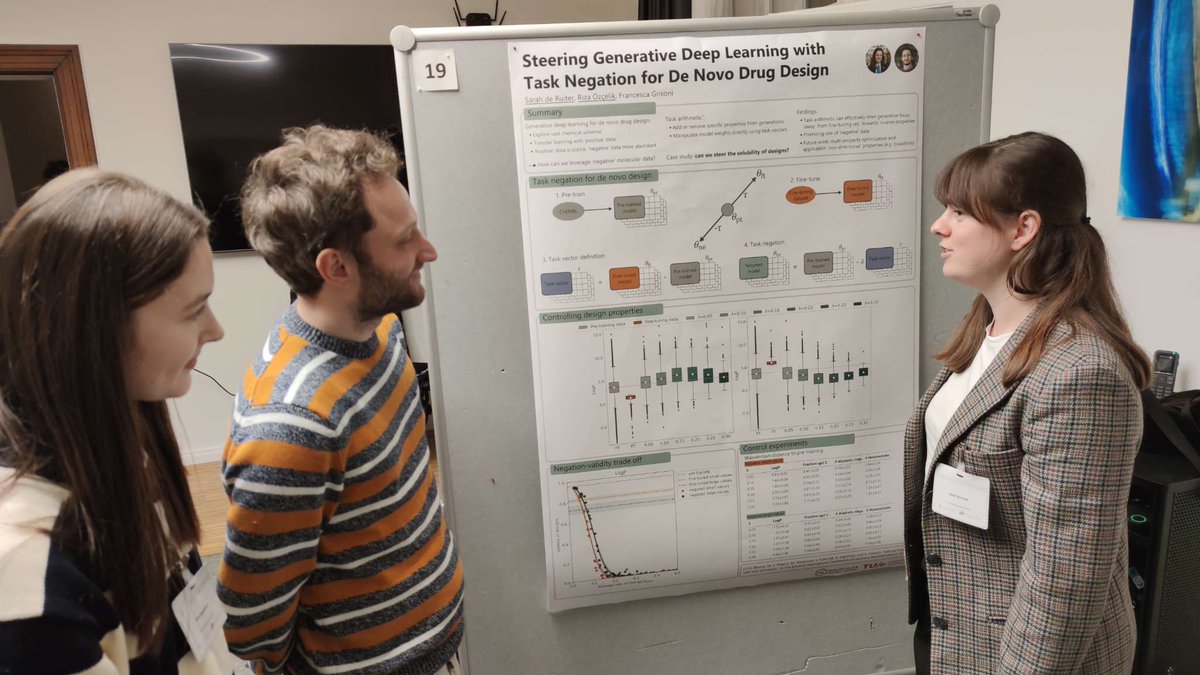
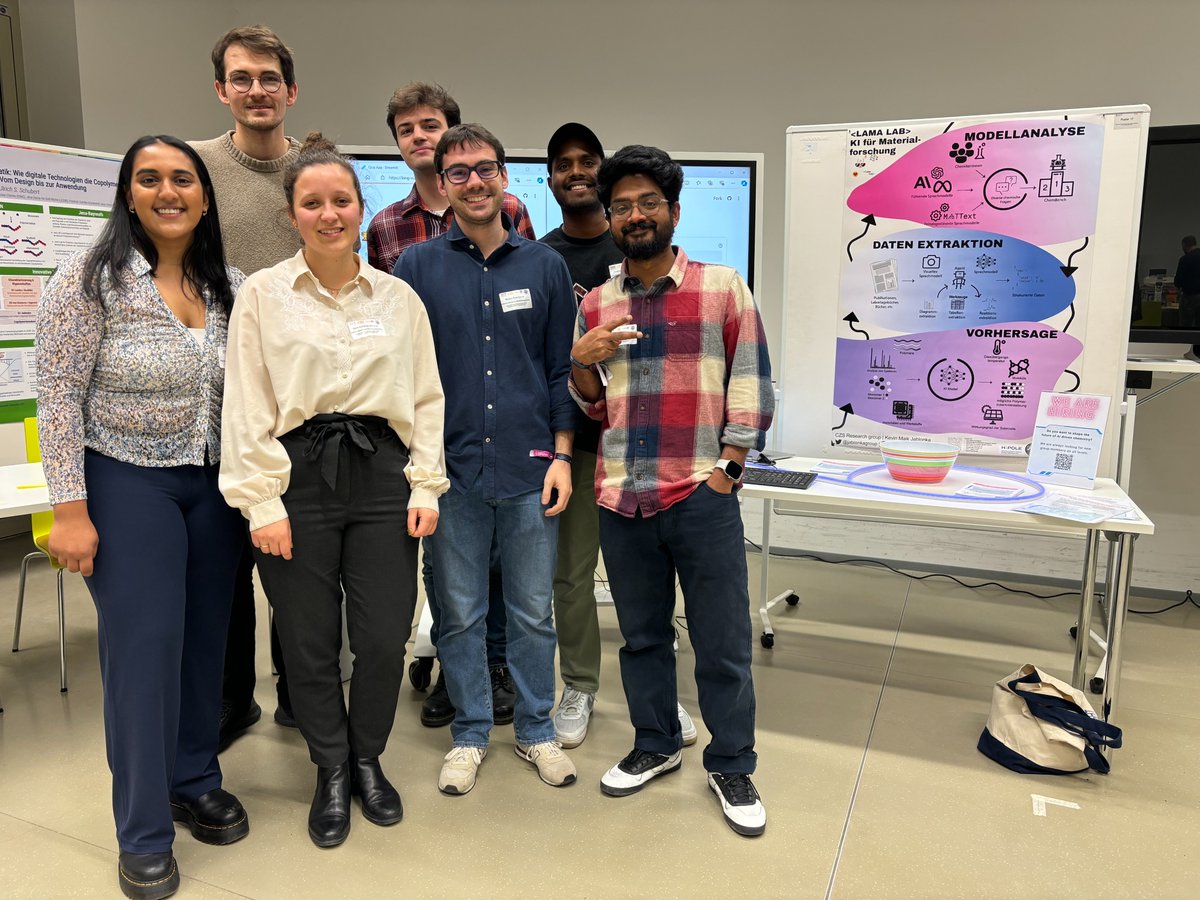
@ELLISforEurope ML4Science workshop co-organised by our PI @fra_grisoni & @AiddOne PI @gklambauer was a great event to learn advances in ML & promote @AiddOne results: ai-dd.eu/lectures. @AiChemist_DN fellows @xasanovadina @5_Marcel_7 attend poster session. Berlin eve.


7
21
3,178
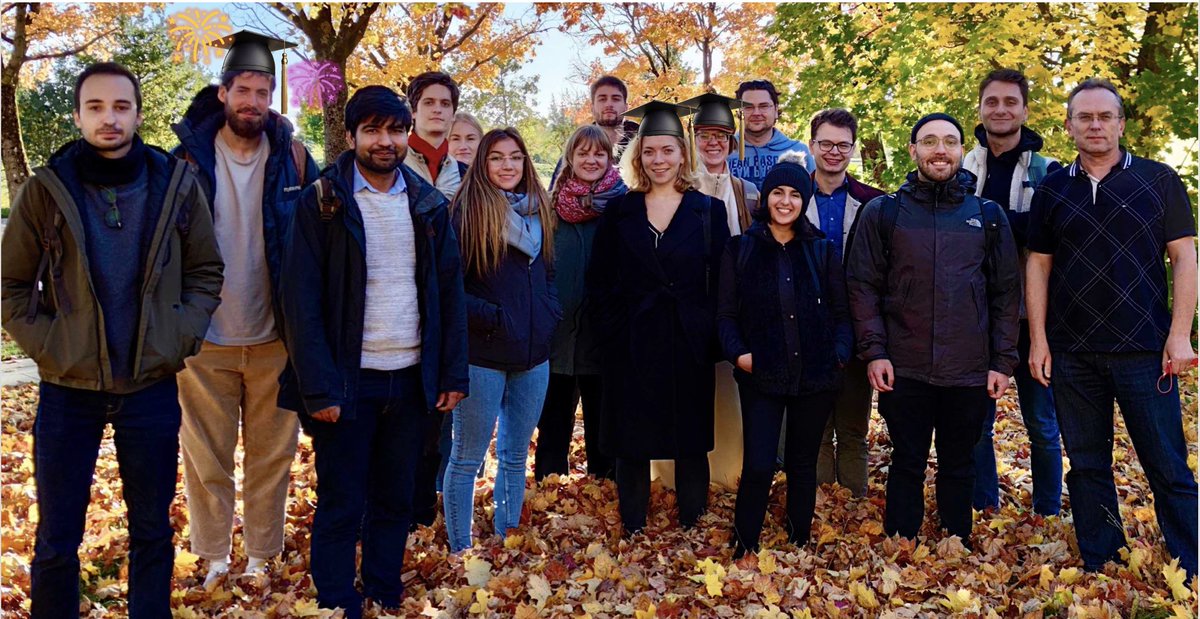
A huge congratulations to Dr. @JULIANCREMER15 for successfully defending his PhD - we are on a roll! Dr. Cremer will continue his outstanding work on #denovo #drugdesign, which has received many accolades and an impressive amount of citations, as a postdoc at @pfizer. 👨🔬👏🎉
1
10
606
https://bsky.app/profile/aidd.bsky.social retweeted

8 Nov 2024
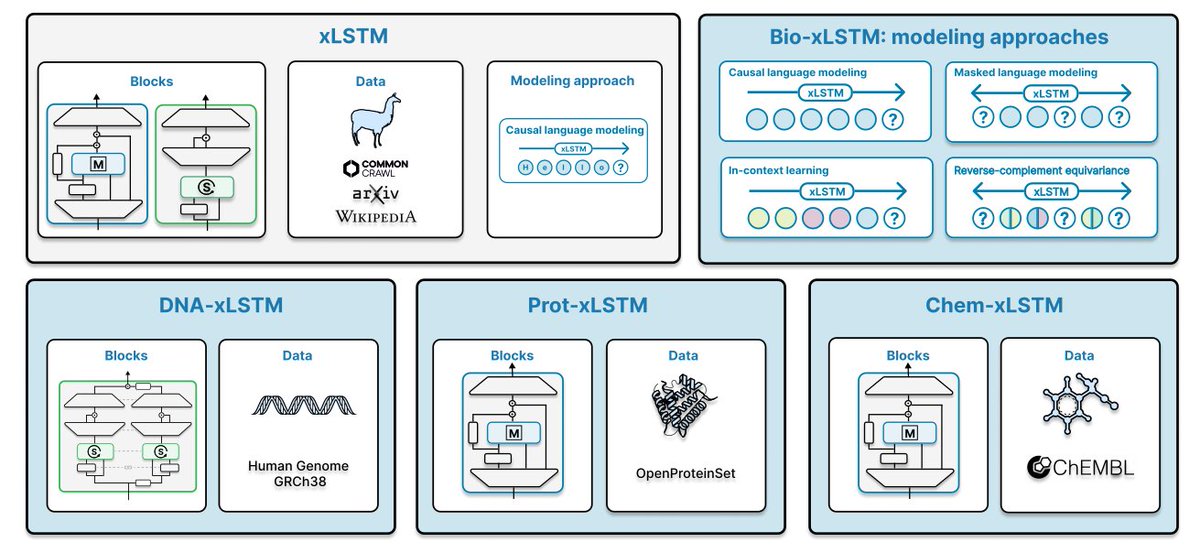
Bio-xLSTM: Generative modeling, representation and in-context learning of biological and chemical sequences
xLSTM also shines for DNA, proteins and small molecules -- can handle large-range interactions and huge context!
P: arxiv.org/abs/2411.04165
39
154
19,531
https://bsky.app/profile/aidd.bsky.social retweeted

4 Dec 2024
Menzerath's law (big construct formed by small components) can be seen as antifragility of structure coming from fragility of the parts
1
1
170
https://bsky.app/profile/aidd.bsky.social retweeted
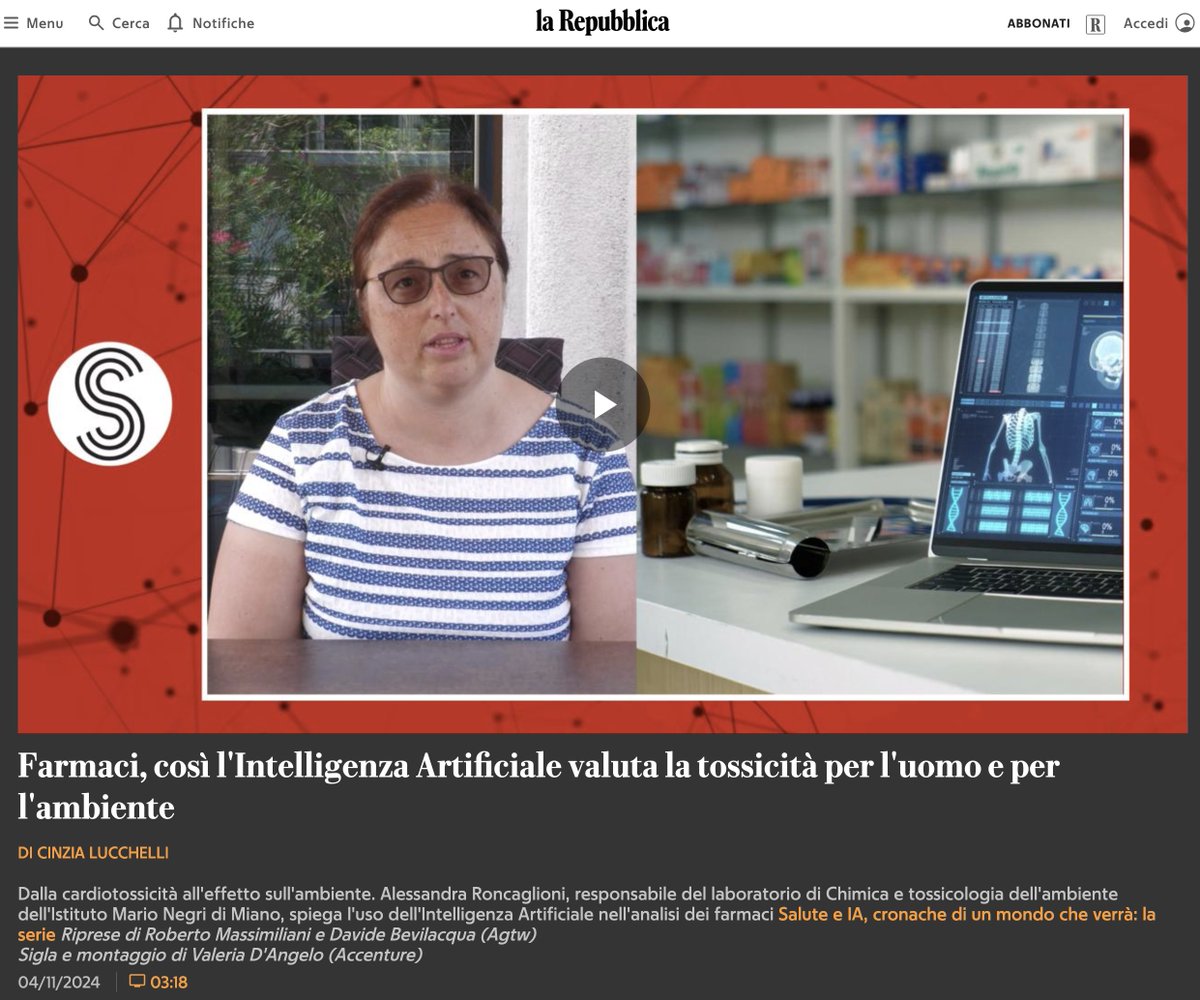
AiChemist PI Alessandra Roncaglioni aichemist.eu/irfmn-superviso…, head of the Environmental Chemistry and Toxicology Laboratory of @MarioNegriIRCCS in Milan, explains the use of Artificial Intelligence for the analysis of drugs. Enjoy listening, if you parli Italiano 😉.
2
1
6
242
https://bsky.app/profile/aidd.bsky.social retweeted
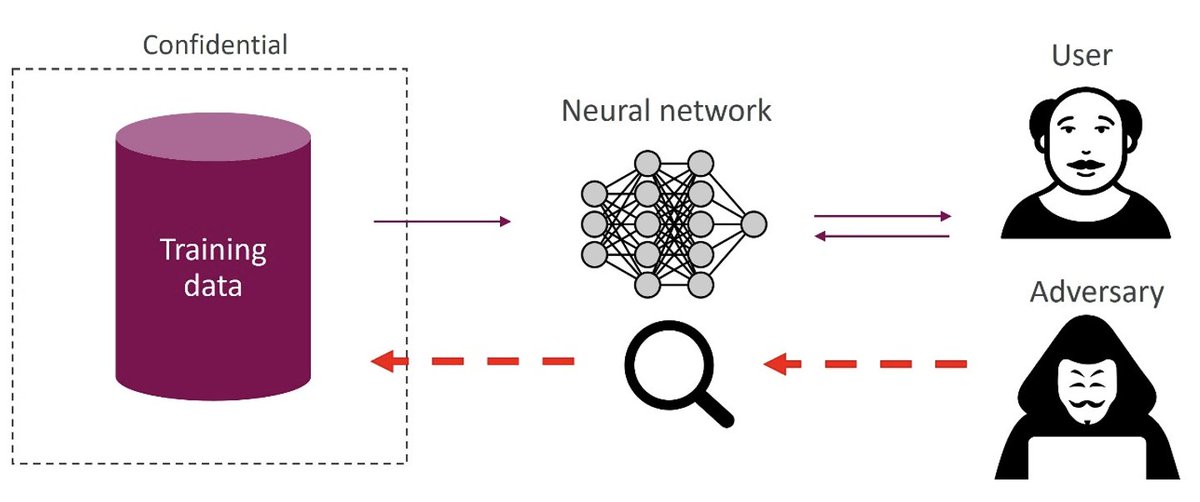
"Can Publishing Neural Networks Expose Confidential Training Data?" Fabian Krüger will dive into the details during the AiChemist seminar on 09.12 at 14:00 - all are welcome to join! Link to be posted on aichemist.eu/news at 10:00 CET the same day.
3
8
378
https://bsky.app/profile/aidd.bsky.social retweeted

Does this work excite you? Are you a prospective PhD, postdoc, or technical assistant? Look no further!
Thanks to a generous donation from OpenPhilanthropy, we have multiple openings in our group, reach out to us here forms.fillout.com/t/eoGA7Ahn…

Are Vision Language Models ready for scientific research?🔭👩🔬
We compared leading VLLMs on the three pillars of chemical and material science discovery: data extraction, lab experimentation and data interpretation.
arxiv.org/abs/2411.16955
4
19
3,796
https://bsky.app/profile/aidd.bsky.social retweeted

29 Nov 2024
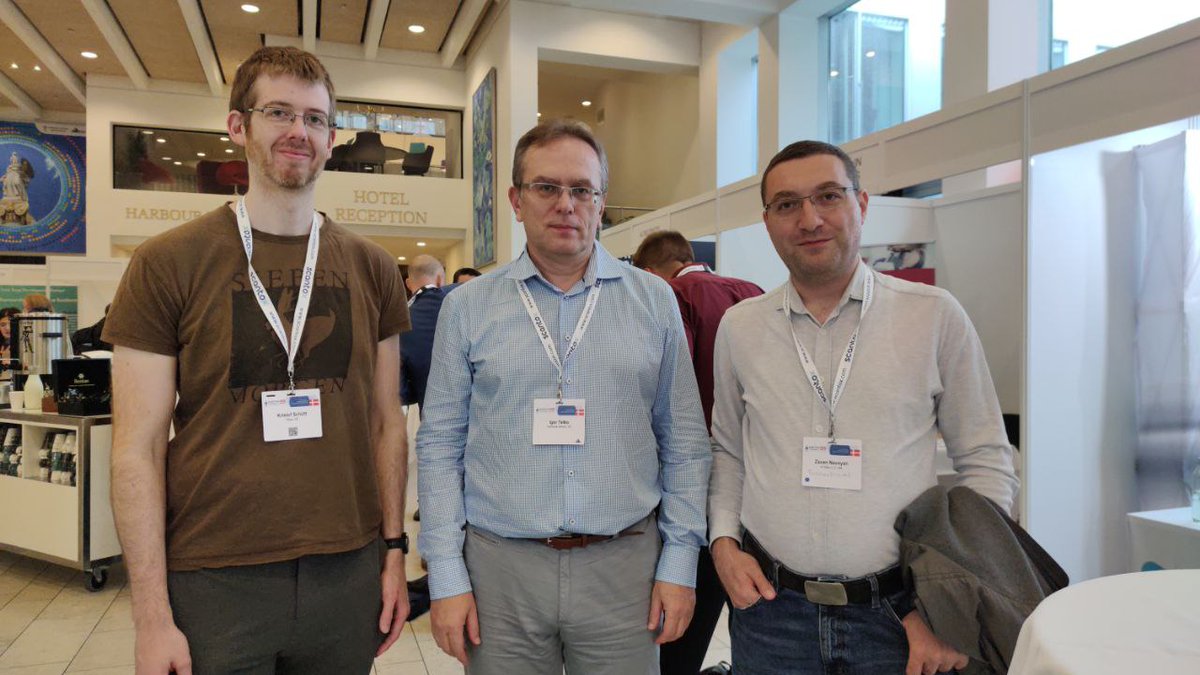
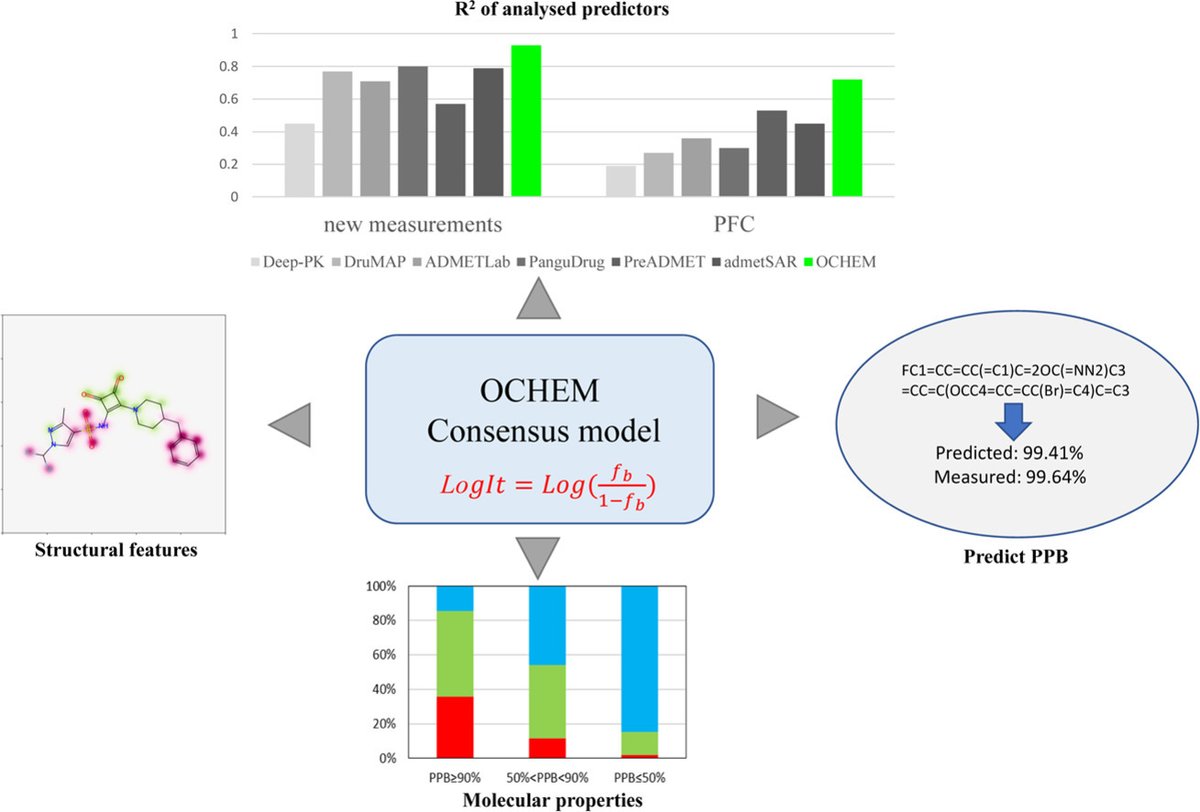
Our modeling work with Dr. Igor Tetko @AiddOne , which focuses on Plasma Protein Binding (PPB), has been published in the official journal of EUFEPS @eufeps . doi.org/10.1016/j.ejps.2024.…
It is interesting to see that LogIt improves prediction accuracy for high-PPB compounds.
1
3
4
176
https://bsky.app/profile/aidd.bsky.social retweeted
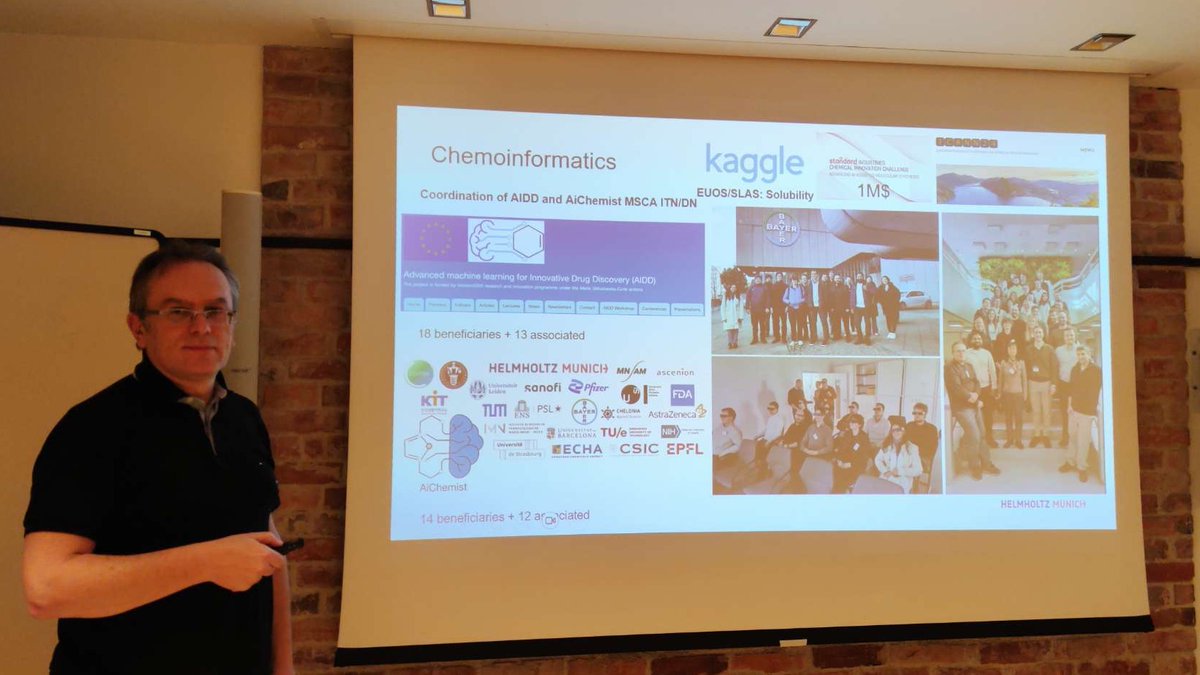
Igor Tetko explains AiChemist and @AiddOne projects to PIs of helmholtz-munich.de/en/molec… from @HelmholtzMunich and speaks about excellent career perspectives of Doctoral Candidates trained within @MSCActions
2
10
382
https://bsky.app/profile/aidd.bsky.social retweeted

23 Nov 2024
Chemists often combine many different techniques to elucidate structures. @adrian_mirza_ has been building a system that mimics this using machine-learning models and genetic algorithms.
3
23
75
6,004
https://bsky.app/profile/aidd.bsky.social retweeted

17 Nov 2024
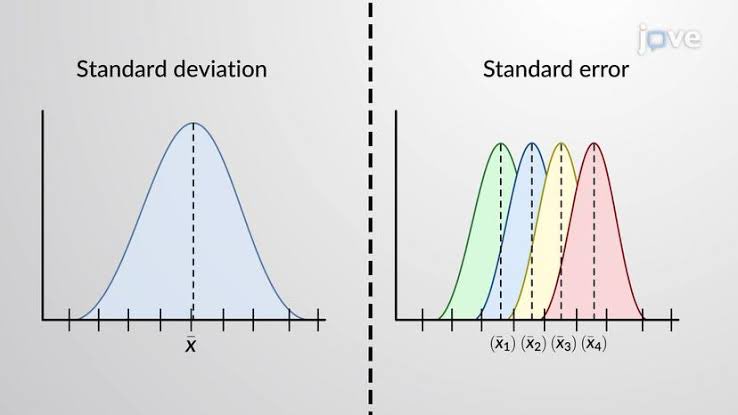
Understanding the difference between Standard Deviation (SD) and Standard Error (SE) is crucial for accurate data interpretation. SD measures the variability within your data, indicating how spread out the individual data points are from the mean.
In contrast, SE measures the uncertainty around the sample mean as an estimate of the population mean. It reflects the precision of the mean, with SE decreasing as the sample size increases, making your estimate more reliable.
The relationship between SD and SE is given by the formula: SE = SD / √(sample size). While SD remains relatively constant with larger samples, SE diminishes, highlighting the reduced uncertainty in the mean estimate.
A common mistake in research is using the “±” notation without specifying whether it refers to SD or SE, leading to potential misinterpretation of the data. Clear distinction is essential for transparency and accuracy in reporting.
Key Takeaways:
• Use SD to describe data variability.
• Use SE to indicate the precision of the mean.
• Always specify which measure you are reporting.
43
1,160
6,484
582,427
https://bsky.app/profile/aidd.bsky.social retweeted

18 Nov 2024
There’s a new Practical Cheminformatics post, “Some Thoughts on Dataset Splitting,” (with code and a robot cartoon) at practicalcheminformatics.blo…
9
51
3,190
https://bsky.app/profile/aidd.bsky.social retweeted
What was a busy week! After lecture and participation to PhD defense at Shenzhen Institute of Advanced Technology, I had seminar at Peking Union Medical College followed by lecture at Beijing University of Chemical Technology to @AiddOne partner, Prof. Yan ai-dd.eu/aixia
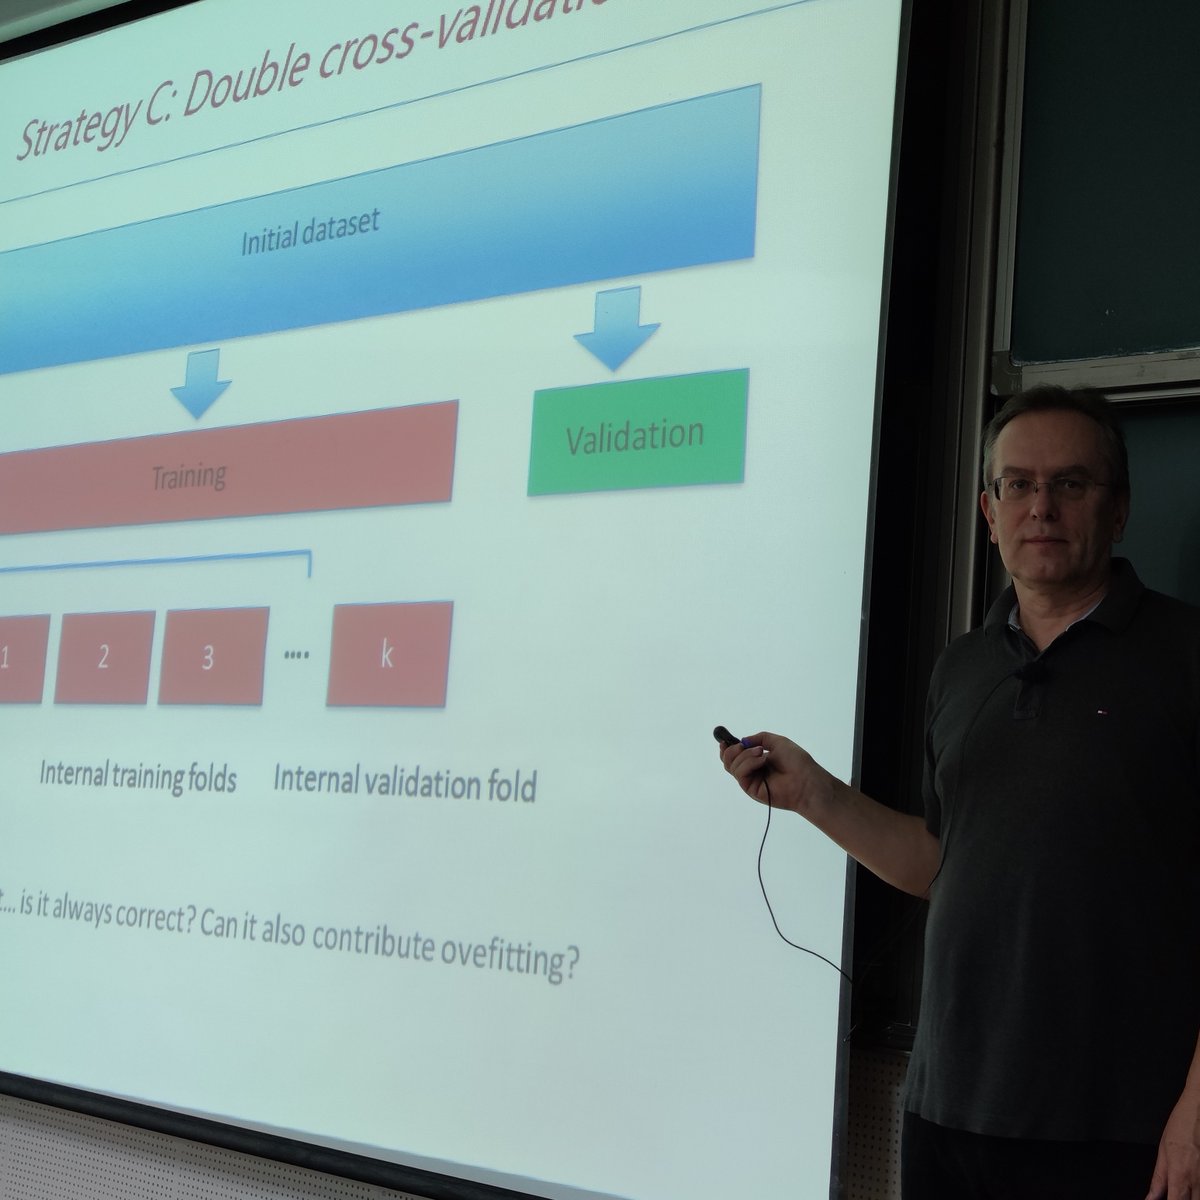
ALT Lecture of Igor Tetko at BUCT
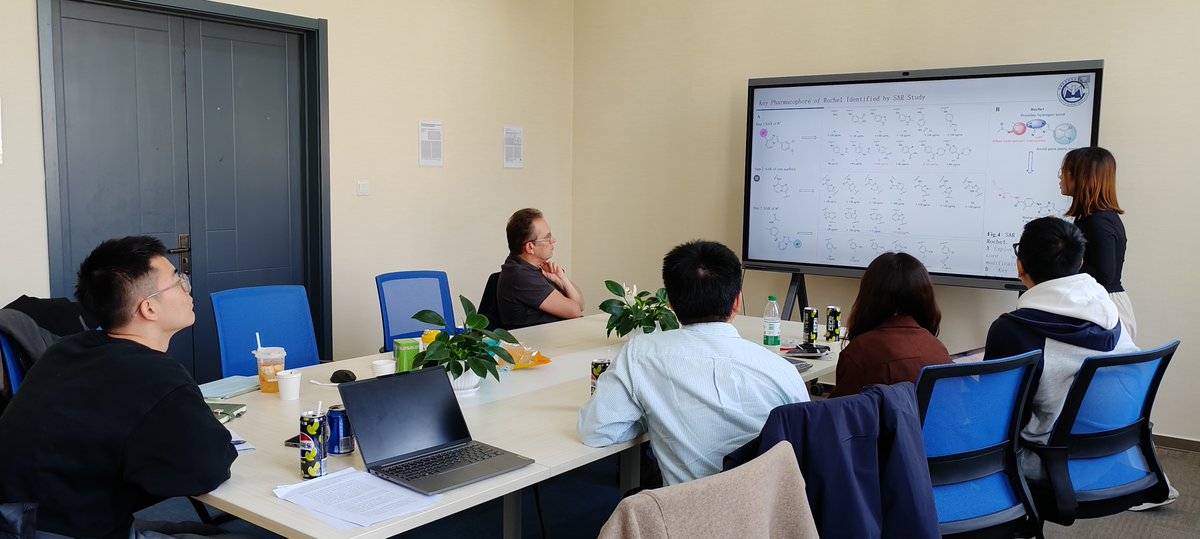
ALT Seminar at Institute of Materia Medica, Chinese Academy of Medical Sciences & Peking Union Medical College: student reports her work
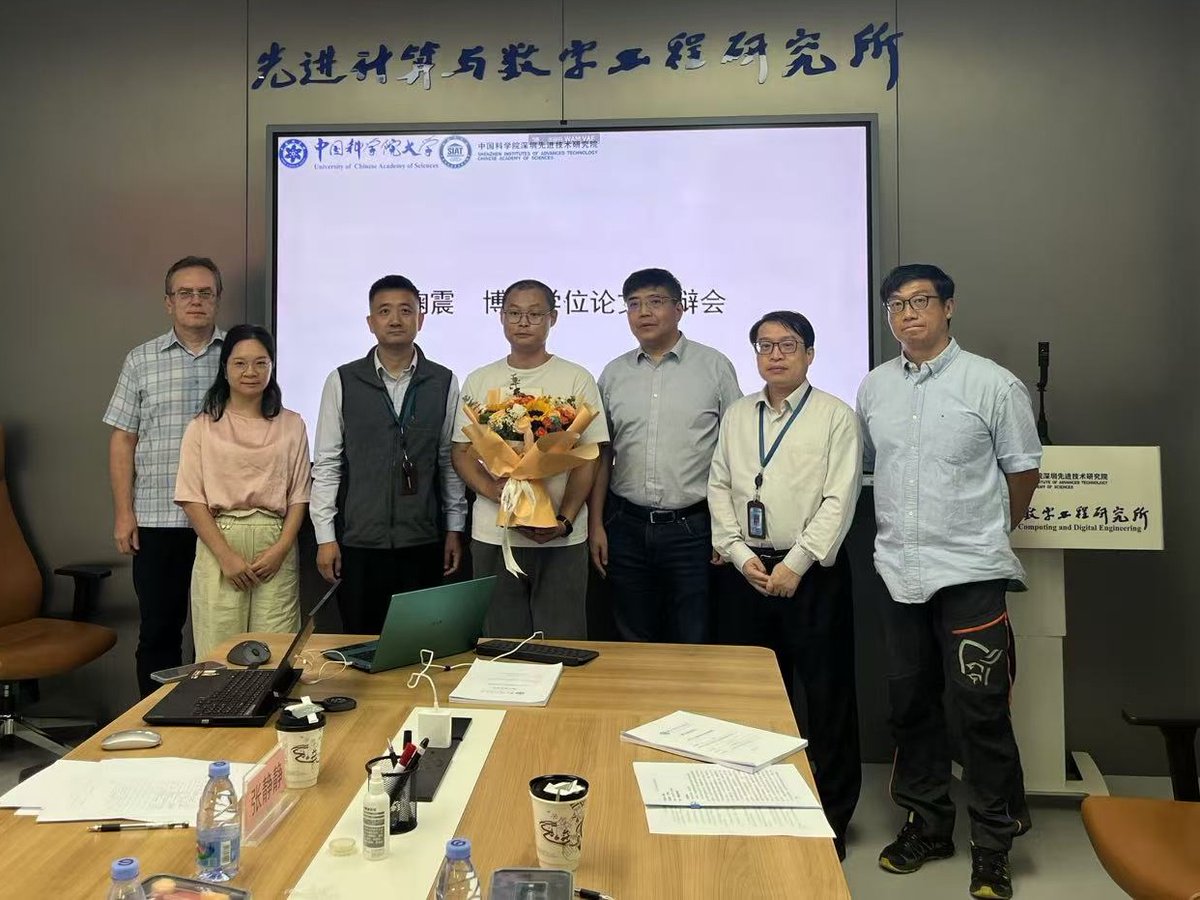
ALT After PhD defence of Dr. Ju Zhen at Shenzhen Institute of Advanced Technology.
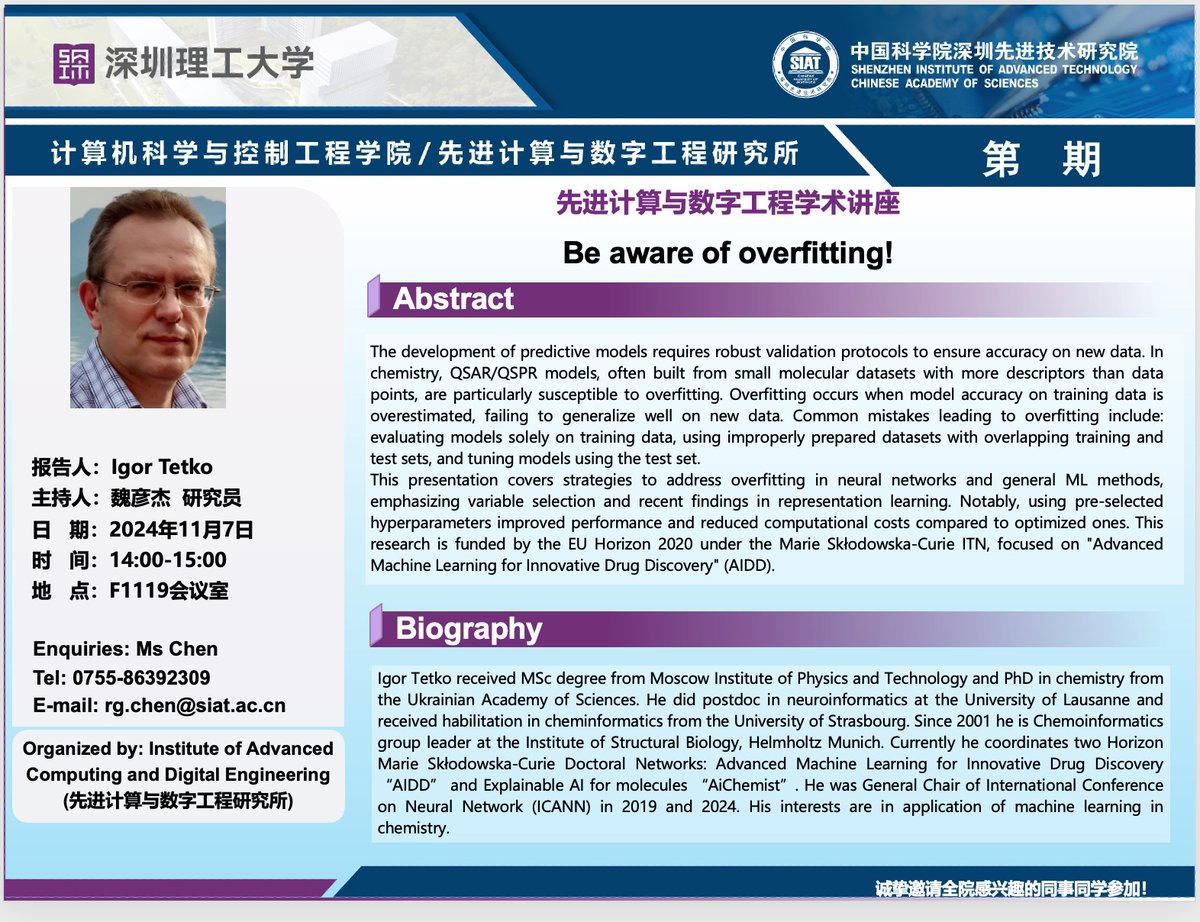
ALT Announcement of a lecture at Shenzhen Institute of Advanced Technology.
2
9
550
https://bsky.app/profile/aidd.bsky.social retweeted
30 Oct 2024
ELLIS ML4Molecules DEADLINE IN TWO DAYS!
Consider submitting your current works as extended abstracts or short papers to ML4Molecules 2024:
DEADLINE IS NOVEMBER 1.
moleculediscovery.github.io/…

4
8
647
https://bsky.app/profile/aidd.bsky.social retweeted
Congratulations our PI with another great success!
24 Oct 2024

Thrilled to receive a @NWONieuws Vidi grant!🚀We will push the boundaries of #ML in drug discovery via ‘chemistry-centered’ innovation.💪🏻
Huge thanks to my colleagues @TUeindhoven, the awesome @molecularML team and my incredible partner for their support!
tue.nl/en/news-and-events/ne…
1
5
340