
Joined June 2023
- Tweets 3,019
- Following 207
- Followers 14,443
- Likes 2,320
1,619 Photos and videos


Pinned Tweet
Alphractal's CEO, @joao_wedson , walks through Workbench. 🎥
One metric, from raw idea to a saved, fully custom chart: styled, pinned to a dashboard, and questioned with Alpha IA, without leaving the page. A clear, first-hand look at how it works.
Save it, always one tap away.
2
5
23
1,345
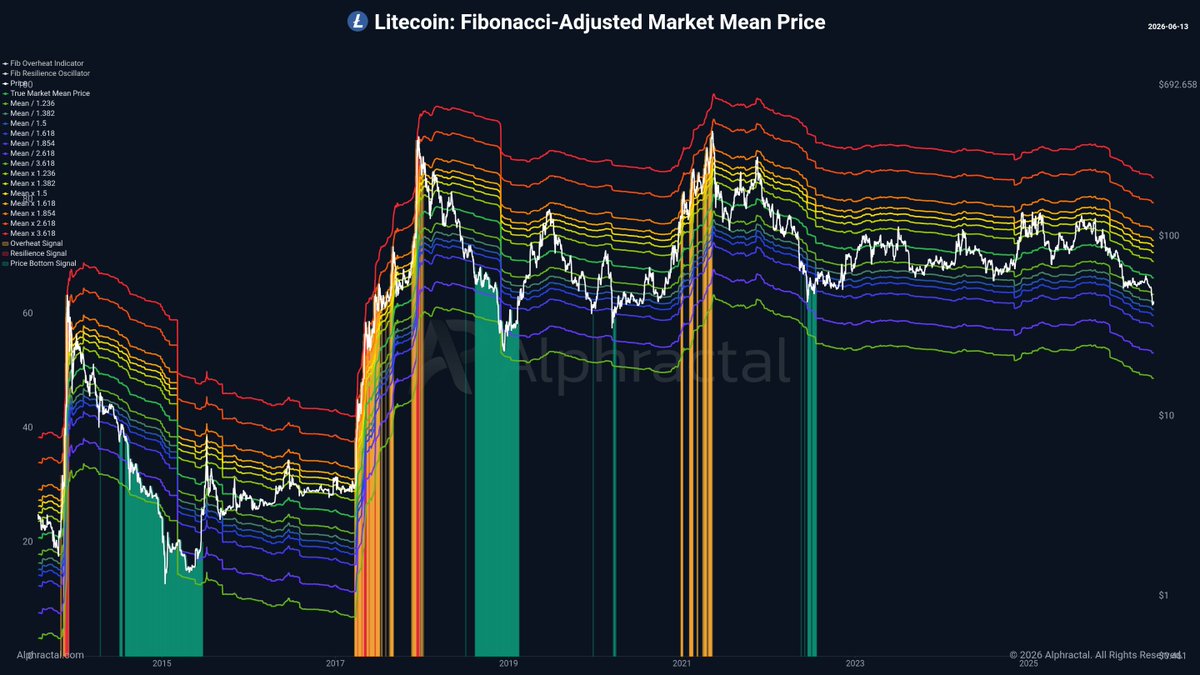
Litecoin is entering an important region of the cycle.
LTC is now revisiting the lower levels of the Fibonacci Adjusted Market Mean Price, a metric that uses the Market Mean Price as its base and builds Fibonacci proportional bands to map expansion zones, mean reversion areas, and accumulation regions.
Historically, during periods of stronger market stress, Litecoin’s price has reached the lowest band, highlighted in green. In other moments, it found support in the blue regions, which also marked relevant value areas across previous cycles.
At the current moment, LTC has just touched the first lower level of this model, entering a possible accumulation zone once again.
The upper bands are usually associated with overheated phases and distribution risk. The lower bands tend to represent regions where the asset starts to look discounted relative to its structural mean.
On a logarithmic scale, it becomes clearer how Litecoin is once again approaching zones that, in the past, required attention from long term investors.
LTC is weak, but extreme weakness is also where cycles begin to form value.

3
1
23
4,223
Don’t waste time. Ask Alpha AI for free right now how your favorite crypto is doing and get incredible insights.
See more at Alphractal.com
3
702
Alphractal's CEO, @joao_wedson , walks through Workbench. 🎥
One metric, from raw idea to a saved, fully custom chart: styled, pinned to a dashboard, and questioned with Alpha IA, without leaving the page. A clear, first-hand look at how it works.
Save it, always one tap away.
2
5
23
1,345
Any metric, any asset, your chart, saved and ready to pin.
Try Workbench now:
alphractal.com?utm_source=tw…
3
777

Jun 12
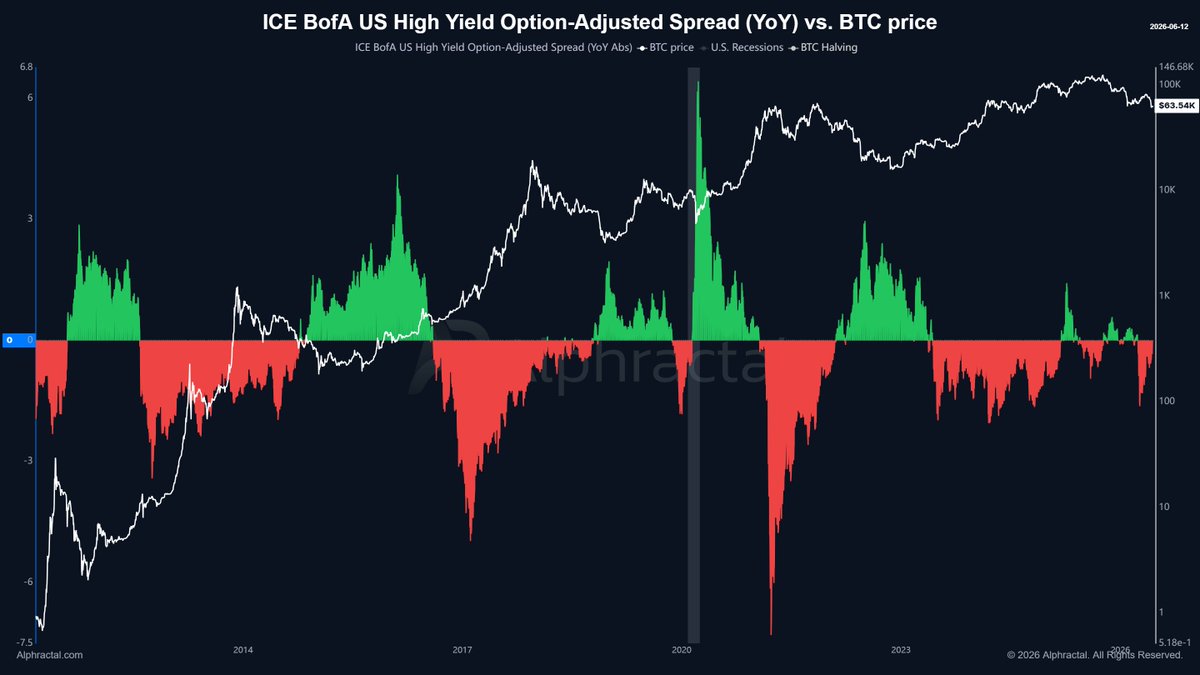
When the annual change in the ICE BofA US High Yield Option-Adjusted Spread turns positive, Bitcoin tends to weaken.
And this change is rising again!
This indicator measures the extra premium investors demand to buy high-risk U.S. corporate bonds compared to Treasuries.
When it rises on an annual basis, the signal is simple. The market is demanding more return to take on risk.
This usually reflects worsening credit conditions, lower appetite for speculative assets, and a less favorable environment for BTC.
Bitcoin does not react only to the halving or narratives, it also reacts to liquidity, credit, and global risk perception.
As long as this YoY spread continues to push higher, the market tends to become more defensive.
Come explore our huge collection of macroeconomic charts at Alphractal.com
2
3
42
5,572
Alphractal retweeted

Jun 12
$BTC: Volatility Re-Expansion Echoes a Prior Bear-Market Sequence
Bitcoin’s 30-day realized volatility is re-expanding from its late-May compression low.
In the previous bear cycle, major downside phases were marked by a sequence of progressively higher local volatility peaks, although the progression was not linear.
Sustained compression emerged only later, after BTC stabilized within a lower price range.
The current cycle shows a comparable early sequence: a higher local volatility peak during the March decline, sharp compression into late May, and renewed expansion now.
The latest reading remains below the March peak, so another higher volatility peak has not yet been confirmed.
Volatility is not directional by itself. However, when expansion resumes while the broader market structure remains weak, the risk of wider downside swings increases if that weakness persists.
Current conditions are therefore more consistent with renewed instability than with the sustained low-volatility environment typically associated with market stabilization and accumulation.

2
3
28
2,184
Jun 12
Google searches for cryptocurrencies are rising again in June.
This is a sign that retail investors are starting to search more about different crypto assets and catch up with the market again.
Spikes in Google Trends are also often related to moments of euphoria and fear.
Track more sentiment metrics at Alphractal.com.
2
31
5,046
Alphractal retweeted

Jun 11
Dogecoin is already forming a price bottom according to several on-chain metrics.
Last week, I mentioned that buying DOGE below $0.08 could be an excellent strategy.
Here is another chart to complement that view.
The Bubble Risk metric is very powerful because it evaluates the probability of speculative bubble formation by combining the price-to-realized price ratio at 30%, Alpha Price deviation at 30%, and the CVDD ratio at 40%.
It was designed to flag unsustainable valuations where market exuberance may lead to corrections, and it is calculated from the 6th record onward for greater stability.
In Dogecoin’s case, this metric gives strong weight to three of the most important DOGE valuation models, and it is now in a price bottom formation region.
The Alpha is here. Do not ignore it.

Jun 11

3
10
81
6,073
Alphractal retweeted
Jun 11
NEAR whales still prefer shorts, while retail is doing the opposite.

Jun 11

2
2
43
3,464
Alphractal retweeted
Jun 11
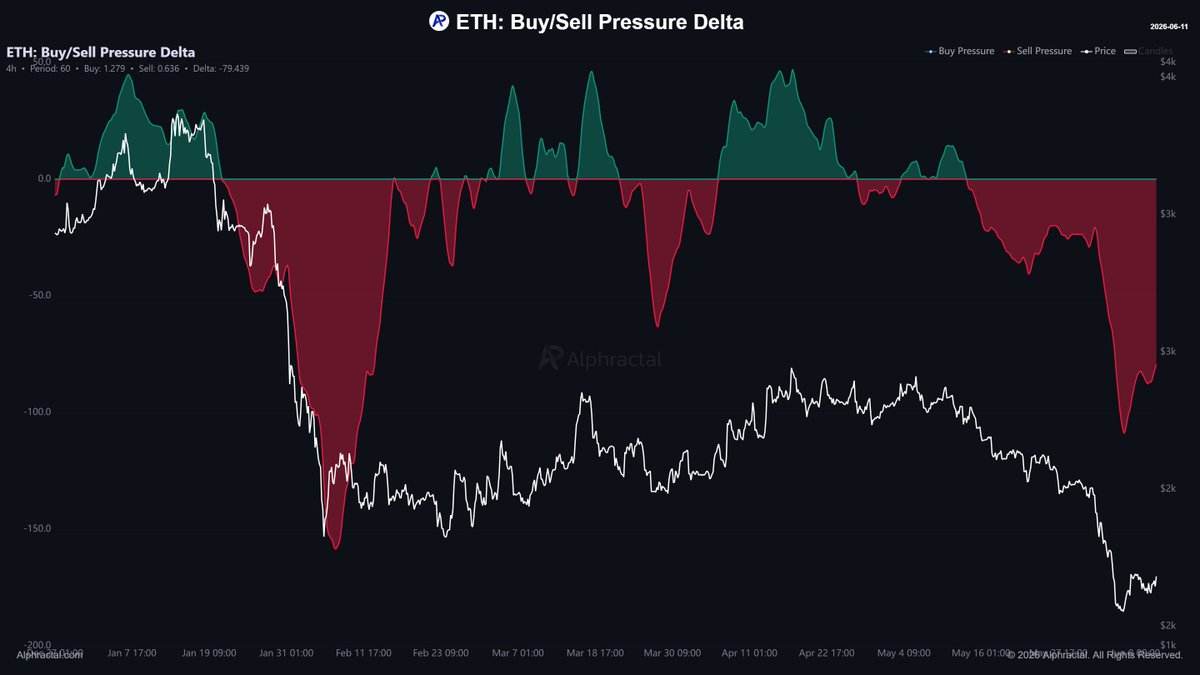
⚠️Selling pressure on ETH has been exhausted.
A price recovery attempt will likely be driven by renewed buying pressure.
In addition, the last major liquidation pool has already been hit on ETH.
Anxious bulls were liquidated, which means stronger hands may now be able to accumulate more calmly.
Follow the Alpha. That is all.


Jun 11

I swear just after posting, same idea came to my mind 😅😅😅
9
12
134
8,501
Alphractal retweeted

Jun 10
The 30-Day Active Supply Ratio of $BTC is falling to the bottom zone.
- The chart shows that the amount of $BTC circulated over the past 30 days is shrinking significantly, retreating close to the 0.06 mark. According to historical data, peak distribution phases are often accompanied by a surge in short-term supply.
- Conversely, the current trough clearly reflects that selling pressure has weakened and holding sentiment is dominating. With the $BTC price hovering around $61.9K, the market is in a phase of liquidity compression and accumulation.

1
9
865
Jun 11
New Alphractal’s Report: In May 2026, an AI audit found a critical cryptographic vulnerability in Zcash.
The price reacted. The chain didn't.
The team shipped an emergency upgrade, adding a turnstile accounting mechanism that mathematically verifies the supply, privacy intact, integrity now provable.
1
1
7
1,286
Jun 11
The Alpha Squad keeps growing, and today we're excited to welcome @_Crypto_glass as Alphractal's newest official ambassador.
With a sharp eye for analysis and a genuine passion for the markets, ZizCrypto joins our ecosystem to share insights, educate, and bring even more value to the people who follow Alphractal.
Welcome to the Alpha Squad. 🚀
1
2
9
4,231
Alphractal retweeted

Jun 10
One metric has nailed Ethereum $ETH last two market bottoms: Delta Price by @Alphractal.
Today, it sits near $700.
Since Delta Price reflects the relationship between investor cost basis and miner production cost, it has consistently highlighted deep accumulation zones.
If history rhymes, Ethereum could revisit $700 before the next sustained uptrend.


24
33
189
26,808
Jun 10
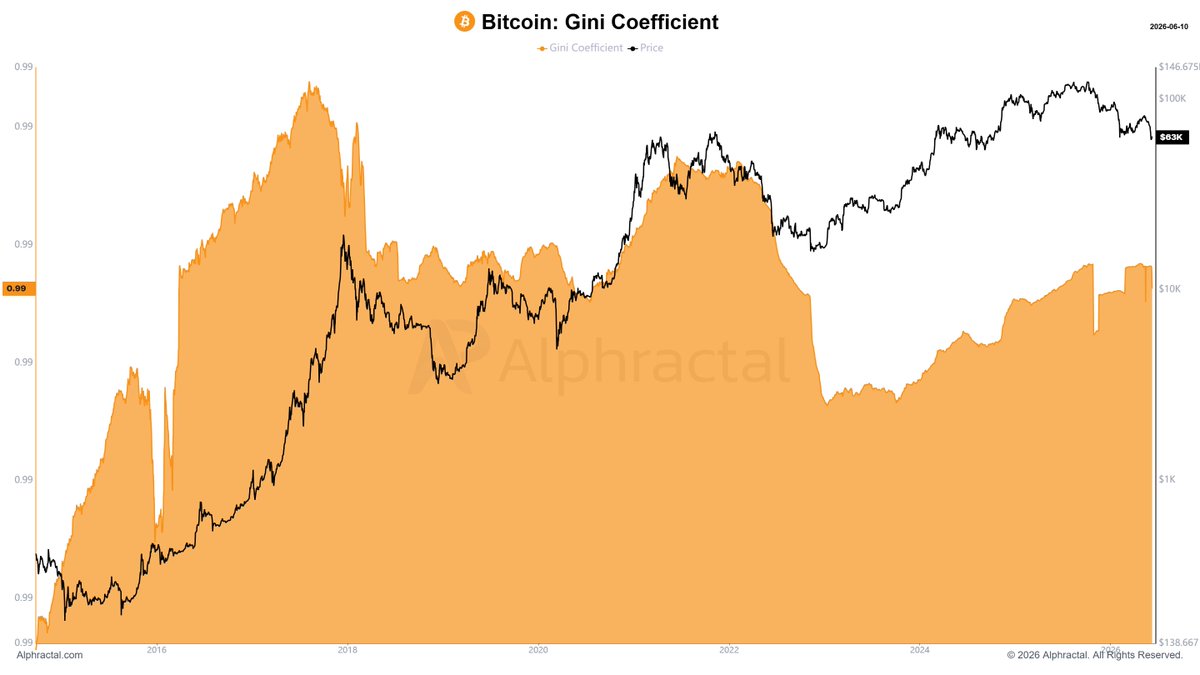
Bitcoin’s Gini Coefficient measures the level of supply concentration across wallets.
When it rises, it means BTC is becoming more concentrated in large addresses, such as whales, custodians, ETFs, or exchanges.
When it falls, it means the supply is becoming more distributed across different market participants.
The interesting point is that the Gini Coefficient has stopped rising since October 2025, when Bitcoin was reaching its all-time high.
In other words, since that top, the coefficient has stopped moving higher.
Gini rising = higher concentration.
Gini falling = higher distribution.
A simple metric to track how Bitcoin’s supply is moving across cycles.
Alphractal.com
1
3
32
7,138
Jun 10
Bitcoin’s Long/Short Ratio is rising, while altcoins have not changed much.
BTC is currently at 1.9, based on the average across several exchanges, while 230 altcoins are averaging 1.65, with a slight decline over the last 24 hours.
In other words, even though traders are currently showing more interest in long positions across the market, that interest is stronger in Bitcoin.
However, when long interest increases too much, price often moves lower to liquidate those traders, and that is exactly what we have seen over the past few weeks.
As long as long interest remains elevated, the most likely scenario is sideways price action or further downside.
But the downside risk appears higher for BTC than for altcoins, since altcoins are showing lower Long/Short Ratio levels.
Track this more closely and ask Alpha AI how your favorite crypto is positioned across derivatives, on-chain data, and sentiment.
The insights can be fascinating.
5
4
48
3,144
Alphractal retweeted
Jun 10
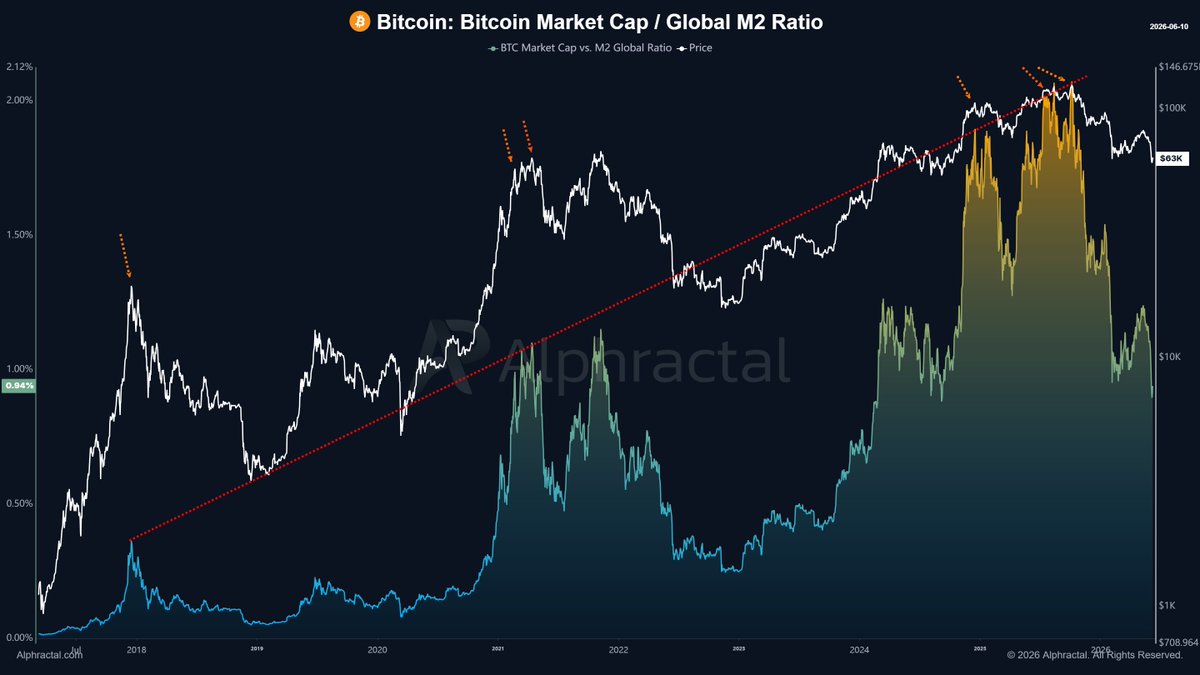
Bitcoin Market Cap / Global M2 Ratio has been marking Bitcoin price tops with impressive accuracy.
And the trendline makes this very clear.
Currently, Bitcoin’s market cap represents only 0.94% of Global M2.
This means that even after multiple cycles, ETFs, institutional adoption, and more than 15 years of history, Bitcoin has still captured less than 1% of global monetary liquidity.
But here is the key point:
At the last major top in October 2025, Bitcoin represented exactly 2% of Global M2.
In other words, this ratio helps us understand when Bitcoin is becoming overheated relative to global liquidity, and when it is losing monetary share again.
It is a simple, visual, and powerful way to analyze the relationship between the crypto market and global monetary policy.
Liquidity drives cycles.
And this chart helps reveal where Bitcoin stands inside that cycle.
9
18
142
6,478
Alphractal retweeted
Jun 9
Introducing WORKBENCH 🚀
The most flexible charting experience ever built on Alphractal.
Create fully custom charts from any combination of metrics and assets, style them your way, save them to your account, add them to dashboards, and even chat with Alphractal about your analysis.
• Build from any metric
• Line, Area, Scatter, Bubble, Heatmap & Gradient charts
• Advanced styling and metric parameters
• Cloud-saved and synced across devices
• Add custom charts directly to your dashboards
• AI-powered chart analysis built into Workbench
2
2
11
4,582