
Joined February 2026
- Tweets 65
- Following 44
- Followers 12
- Likes 65
Photos and videos

Jun 15
Shortages are the visible symptom.
The deeper story is usually dependence: where substitution is weak, where coordination is fragile, and where an entire system turns out to rely on a narrower path than it seemed.
That is what bottlenecks often reveal.
open.substack.com/pub/amorec…
6
May 18
📊 Goldman Sachs Alert: S&P 500 Hits 14 New Highs… But Market Breadth Is Collapsing
The S&P 500 has registered 14 new highs in the past month, yet market breadth continues to deteriorate sharply.
A handful of tech/AI mega-caps (likely the usual suspects) have driven nearly all the gains — the vast majority of stocks are being left far behind.
Goldman’s Momentum Factor GSMEFMOM
(long top 20% of S&P 500 stocks by past 12-month returns, short bottom 20%, equal-weighted, monthly rebalance):
25% in the past 3 months — one of the most extreme surges on record.
Exhibits 3 & 4 show the market concentration is now approaching levels last seen at the peak of the 2000 Tech Bubble.
Historically, such extreme momentum almost always appears in the late stages of a bull market:
- Short-term momentum can persist
- But when it breaks, the reversal is often sharp and swift
Outlook remains highly uncertain. Watch macro liquidity, rates, and AI capex/earnings realization closely.
⚠️ Not investment advice — purely a market structure observation.
#USStocks #MarketBreadth #Momentum #ConcentrationRisk

2
40
May 16
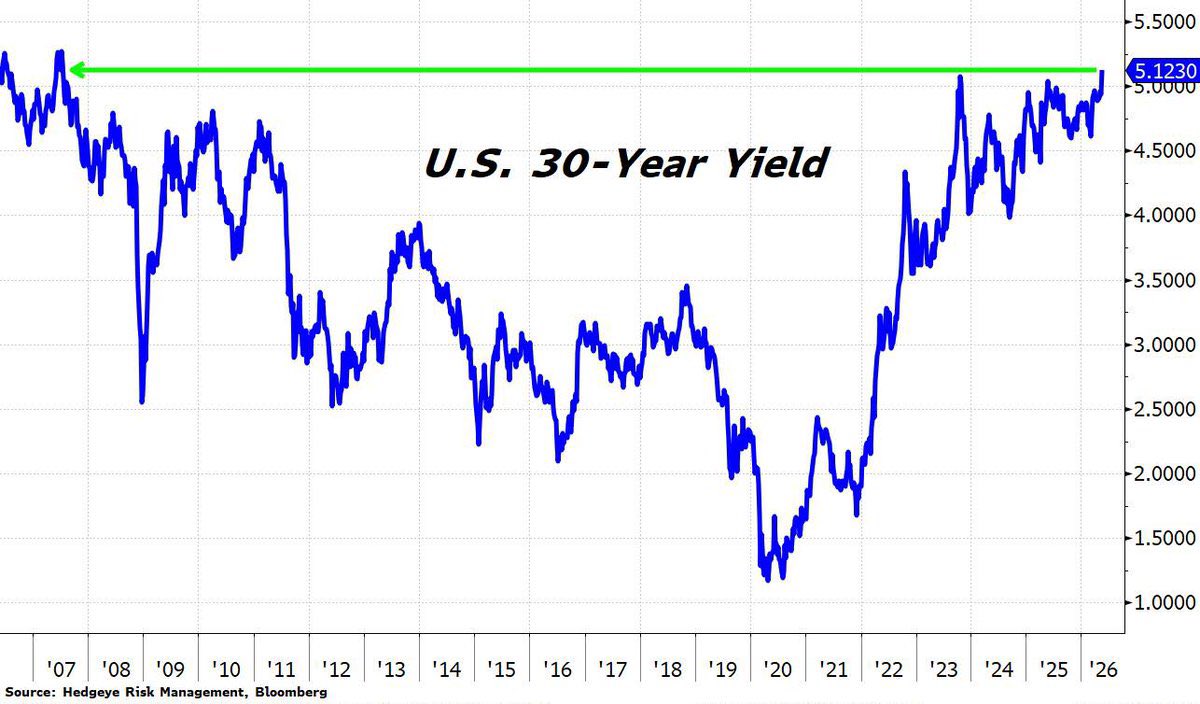
U.S. 30-year Treasury yield has risen to approximately 5.123%, the highest level since 2007.
After a prolonged decline following the financial crisis and hitting a low of around 1% during the 2020 pandemic, it has rebounded significantly with inflation resurgence and returned to pre-crisis highs.
This signals the structural end of the low-rate era and the onset of a "higher for longer" interest rate environment. It will push mortgage rates higher, increase federal debt burdens, and suppress equity valuations via elevated discount rates.
📈
@Hedgeye
1
2
43
May 14
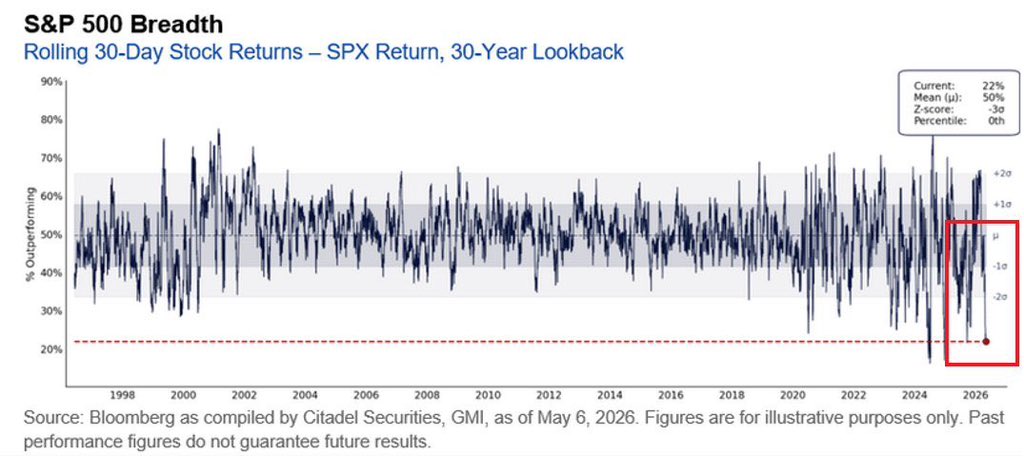
📉 Amore Capital insights | S&P 500 Market Breadth Reaches 30-Year Extremes
As of May 13, 2026, only 22% of S&P 500 constituents outperformed the SPX on a rolling 30-day basis. This breadth indicator stands at a Z-score of -3.0, corresponding to the 0th percentile of its 30-year historical distribution (historical mean: 50%).
Such extreme narrowness has historically emerged in late-stage bull markets, typically accompanied by liquidity-driven rallies and highly concentrated leadership.
Although a handful of large-cap leaders may continue to propel the index in the short term, the current concentration markedly elevates tail risks ⚠️. A slowdown in leadership momentum could precipitate sector rotation or a broader price correction.
In this environment of limited market participation, portfolio diversification and rigorous risk management are particularly critical.
(Source: Citadel Securities / GMI, Bloomberg | Chart attached)
#SPX #MarketBreadth #EquityMarkets
2
379
May 10
🧵 Amore Capital Insights 📈
BlackRock 2026 Spring Investment Directions – 10 Key Charts Reimagined
This 26-page visual macro report spotlights 2026 trends in energy geopolitics, inflation, jobs, valuations, fixed income, and investor flows. Fresh forward-looking breakdown based on the original figures:
1/10 🌍
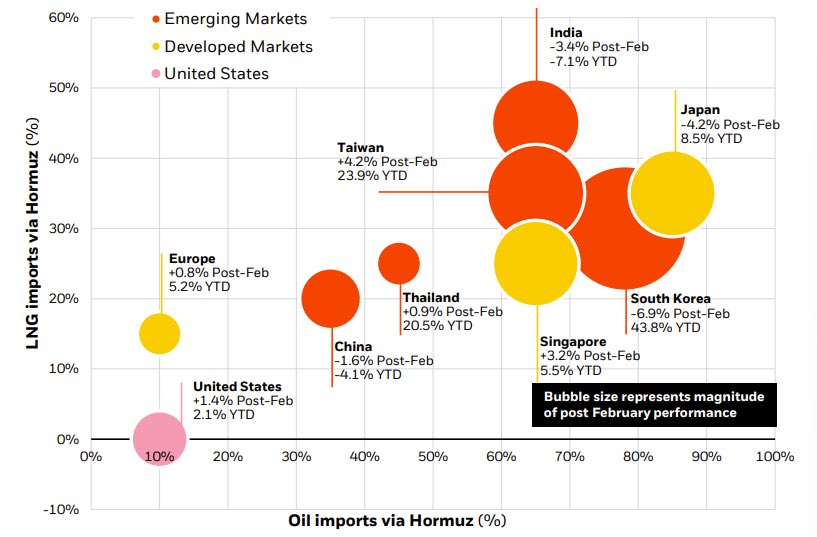
Energy Geopolitics & Regional Market Performance
Bubble chart maps each country/region’s reliance on crude oil and LNG imports through the Strait of Hormuz (x/y axes) against market returns from late Feb to mid-Apr. High-exposure economies like India, South Korea and Taiwan delivered strong gains despite risks, while the US sits comfortably in the low-risk zone. Energy security is now a core pricing factor.
1
5
53
May 10
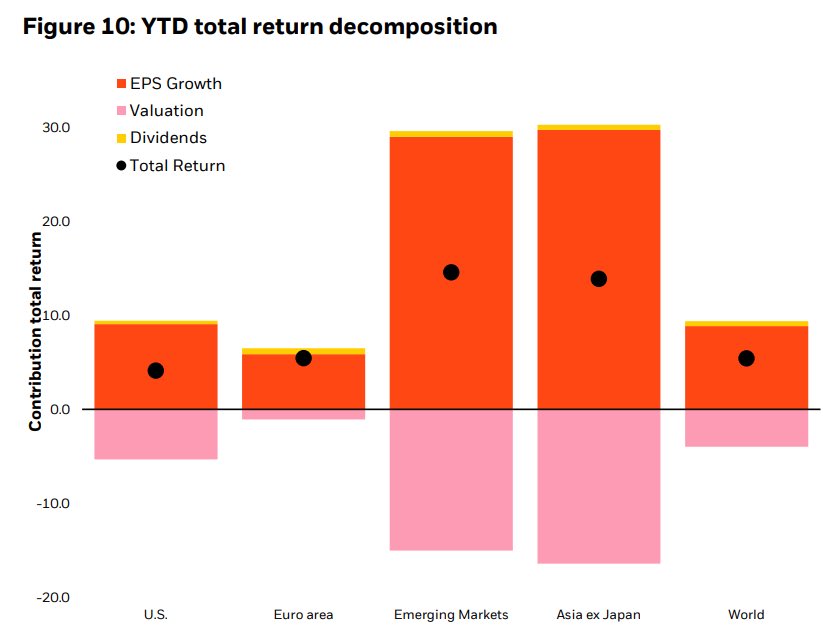
9/10 💹
Stock Returns Driven by Earnings Growth
Year-to-date total returns across major equity markets have been powered primarily by EPS expansion rather than multiple expansion – underscoring that fundamentals, not valuation rerating, remain the key driver.
1
4
16
May 10
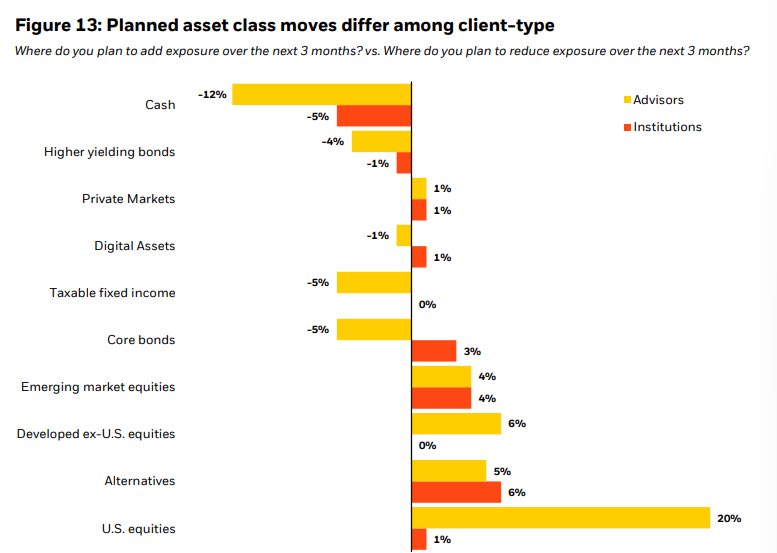
10/10 📊
Institutional & Advisor Positioning Shift
Most wealth advisors and institutional investors plan to increase equity exposure and reduce cash holdings over the next 3 months, signaling a broader move from defensive to more risk-on positioning.
Amore Capital Insights 📌
In an environment shaped by energy shocks, sticky inflation, and AI-driven capex, BlackRock advocates a whole-portfolio approach: lean on EPS growth, higher fixed-income income, and private markets for better resilience.
Copy-paste ready for X – just attach the matching report chart to each post! Want the full PDF link or deeper dive on any chart? Drop a comment 🔥
4
22
May 9
📢 Cleveland Fed posting basic inflation explainers?
This is literally their official mandate — educating the public on economics.
All 12 regional Fed banks do this. Not just Wall Street.
@ClevelandFed
May 8

Production costs surge → Producers raise prices = Inflation rises, even when demand stays flat. This is cost-push inflation. Examples: oil shocks, labor shortages, the pandemic shutdown. See the breakdown: clefed.org/4roe6uQ

ALT Cost-Push Inflation Graph
5
80