
This page is all about chemistry and biochemistry
Joined September 2019
- Tweets 473
- Following 406
- Followers 161
- Likes 1,688
9 Photos and videos


Biochemistry retweeted

Apr 15
We have positions opening in September 2026:
-Postdoc in Structural Biology
-PhD in Natural Product Biosynthesis & Bioengineering
Join us in Basel – great colleagues, competitive salary, and an outstanding pharma & biotech ecosystem. Interested? Please rt (links below)!
2
19
67
5,832
Biochemistry retweeted

1 Dec 2024
🎓 Scholarships at Uppsala University! 🌟 Apply for tuition fee scholarships for international Bachelor's and Master's students. Join Sweden’s top university. 📅 Deadline:15 Jan. Details: wp.me/p23f03-bRc
#Scholarships #StudyAbroad #UppsalaUniversity
16
51
3,664
Biochemistry retweeted

4 Nov 2024
Molecular dynamics simulations in mixed reality!
With @labriataphd and @lucien_krapp we’re scaling our multi-user WebXR platform to enable immersive molecular simulations, fully based on web technologies.
Stay tuned, lots of cool stuff coming soon!
@threejs #WebXR #Quest3
50
591
2,775
269,035
Biochemistry retweeted

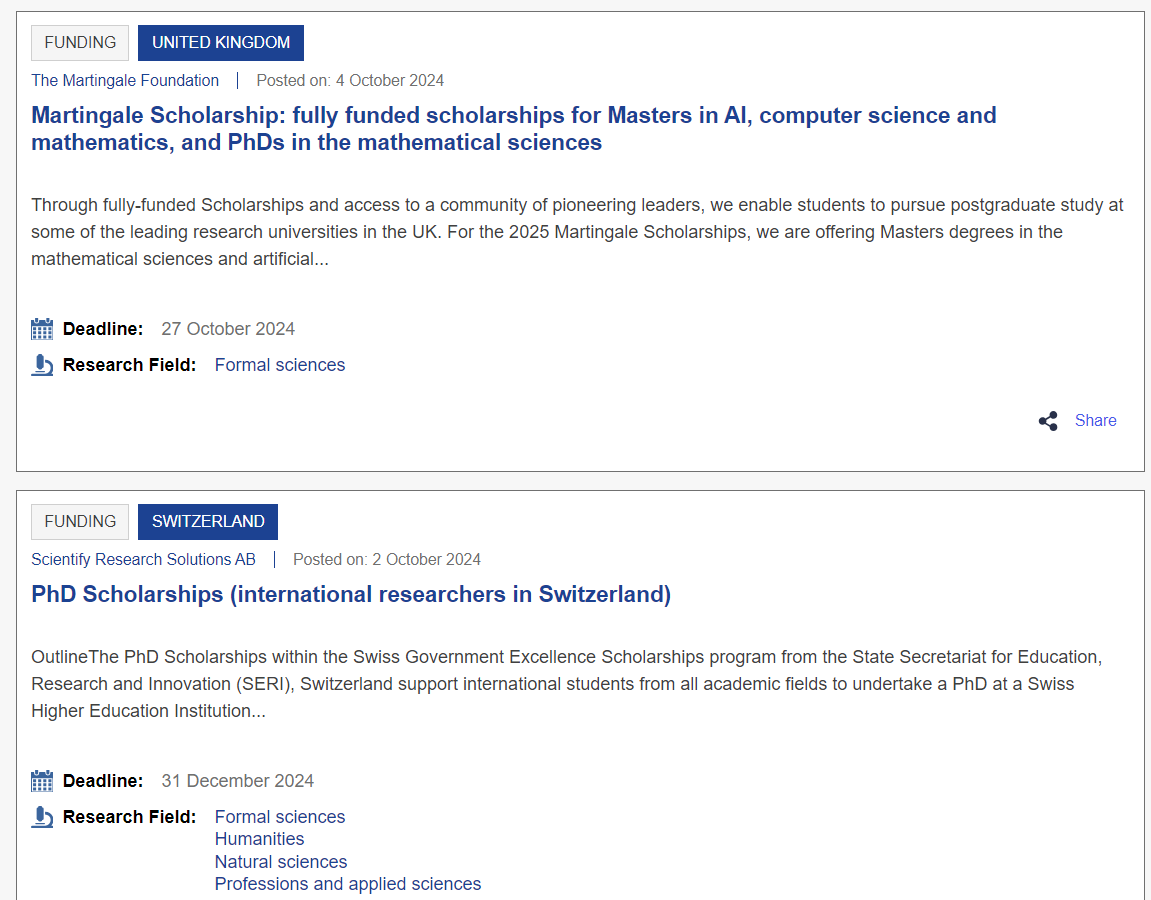
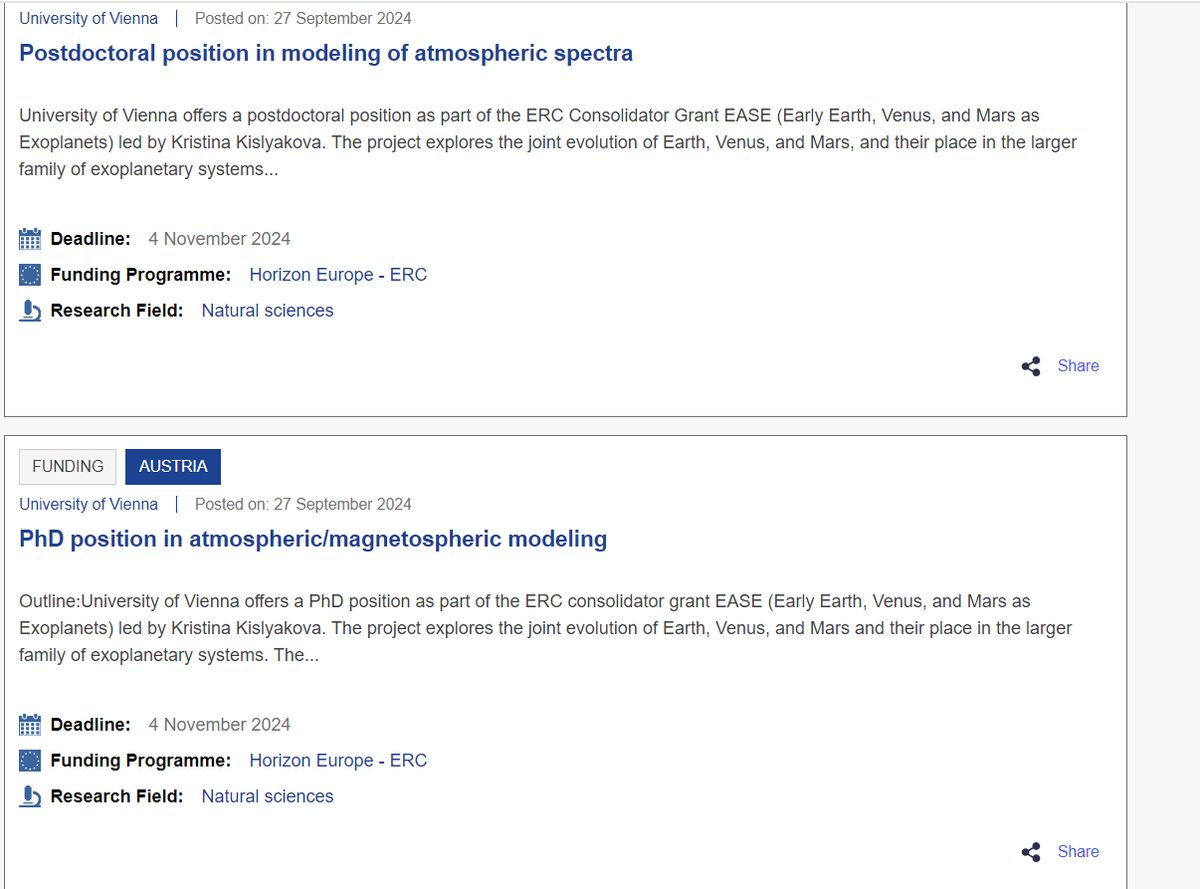
5 Oct 2024
If you are looking for fully funded master's, PhD, and postdoc opportunities in Europe, I highly recommend exploring the Euraxess database. Give it a try, and you will thank me later!
euraxess.ec.europa.eu/jobs/s…
13
299
980
126,571
Biochemistry retweeted

26 Aug 2024
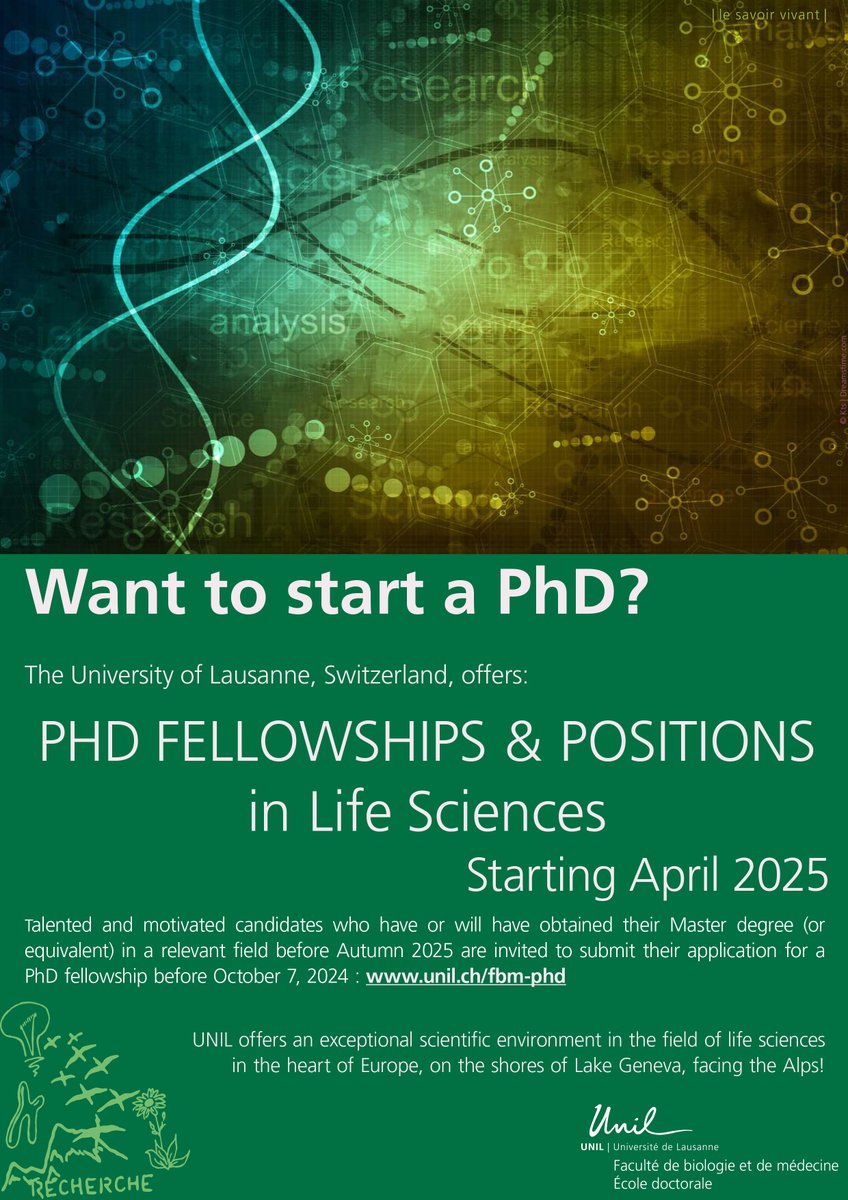
Interested in applying for a fellowship to do a PhD @unil with my lab (bacterial synthetic biology) as a host? Send me a CV and a motivation letter till September 6th!
unil.ch/ecoledoctoralefbm/en…
6
194
455
69,630
Biochemistry retweeted

12 Aug 2024
Google is now paying $ 3000/month to use the Internet for 3 hours per day
You can also make, If you have:
1] Time
2] Mobile
3] Internet
I have prepared a guide
[FREE for First 500 People]
To get it:
👉🏻Retweet
👉🏻Reply “send”
👉🏻Like
[ Must be following @ahuja_priyank]

778
490
744
135,141
Biochemistry retweeted

4 Aug 2024
Salary won't make you rich.
I've listed 49 passive income ideas to earn while you sleep.
All you need is:
- Smartphone/PC
- Internet
- 2-4 hours a day
Repost & reply "Send" to get it for free.
[Must be following] so that I can DM you.
[Only for first 500 people].

1,206
525
822
295,493
Biochemistry retweeted

17 Jul 2024
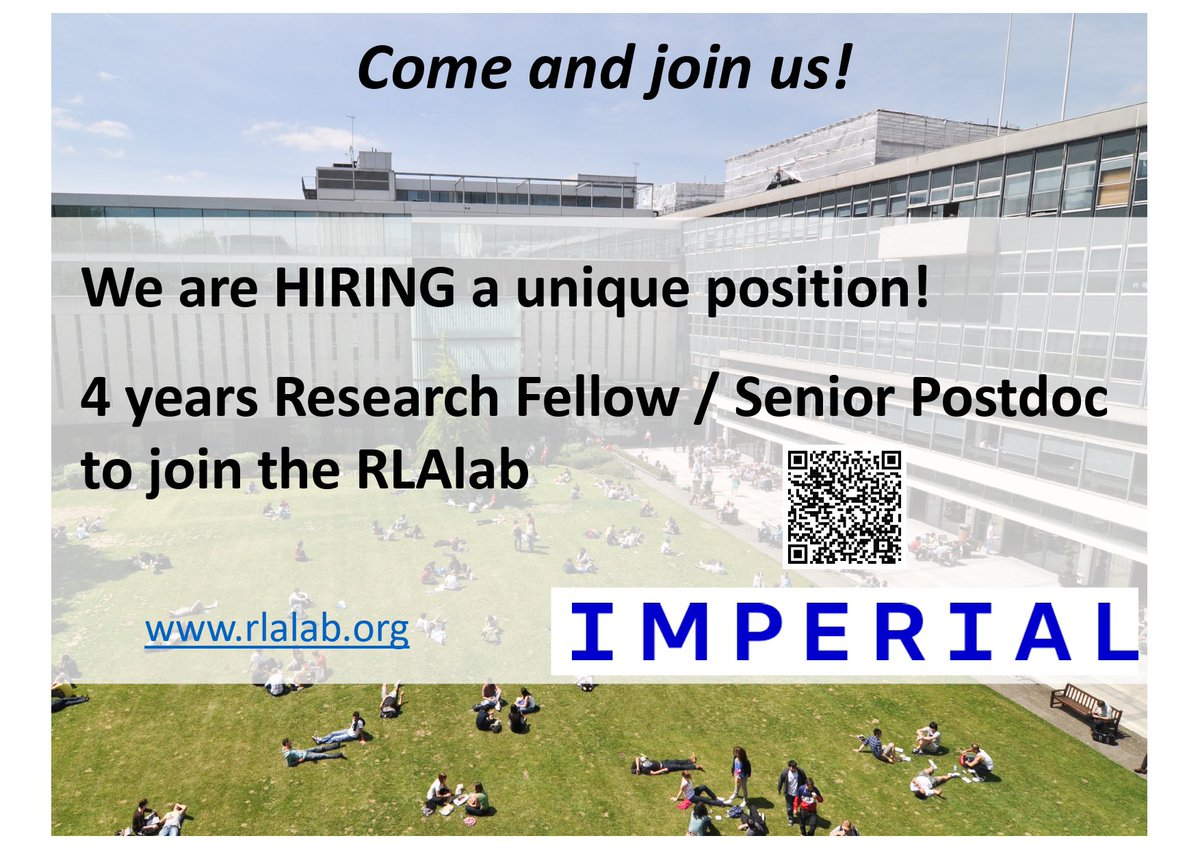
Please RT: I am hiring for a unique position of Research Fellow / Senior Researcher / Senior Postdoc!
Join my #synbio lab @imperialcollege to coordinate and supervise research, apply for grants, write papers, and assist managing the team.
➡️ Apply now! lnkd.in/ehz4XUXJ
2
139
220
34,588
Biochemistry retweeted

14 May 2024
Linear Regression is one of the most important tools in a Data Scientist's toolbox. Here's everything you need to know in 3 minutes.
1. OLS regression aims to find the best-fitting linear equation that describes the relationship between the dependent variable (often denoted as Y) and independent variables (denoted as X1, X2, ..., Xn).
2. OLS does this by minimizing the sum of the squares of the differences between the observed dependent variable values and those predicted by the linear model. These differences are called "residuals."
3. "Best fit" in the context of OLS means that the sum of the squares of the residuals is as small as possible. Mathematically, it's about finding the values of β0, β1, ..., βn that minimize this sum.
4. Slopes (β1, β2, ..., βn): These coefficients represent the change in the dependent variable for a one-unit change in the corresponding independent variable, holding other variables constant.
5. R-squared (R²): This statistic measures the proportion of variance in the dependent variable that is predictable from the independent variables. It ranges from 0 to 1, with higher values indicating a better fit of the model to the data.
6. t-Statistics and p-Values: For each coefficient, the t-statistic and its associated p-value test the null hypothesis that the coefficient is equal to zero (no effect). A small p-value (< 0.05) suggests that you can reject the null hypothesis.
7. Confidence Intervals: These intervals provide a range of plausible values for each coefficient (usually at the 95% confidence level).

7
334
1,284
80,901
Biochemistry retweeted

19 Apr 2024
Microsoft Excel can make you $10,000 a month.
If you have:
1. Wi-Fi
2. A laptop
3. Skills in Microsoft Excel
Here's how you can start a side hustle that will make you wealthy:
133
1,906
10,730
3,454,001
Biochemistry retweeted

12 Apr 2024
💔🇵🇸 ISRAEL DELIBERATELY BOMBED the three 3 sons and 3 grandchildren of Hamas' leader, Ismael Haniyeh, in the Gaza Strip.
Imagine the response if Hamas targeted Netanyahu's son in Miami.

1,474
9,072
29,264
1,136,344
Biochemistry retweeted

6 Mar 2024
Summer Internship in Korea
Open for UG and PG students till 31st March 2024 in Physics, Chemistry, Math, Biology, cognitive & Medical Science. Duration of the Internship is June 24 ~ August 16, 2024. Airfare and accommodation provided to interns.
Info
kaist.ac.kr/site/kr/html/foo…
69
165
17,038
Biochemistry retweeted

5 Mar 2024
If any students are interested in spending the summer at Yennamalli lab doing some bioinfo projects, please DM me or email to ragothaman@scbt.sastra.edu
Happy to host!
#internships
#summer
13
47
131
20,418
Biochemistry retweeted

26 Feb 2024
Postdoctoral jobs in Canada | Government | Nature Careers - NRC Postdoctoral Fellowships / Stagiaires de recherche postdoctorale au CNRC · Canada (CA) · $74,230 - $103,093 · The National Research Council of Canada. - ift.tt/tTrExOQ
3
15
2,406
Biochemistry retweeted
26 Feb 2024
Humboldt Post Doctoral Fellowships for overseas Researchers to work in German institutes for 6-24 months at a stipend of € 2670 pm for fresh PhD and € 3170 pm to experienced Researchers
Details at humboldt-foundation.de/en/ap…
Applications are reviewed in March, July and November.
5
128
381
42,473
Biochemistry retweeted

26 Feb 2024
PostDoc or RA position available in our group (wet lab part, focus on assays for protein-protein interactions and effects of cancer mutations) #postdoc #biochemistry #cancer #biophysics. Please help us to spread the voice. candidate.hr-manager.net/App…
23
20
6,635
Biochemistry retweeted

24 Feb 2024
The #plasmidome associated with Gram-negative bloodstream infections: A large-scale observational study using complete plasmid assemblies #NGS #bioinformatics #PlasmidBiology
nature.com/articles/s41467-0…
5
18
1,477

📣 Bayer Foundation 𝐅𝐞𝐥𝐥𝐨𝐰𝐬𝐡𝐢𝐩𝐬 in Agricultural Science, Drug Discovery and for Medical Sciences in Germany!
Are you an MSc, PhD student looking for an opportunity to undertake an international placement or research activity?
👩🎓👨🎓Bayer Foundation offers scientific fellowships in the Life Sciences, that are designed to enhance existing study programs by providing additional funding for international placements, that are complimentary to current or future scientific studies.
Fellowships in Drug Discovery, Agricultural Science, and for Medical Sciences are given to young scientists for their innovative research projects that also benefit the society. Check all criteria and apply until 8th of April here: wp.me/pbv48T-88j
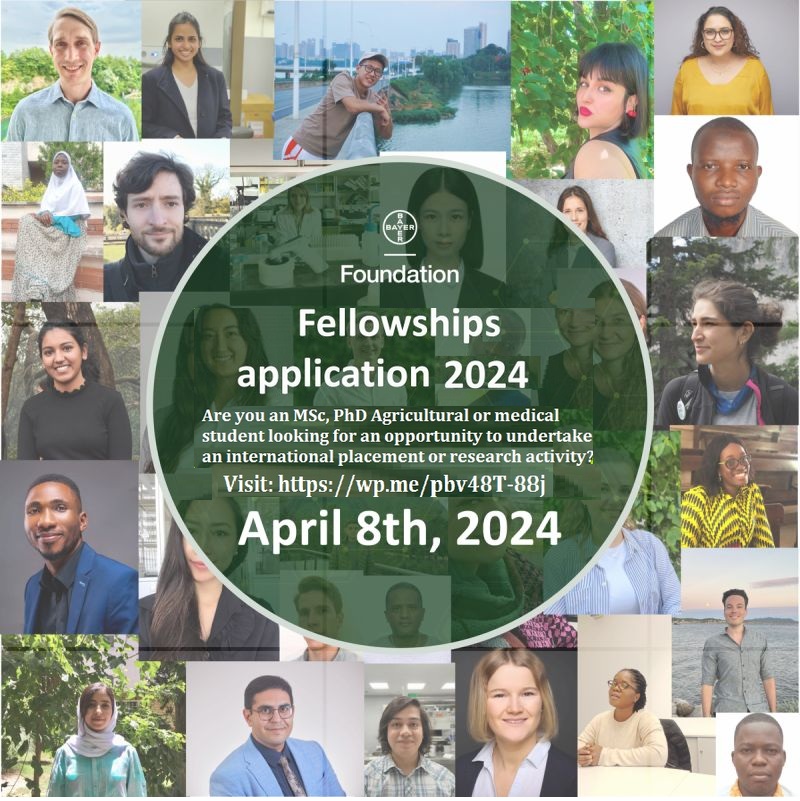
ALT Bayer Foundation 𝐅𝐞𝐥𝐥𝐨𝐰𝐬𝐡𝐢𝐩𝐬 in Agricultural Science, Drug Discovery and for Medical Sciences in Germany!
1
58
132
13,181
Biochemistry retweeted

21 Feb 2024
Postdoc position open for highly motivated biochemist and/or structural biologist enthusiastic about membrane dynamics in my lab at the FMP in Berlin (leibniz-fmp.de/haucke). We are the first certified green lab in Germany. Please apply now to haucke@fmp-berlin.de.
1
57
98
14,013