
Investor. Trader. Business Strategist. Author. Delivering multi-asset trade setups & market insights via macro, fundamentals & technicals. Alumnus: IIM Calcutta
Joined March 2016
- Tweets 3,089
- Following 705
- Followers 742
- Likes 1,109
238 Photos and videos


Pinned Tweet

May 18
According to SEBI, 90% of traders lose money in F&O, and the most devious culprit is LIQUIDITY SWEEP. Most traders don’t lose money because they lack intelligence, discipline, or access to information. They lose because they are taught to focus on indicators, patterns and news headlines, while ignoring one thing that drives almost every market move — liquidity.
People often say, “The market is manipulated.” Price breaks resistance, everyone enters expecting a rally, and suddenly the market reverses sharply. Support holds for weeks, traders buy confidently, and then one candle wipes out their stop losses before the price moves in the original direction. After enough experiences like this, many conclude that markets are random or rigged.
The uncomfortable truth is this: markets are designed to seek liquidity. Large institutions and participants handling huge positions cannot simply buy or sell wherever they want. They need counterparties. They need orders on the other side. That requirement creates price behaviour that many traders interpret as manipulation, but may just be the process of collecting liquidity.
This is where Smart Money Concepts (SMC) comes in. Despite all the debates around it, the framework has become popular because it tries to explain why prices behave in certain ways rather than merely reacting to candles after they form. Concepts like Liquidity Sweeps, Fair Value Gaps (FVG), Order Blocks (OB), Break of Structure (BOS) and Change of Character (CHoCH) have entered trading discussions everywhere — from retail communities to institutional-style price action analysis.
Understanding these concepts does not guarantee profits. Nothing does. But understanding them can change the way you see charts forever.
Take liquidity first. Imagine a stock trading near a major resistance level. Thousands of traders have placed buy orders above resistance, expecting a breakout. At the same time, traders holding short positions have placed stop losses slightly above that resistance. Both groups unintentionally create a pool of pending orders. In other words, they create liquidity.
Now, suppose the price moves slightly above resistance, triggering breakout buyers and stop-loss orders. Retail traders celebrate, believing confirmation has arrived. Then, suddenly, the price reverses and falls sharply. Many traders describe this as a fake breakout. Smart Money Concepts would often describe this as a Liquidity Sweep — a movement beyond obvious highs or lows to collect liquidity before the actual move begins.
This is why the price sometimes seems cruel. The market is not necessarily targeting individuals. It is moving toward areas with existing orders. Your stop loss happens to be in the same place as thousands of others.
The implication is powerful: rather than asking “Where should I enter?”, experienced traders increasingly ask “Where is liquidity likely sitting?”
The next concept people discuss frequently is the Fair Value Gap (FVG). Markets do not always move in a smooth, balanced manner. Sometimes a strong impulse creates an imbalance in which the price moves so quickly that a gap is left between candles. The theory behind FVG is that these imbalances may attract future price action as markets seek efficiency before continuing in the original direction.
Think about how often you’ve seen a price explode upward, leave everyone behind, retrace unexpectedly and then continue upward again. Many traders interpret those retracements as weakness when, in some cases, the price may simply be revisiting an imbalance.
This changes behaviour. Instead of chasing every move out of fear of missing out, traders begin waiting for retracements into areas of imbalance. Patience starts replacing urgency.
Then there are Order Blocks, another widely discussed concept and also one of the most misunderstood. Simplified explanations often define a bullish order block as the last bearish candle before a strong bullish expansion and a bearish order block as the last bullish candle before a sharp decline. These zones are believed to represent areas where significant institutional positioning occurred.
The mistake beginners make is drawing order blocks everywhere. Every consolidation becomes an order block. Every candle becomes important. Eventually, charts turn into coloured rectangles with no clarity. The usefulness of order blocks depends heavily on context — market structure, displacement, liquidity and timeframe all matter.
This brings us to market structure, perhaps the most underrated skill in trading.
A bullish trend creates higher highs and higher lows. Lower highs and lower lows characterise a bearish trend. When price breaks the previous structure and continues, many call it a Break of Structure (BOS). It suggests continuation. When price starts to violate the structure in a way that hints at a potential trend reversal, traders may refer to it as a Change of Character (CHoCH).
The distinction matters because many traders confuse early signs of reversal with confirmation. One can signal possibility; the other may indicate continuation. Acting too early often means getting trapped.
What makes Smart Money Concepts appealing is not any single tool but the attempt to combine these observations into a narrative. A trader might identify a higher-timeframe trend, locate liquidity pools, wait for a liquidity sweep, observe structural shifts, identify an order block or fair-value gap, and then seek entries with defined risk.
Notice the repeated word there: risk.
Because this is the part social media often skips.
No concept, however sophisticated, removes uncertainty. Markets do not become predictable because someone learned new terminology. Losses remain part of trading. Smart Money Concepts can easily become dangerous when traders start believing every sweep guarantees a reversal or every fair value gap guarantees a revisit.
The market rewards probabilities, not certainty.
The irony is that after years of searching for indicators, secret strategies and complex systems, many experienced traders arrive at surprisingly simple conclusions: trends matter, liquidity matters, patience matters, emotional regulation matters and risk management matters.
"Greed destroys good trades. Fear exits the winning trades early. Hope keeps losing positions alive. Panic converts temporary losses into permanent damage."
The chart is only half the battle. The person reading the chart is the other half.
Perhaps the biggest lesson hidden beneath all Smart Money Concepts is this: stop viewing price as random candles and start viewing it as a map of behaviour — fear, greed, trapped traders, institutional activity, imbalance and reaction.
The next time price breaks a major level and reverses sharply, instead of immediately calling the market manipulated, ask a different question:
Where was the liquidity, and who needed it?
That one question changes how you see markets.
And sometimes, changing how you see markets is more valuable than changing indicators.
#SmartMoneyConcepts #SMC #PriceAction
5
17
60
8,811
If this is the deal Iran-US are going to sign, it's conclusive that US lost the war. I still doubt if this is the version which will be signed.
11h

🚨🚨🇮🇷🇺🇸 BREAKING | If this is confirmed, we can say that the US has lost the war with Iran.
The Iranian news agency Mehr, citing the Iranian Ministry of Foreign Affairs, has published all 14 clauses of the Memorandum of Understanding (MoU) signed with the US:
1. Permanent and immediate cessation of war on all fronts, including Lebanon.
2. The US commitment to non-interference in Iran's internal affairs and respect for the sovereignty of the Islamic Republic of Iran.
3. Complete lifting of the naval blockade within 30 days.
4. The US commitment to withdraw its forces from around Iran.
5. Reopening of the Strait of Hormuz within 30 days under Iranian arrangements.
6. Suspension of sanctions on the sale of oil, petrochemical products, and derivatives, and full access of Iran to its financial resources.
7. The necessity for the US and its allies to present reconstruction plans for Iran amounting to at least 300 billion dollars.
8. 60 days of negotiations to reach a final agreement based on nuclear issues and the complete lifting of primary, secondary, US sanctions, and UN Security Council and IAEA Board of Governors resolutions.
9. Reiteration of Iran's commitment under the NPT treaty not to produce nuclear weapons.
10. During the negotiation period, the US has committed not to add forces in the region and not to impose new sanctions.
11. Release of 24 billion dollars of Iran's blocked funds during the 60-day final negotiation period. Half of this amount must be made available to Iran before the start of negotiations.
12. Formation of a supervisory mechanism to implement the agreement.
13. The final agreement will be approved by a UN Security Council resolution.
14. Final negotiations will not begin before the release of half of Iran's blocked funds, suspension of Iran's oil sanctions, and lifting of the naval blockade, and the final agreement will only cover the fate of enriched materials and enrichment, lifting of sanctions, and Iran's economic reconstruction plan. Discussions about Iran's missile program and support for resistance groups are definitively removed from the agenda.
As a reminder, the official signing of the memorandum is scheduled for June 19 in Geneva.
See the latest updates with us: @visionergeo
48
We were in the endgame on Friday and now the Iran-US deal is done. Is it just me, or does anyone else think, this is still not the end? Perhaps, 1 or 2 more rounds of going back and forth?
Markets have opened up all around the globe with huge gap ups. It would be wise to not let it get the best of you. Don't go all in in the concrete hope of a war end. Let's wait for the final signing of the deal on June 19th.
1
61
Aniket Lohani retweeted

Nobody explained AI this clearly.
So I made this. 🔥
If you've been confused by LLM, RAG, AI Agents and MCP —
stop overthinking it.
Think of AI like a human body 👇
🩷 LLM = The Brain
Reasones through problems.
Generates language and logic.
Without it? No AI. Period.
🟠 RAG = Brain Books
Gives the brain access to real knowledge.
Eliminates hallucinations completely.
Without it? AI just guesses. Every time.
🩵 AI Agent = Brain Hands
Doesn't just think — it ACTS.
Executes tasks. Uses tools. Remembers context.
Without it? AI talks. Never delivers.
🟡 MCP = The Nervous System
Connects LLM RAG Agent into ONE system.
Without it? All parts work in silos. Broken.
💡 The 1-line summary nobody gives you:
LLM thinks
RAG knows
Agent acts
MCP connects
This is the AI stack.
Learn it. Own it. Build with it.
📌 I break down AI concepts like this every week in plain English — plus how to BUILD and monetize them.
Free. No jargon. Just clarity.
👉 Subscribe to The AI Revenue Playbook: avsl.beehiiv.com
🔖 Save this — it's the clearest AI explainer you'll find.
💬 Which layer surprised you most? Drop it below.
🔁 Share this with someone still confused about AI.
Follow @AiswaryaVenkit1 for more such insights!!
13
127
436
24,939
Aniket Lohani retweeted
Jun 14
Stanley Druckenmiller is widely considered one of the greatest macro traders in history. He managed George Soros’s Quantum Fund, famously broke the Bank of England, and averaged 30% annual returns for three decades without a single down year.
But in the spring of 2000, he did something so fundamentally irrational, it perfectly exposes the most dangerous psychological trap in investing.
Here is the story of the $3 Billion FOMO trade.
𝐓𝐡𝐞 𝐒𝐞𝐭𝐮𝐩
In early 1999, the Dot-Com bubble was roaring. Druckenmiller, being a rational veteran, looked at the absurd valuations of internet companies with zero revenue and did what any logical macro trader would do: he shorted them.
He was dead wrong. The market kept melting up, and he lost hundreds of millions. Realizing his mistake, he flipped his position, went massively long on tech, and ended up making a fortune by the end of 1999.
𝐓𝐡𝐞 𝐄𝐬𝐜𝐚𝐩𝐞
By January 2000, Druckenmiller knew the party was over. The valuations had crossed from euphoric into psychotic. He sold his entire tech portfolio, went into cash, and patted himself on the back. He had successfully surfed the bubble and gotten out alive.
𝐓𝐡𝐞 𝐁𝐫𝐞𝐚𝐤𝐝𝐨𝐰𝐧
But then, something agonizing happened. Druckenmiller had hired two young, relatively inexperienced junior portfolio managers. While Druckenmiller sat safely in cash, these two kids kept buying tech stocks. And the market kept going up.
Every single day, Druckenmiller had to walk into the office and watch two novices make 5%... 10%... 20% a week, while he made absolutely nothing.
For a billionaire who had survived the most brutal financial crises of the 20th century, the math didn't break him. The logic didn't break him. The envy did.
𝐓𝐡𝐞 𝐂𝐫𝐚𝐳𝐲 𝐑𝐞𝐯𝐞𝐚𝐥
In March 2000, Druckenmiller literally couldn't take the psychological pain of watching his juniors get rich anymore. He threw his own fundamental analysis in the trash, picked up the phone, and bought $6 billion worth of tech stocks.
He bought in at the exact hour of the absolute peak of the Dot-Com bubble.
Within days, the market collapsed.
Druckenmiller ended up losing $3 billion in a matter of weeks and eventually had to step down from the Quantum Fund.
When asked about it later, his explanation revealed the most terrifying reality of market psychology:
"I bought the top of the market because I couldn't stand the fact that two young guys next to me were making money and I wasn't. I had known it was a bear market for months. I just missed the play."
The Psychological Takeaway:
Everyone thinks the stock market is driven by Fear and Greed. But these aren’t the worst emotions. The most destructive emotion in finance is Envy.
Your brain can handle losing money if everyone else is losing money. What your brain physically cannot tolerate is watching your idiot neighbor get rich while you sit on the sidelines acting "responsible."
FOMO isn't just a retail disease. It is a psychological virus so powerful that it can make a billionaire veteran torch $3 billion at the exact top of the market just to feel included.
Stay away from FOMO.
2
1
123
Aniket Lohani retweeted
May 19
How to calculate if NIFTY50 is at fair valuation, over-valued or under-valued? Read this post, learn the maths, and find the conclusion.
Confirmed official data taken from nifty-pe-ratio website (updated May 18, 2026): TTM PE 20.45x, P/B 3.24, Dividend yield 1.32%.
Nifty 50 is currently trading around 23,720 — roughly 10% below its 52-week high of 26,373 hit on January 5, 2026. The same data point, a consolidated TTM P/E of 20.45x, is being used by two completely opposite camps to argue completely opposite things, and both have data to back themselves up.
The first group compares 20.45x to the pre-2021 standalone earnings average of 16–18x, concludes that the market is still overvalued, and stays on the sidelines.
The second group compares 20.45x to the post-April 2021 consolidated earnings average of 20–21x — which is rightly the only apples-to-apples comparison since NSE switched its calculation methodology — notes that the market has already corrected 10% from peak and is trading essentially at its own fair historical average. They call this a reasonable entry.
Well, neither camp is wrong. They are measuring against different benchmarks, which is exactly the problem with relying on a single ratio. A proper valuation requires running multiple metrics simultaneously, and when you do that for Nifty 50 at 23,720 as of 19th May 2026, the picture is more nuanced than either side is letting on.
Let's get on with the calculations and inferences.
Start with the interest rate anchor because it is the most important input and the most commonly skipped. India's 10-year G-Sec yield is approximately 7.1%, pressured higher by rising crude oil prices, US Treasury yields at 15-month highs, and an INR that has weakened to 96.4 to the dollar — all of which make further RBI rate cuts harder to justify. The RBI has held its repo rate at 5.25% since the December 2025 cuts. Adding India's historical equity risk premium of 5% to the 7.1% bond yield gives you a required return of 12.1% from equities to justify owning them over bonds. The static fair P/E from this is 8.3x — which makes everything look wildly overvalued. But this is mathematically wrong because it ignores earnings growth entirely. Apply the growth-adjusted version using a long-term sustainable India earnings growth rate of approximately 7%, and fair P/E becomes 1 divided by (12.1% minus 7%) = 19.6x. That is the anchor everything else gets measured against. At 23,720, the market is trading fractionally above this anchor on a trailing basis and below it on a forward basis.
The TTM P/E of 20.45x deserves a bit more unpacking before moving forward. This is on a consolidated earnings basis, as NSE switched its methodology in April 2021. The pre-2021 standalone earnings comparison — which most long-term historical charts still show — is genuinely misleading when applied to today's number. On the correct like-for-like consolidated basis, the historical average is approximately 20–21x, and the website nifty-pe-ratio, which tracks NSE's official data, categorises today's reading as "Fairly Valued / Normal Valuation." The buy zone on consolidated earnings historically begins around 18–19x; the caution zone starts around 25x. At 20.45x, you are above the buy zone but comfortably below the caution zone. The other critical context: FY26 was an earnings disappointment — EPS grew only 4–6% against expectations of 14–15% at the start of the year. The TTM denominator is artificially depressed by one bad year. The market is not pricing FY26. It is pricing the recovery in FY27.
Forward P/E is where the analysis gets genuinely interesting. The implied TTM EPS at 20.45x PE and Nifty May 18 close is approximately ₹1,149. Apply the consensus FY27 growth estimate of 15% — the midpoint of BofA at 14%, Nomura at 14.6%, Axis Bank at 16%, and PL Capital at 17% — and you get a FY27 EPS of approximately ₹1,322. At 23,720, forward P/E is 23,720 divided by 1,322 = 17.9x. Compare that to the growth-adjusted fair P/E of 19.6x and the market is trading at a 9% discount to theoretical fair value on a forward basis.
The PEG ratio — forward P/E divided by expected earnings growth — is 17.9 divided by 15 = 1.19x, which sits comfortably inside the fair value band of 1.0x to 1.5x. On the most forward-looking, growth-adjusted metrics, Nifty at 23,720 looks reasonably priced. The entire thesis rests on one assumption: that FY27 earnings deliver. The street already cut FY27 estimates by 6%. A second round of cuts — possible if global trade deteriorates further or domestic demand disappoints — would push forward P/E back toward 19–20x, making the market fully priced with no margin of safety.
P/B at 3.24x looks elevated in isolation until you work through the justified P/B math. The formula — ROE divided by cost of equity — gives 16% (Nifty's aggregate ROE) divided by 12.1% = 1.32x justified. That screams overvaluation at first glance, but the formula assumes a mature, stable business and breaks down for growth compounders. TCS runs 45–50% ROE, HUL north of 85%, HDFC Bank at 17–18%, and Infosys at 33–35%. The blended 3.24x for this quality basket is not irrational. More importantly, P/B has compressed from a peak of 4.88x in July 2023 to 3.24x today — a 34% contraction in the multiple while earnings grew. That is structurally positive. Dividend yield at 1.32% is in the neutral zone — value territory begins above 1.5%, danger territory kicks in below 1%. The direction of travel is improving as the market corrects.
The one genuinely uncomfortable number in the entire analysis is the Buffett Indicator — total listed market cap divided by GDP — which sits at approximately 130% against India's historical median of around 87%. Structural factors explain part of this gap: far more companies are listed post-2020 versus a decade ago, household savings have migrated meaningfully from gold and fixed deposits into equities, and corporate balance sheets are the cleanest (comparatively) they have been in 15 years. But even adjusting for these structural shifts, a fair range for modern India is probably 105–120%, putting current levels 8–20% above intrinsic economic value. This is not a panic signal. But it does tell you that the multiple re-rating phase for Indian equities is largely complete. Future returns will have to come from earnings growth, not PE expansion.
Bringing all eight metrics together — TTM PE (20.45x, at consolidated average), forward PE (17.9x, below fair PE of 19.6x), PEG (1.19x, in fair zone), P/B (3.24x, compressing positively), dividend yield (1.32%, neutral), Buffett Indicator (~130%, elevated), interest rate anchor (growth-adjusted fair PE ~19.6x, current forward PE below this), and the 52-week range position (37th percentile, closer to the yearly low than the high) — three metrics are mildly positive, three are neutral, and two are caution flags. This is not a market in bubble territory, neither a market in complete distress (although it feels like so, as it has been flat since 1.5 years). It is a market that is fairly valued on trailing metrics, mildly attractive on forward metrics, and constrained on macro metrics.
The bull case: forward PE at 17.9x is below fair PE, PEG at 1.19x is in the fair zone, banks — which carry 35% weight in the index — are genuinely cheap at 13–14x PE with HDFC Bank poised to re-rate as merger integration completes through FY27, and the index has already absorbed a 10% correction from peak.
The bear case: 10-year G-Sec at 7.1% and rising, Buffett Indicator at 130% above its own median, FY27 earnings consensus that has already been cut once and could be cut again, and an INR at record lows that adds inflationary pressure every time crude ticks higher. These are real constraints.
To summarise:
👉Nifty 50 at 23,720 is not cheap and it is not expensive. It is fairly valued on trailing earnings, mildly attractive on forward earnings, and constrained by macro headwinds.
👉For long-term SIP investors there is nothing in this data that demands a pause — don't stop your SIPs, keep allocating.
👉For lump-sum capital, the honest answer is that the genuine buy zone on consolidated earnings is 18–19x forward PE, which would require Nifty to fall another 5–8% from current levels — toward 21,800–22,300 — to offer a proper margin of safety. Today's levels are fair, not exceptional. So, don't deploy all your capital. Deploy a portion. If markets go up, good. If they correct further, deploy remaining capital to buy the dip.
⚠️The single number to track above everything else is not the index level. It is whether the FY27 consensus EPS of approximately ₹1,322 survives two more quarters of analyst revisions intact. Q1 FY26-27 results land in July–August 2026. If earnings beat, this market re-rates toward 21–22x forward and rewards current buyers generously. If earnings disappoint again, the 10% correction from peak becomes the beginning of something larger.
The data says fair entry for the patient. The data also says don't confuse fair with cheap. It's definitely not cheap. What is available cheap right now, is actually cheap and will move nowhere. The market is going to take a hard test of your patience and conviction for the next 9 months. FY27 Q1 and Q2 results, along with the geopolitical and macro triggers will set the final tone for Nifty 50 by the end of Dec 2026.
Bookmark this post to keep it handy.
Read the details on how to do valuation in the article attached.

4
4
7
1,449
Jun 13
No one treats you better until you start treating yourself better.
The day you decide to work on yourself, improve your confidence, and respect your own worth, people start seeing you differently.
Respect yourself first. The world follows..!!
2
5
113
Aniket Lohani retweeted

Jun 12
A 25-year-old housewife in Chennai earns ₹250/hour ($3) just by doing her normal housework.
She wears a phone on her head and records herself making coffee, cutting fruit, folding laundry.
These first-person videos get sent to AI companies training humanoid robots to handle real-world tasks. She shoots 90 clips a day.
Her quote: "Who else will pay you ₹250/hour ($3) an hour just for doing housework?"
She's part of a growing gig economy in India where thousands are doing the same thing, filming everyday life to train the robots of tomorrow.
402
1,733
7,767
2,692,179
Jun 12
Elon Musk becoming a trillionaire is not just about money.
It is about execution at a scale most people can’t even imagine.
Question is:
Are we still investing in past themes, or preparing for the next decade’s mega themes?
Well said!

SpaceX listing is not just an IPO.
It is a reminder that the biggest money is made by backing impossible dreams before they become obvious. 🚀
Rockets.
Satellites.
Mars.
Starlink.
Space economy.
Elon Musk becoming a trillionaire is not just about money.
It is about execution at a scale most people can’t even imagine.
Question is:
Are we still investing in past themes, or preparing for the next decade’s mega themes?
$SPCX
70
Jun 11
This is very shameful. Is this how our young doctors are?
@MoHFW_INDIA

Here is another video of med students talking disrespectfully about those who donated themselves for science and this is even worse than Sejal. I think there is this disrespectful culture in medical colleges which should be called out.
66
Jun 11
I was just wondering how marriages are very similar to stock market investing.
> There is a risk-reward ratio.
> Before selecting a stock, we look at the macro, fundamentals, technicals. The same applies to when selecting a person. We look at the family (macro), the morals, values & goals (fundamentals) and habits, lifestyle & behaviour (technicals).
> BSE & NSE are similar to @ShaadiDotCom and @bharatmatrimony
> When a stock breaches the support line, we exit the trade. Similarly, when a marriage breaches the support line of trust & respect, it’s advised to exit the marriage also.
> The govt. makes money in losing trades through STT and in losing marriages through double income tax paid by women on alimony received.
Uncanny similarities!
76
Jun 11
Not sure what this is about. But, a medical student should never violate the cadaveric oath. The oath honors the donated body as a "silent teacher", committing students to treat human remains with the utmost dignity, gratitude, and ethical respect. If a medical student can't learn this, they have no business becoming a doctor.
Jun 10

She is SEJAL PAWAR, a medico who makes fun of dead people's genitals.
CANCEL HER MEDICAL LICENSE and suspend her. She doesn't deserve to be a doctor. @MoHFW_INDIA @JPNadda
Had it been some man, the world would have reacted in the opposite manner.
#370


71
Jun 10
I have seen many young investors mocking the stock markets' performance in the last 2-3 years, comparing it with FD returns.
If you can't stick to equity markets for at least 10 years, switch to fixed income assets. Because equity market is never linear. Don't forget Indian stock market gave close to 160% returns in 3 years from 2021 to 2024.
2
3
300
Aniket Lohani retweeted

Jun 8
Rather long but I hope you enjoy reading it as much as I did:
I am an Indian,
and everyone says I lack civic sense.
They can burn streets,
and vandalize a city after a championship game.
I dance at an airport excited about my first foreign trip, and suddenly I am the face of poor civic sense.
I am an Indian,
and everyone says I steal jobs.
They move factories across oceans,
shift profits through tax havens.
I study, compete, earn a visa, work 18 hours a day, sometimes multiple jobs and somehow I am the one stealing jobs and scamming the system.
I am an Indian,
and everyone says I am everywhere.
I build your software,
treat your illness,
teach your children,
drive your taxis,
and open your stores.
The world became a village,
yet my presence remains a problem.
I am an Indian,
and everyone says I am too loud.
The evening news screams outrage.
The internet echoes with anger day and night.
I celebrate a wedding, a festival, a victory,
and I am told my joy is too loud.
I am an Indian,
and everyone says I smell of curry.
The world smells of gunpowder,
of hatred,
of division,
of endless arguments about race and religion.
I carry the fragrance of spices from my grandmother's kitchen,
and somehow that is what offends.
I am an Indian,
and everyone says I have no culture.
I come from a civilization that counted the stars
when much of the world was still learning maps.
I speak languages older than nations.
I celebrate hundreds of traditions,
yet I am told I have no culture.
I am an Indian,
and everyone says I am backward.
I send missions to the Moon.
I build vaccines for millions.
I run companies across continents.
Yet a viral video of one fool becomes evidence against a billion people.
I am an Indian.
I celebrate my favorite actor's success
with flowers, music, and a few glasses of milk.
Others worship influencers who sell outrage, turn every disagreement into a battlefield, and every opinion into a war.
Yet my celebration is the one that makes headlines.
I am an Indian,
and everyone says I gather in crowds.
We walk together in processions,
celebrating our faith, our culture, our traditions.
Everyone is welcome.
No shops are looted.
No neighborhoods are burned.
No one is threatened for thinking differently.
We sing.
We dance.
We pray.
And somehow our gathering becomes the problem.
I am an Indian,
and everyone says I bring my culture everywhere.
I light a lamp in a foreign land.
I wear a saree in the snow.
I teach my children the language of their grandparents.
Others build walls between neighbors,
argue endlessly over identity,
and forget where they came from.
Yet I am told I should leave my culture behind.
I am an Indian,
and everyone says I live in the past.
But my past gave me yoga,
mathematics, philosophy, meditation,
and the idea that the world is one family.
The future keeps borrowing from my past,
while telling me to be embarrassed by it.
I am an Indian,
and everyone says I should be ashamed.
Ashamed of my accent.
Ashamed of my food.
Ashamed of my festivals.
Ashamed of my traditions.
Ashamed of existing.
But I am not ashamed.
I am the child of farmers and philosophers,
scientists and saints, workers and dreamers.
*I come from a land that taught the world
that truth can be many-sided,
that all paths deserve respect,
and that the entire world is one family.*
*Yes, we have flaws. Every nation does.*
*But judge me by my actions, not by your stereotypes.*
For I am an Indian.
*And before you tell me what is wrong with me, look honestly at what you have normalized in yourself.*
For I am an Indian.
The world may mock my accent,
question my customs,
laugh at my celebrations,
and judge me through a thousand stereotypes.
*Yet I stand tall. For I belong to a civilization older than empires, a culture richer than prejudice, and a people whose spirit refuses to bend.*
For I am an Indian.
379
873
2,980
128,794
Jun 5
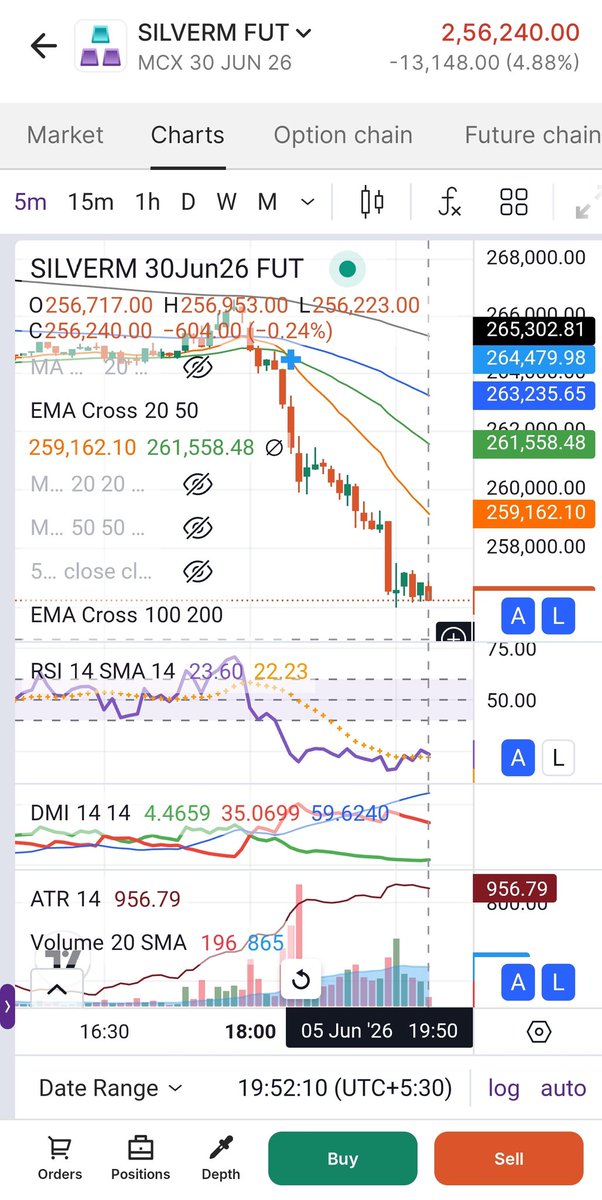
The 'long' trade setup in SilverM Jun Futures is ready.
Buy @ LTP ~ 255,000
Stop loss @ 253,500
Target @ 263,000
Position Size: 1 to 2 lots (depending on your risk)
Strictly follow the stop loss & position sizing, if taking the trade.
Note: 1 point drop or gain in SilverM premium means 5 Rs. loss or profit. If stop loss hits, Total loss on 1 lot will be Rs. 7500/-
Disclaimer: I am not a SEBI registered analyst. Invest/Trade at your own discretion. The post is only for educational purposes.
Jun 5
A really good low-risk, high-reward buy setup forming on SilverM futures.
1
212

Same thing happens with me whenever I look at any shop or brand.
Most people look at the products inside the shop.
But my brain first remembers the stock symbol, the company details, the industry it belongs to, and whether that sector is doing well or not.
Just by seeing a brand name, I immediately start thinking:
Is this company listed?
What is the stock symbol?
How is the chart structure?
How is the industry performing?
Is there momentum in this sector?
How are the fundamentals?
Is revenue growing?
Are margins improving?
Is the company gaining market share?
Is debt under control?
Can this learning be automated into my dashboard?
This is how market learning slowly becomes part of daily life.
The more you observe businesses around you, the better you understand brands, sectors, consumer behavior, fundamentals, and stock opportunities.
2
2
13
1,596
Jun 5
Fundamentally quality stocks from the sectors - Power, Defence & Renewables.

𝗜𝗻𝗱𝗶𝗮'𝘀 𝗣𝗼𝘄𝗲𝗿, 𝗗𝗲𝗳𝗲𝗻𝗰𝗲 & 𝗥𝗲𝗻𝗲𝘄𝗮𝗯𝗹𝗲𝘀 𝗦𝘂𝗽𝗲𝗿𝗰𝘆𝗰𝗹𝗲 𝘀𝘁𝗼𝗰𝗸𝘀 𝘄𝗼𝗿𝘁𝗵 𝘀𝗲𝗿𝗶𝗼𝘂𝘀 𝘀𝘁𝘂𝗱𝘆👇
• Shilchar
• K.P. Energy
• Advait Energy
• Apollo Micro Systems
• Syrma SGS
• TD Power
• Quality Power
• Krishna Defence
• Pondy Oxides
• Yash Highvoltage
• Aimtron Electronics
• Jain Resource Recycling
• Oriana Power
• Alpex Solar
• Yatharth Hospital
• Prizor Viztech
• Atlanta Electricals
Bookmark this list📌
Educational purpose only. Not a buy/sell recommendation.
Any more stocks to add❓
#trading #investing
86
Jun 5
The biggest hurdle to self-awareness and learning is, "lack of willingness to accept the existence of something if our limited knowledge/logic invalidates it."
Many things in life exist, perhaps are real and useful, even if our current understanding says they don't exist/are hokum.
Examples:
- astrology
- ayurveda
- homeopathy
- aliens
- spirits
- numerology
- acupuncture
- telepathy
- energy healing
- manifestation
- reincarnation
- vastu shastra
39