
The platform that specializes in analyzing order flow, volumes, and liquidity in the DOM. Start seeing and understanding the real causes of price movement.
Joined July 2020
- Tweets 540
- Following 27
- Followers 3,192
- Likes 51
495 Photos and videos


Pinned Tweet

A new era of volume analysis is here 🚀
ATAS X (Beta) is the result of long and painstaking work. We rebuilt the analytical platform from scratch to give you a completely new volume analysis experience.
How to get access to ATAS X (Beta)?
For the first time, the new version is available to users of all pricing plans! Get or renew your Plus, Pro or Ultra subscription before April 30:
💰 Save up to €650
🎁 ATAS X (Beta) and Heatmap (Beta) as a bonus
▶️ Claim your bonuses web.atas.net/4w9hbma
What makes ATAS X special?
✅ Speed without compromise: the interface responds instantly and charts move with maximum smoothness.
✅ Cross-platform: your favourite analytical tools work seamlessly on Windows and macOS.
✅ Flexible personalisation: customise your workspace and manage tabs more easily than ever.
✅ Continuous improvement: the new version evolves based on your feedback, with updates released literally every week.
2
1
12
1,304
⚡️Heatmap (Beta) ATAS X (Beta) now available on all plans
1️⃣Update ATAS to version 8.0.13, ATAS X (Beta) to 8.0.14
2️⃣Find the Heatmap icon in the main menu
⚡More about Heatmap (Beta)
web.atas.net/42QEiV8
⬇️ Install ATAS X (Beta)
atas.net/atas-x/
1
6
537
Fix Your Analysis with This 3-Step Method (LiST)
Learn how to build a structured, rule-based approach using the LIST Method — a three-pillar analytical framework for reading market context.
Levels (L) — how to identify key reaction zones using Market Profile and TPO
Structure (S) — how to confirm trend shifts before making a decision
Trigger (T) — how to identify trigger levels using simple and complex setups
You'll also learn:
🔹How to set stop-loss and manage risk on each setup
🔹How to apply the LIST framework directly in ATAS
▶️ youtu.be/r8dRF23IDJg
3
386
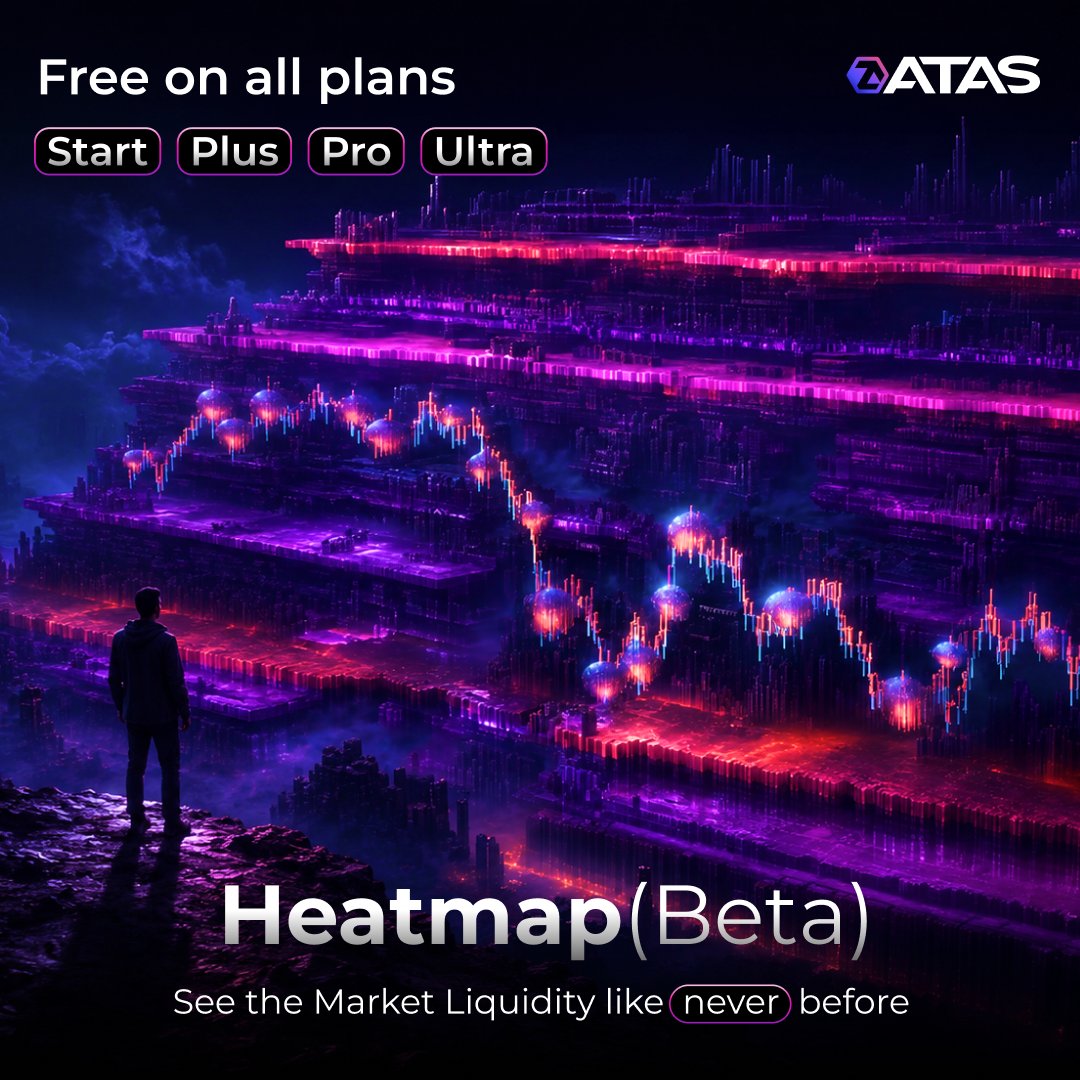
⚡️ Heatmap (Beta) ATAS X (Beta) — now available for everyone!
We want cutting-edge analytical tools to become part of your everyday workflow. No extra cost.
Available on all plans: Start, Plus, Pro, and Ultra.
⚡️ Learn more about Heatmap (Beta)
web.atas.net/4dL1vgz
How to launch Heatmap (Beta):
1️⃣ Update your analytical platform to version 8.0.14
2️⃣ Find the Heatmap icon in the main window menu
3️⃣ One click — and you see straight through the market
🎁 Signed up for the waitlist? Check your inbox! We've already sent you a ready-made Heatmap configuration template.
⬇️ Download and install ATAS X (Beta)
atas.net/atas-x/
☝️ Users of the new ultra-fast version for Windows and macOS get access to the full Heatmap (Beta) feature set first — starting today.
The classic ATAS version currently has the core features available — advanced tools are coming soon: May 25 (Beta) and June 8 (Latest).
Analyze liquidity like never before! 😎
7
452
▶️ youtube.com/watch?v=LjP3nm4j…
🔹Robinhood AI trading agents, Anthropic's $965B valuation
🔹Bitcoin drop below $73K
🔹PCE inflation spike
🔹Starlink vs Blue Origin
🔹Hormuz oil shock
3
230
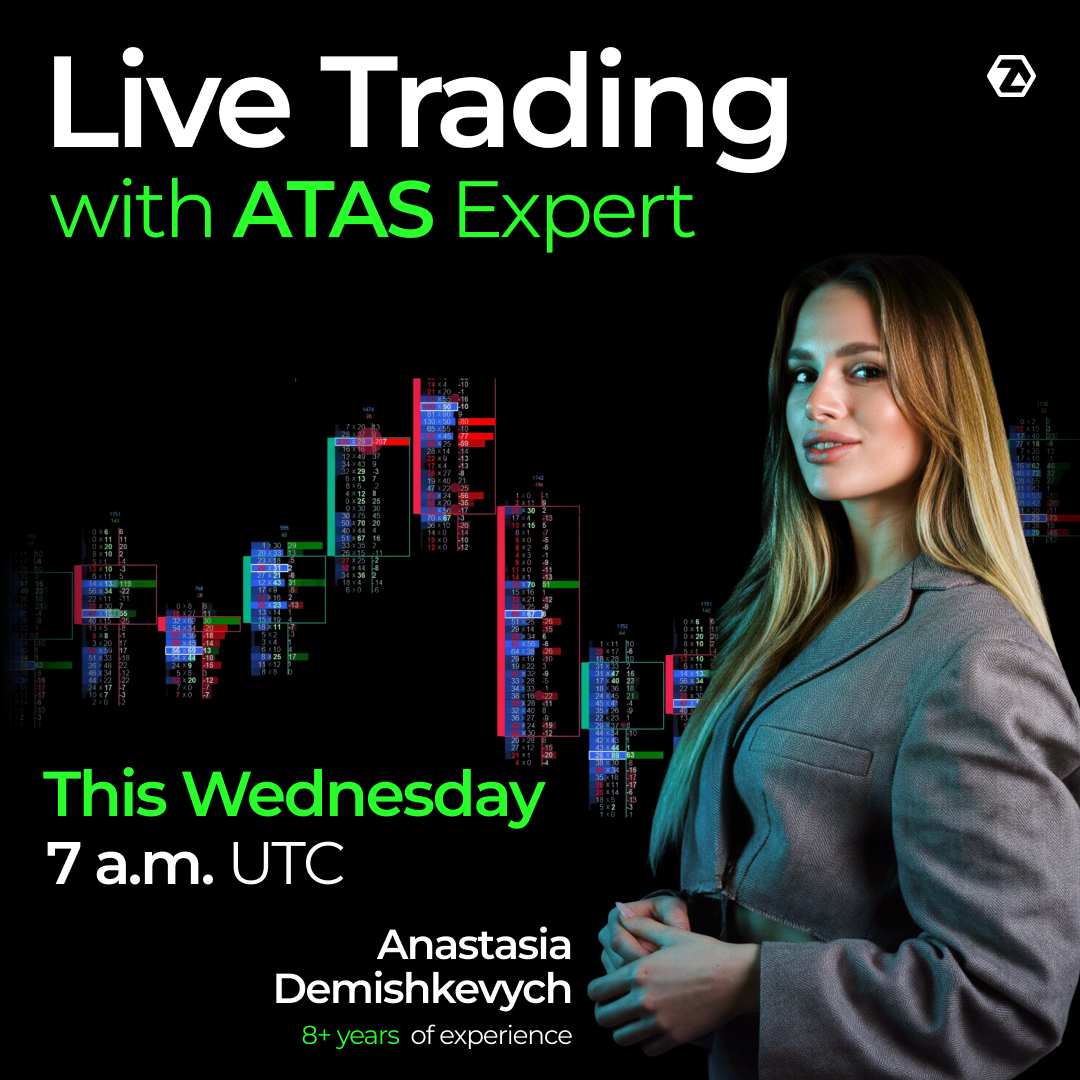
See institutional market logic in real time. Join Anastasiia Demishkevych this Wednesday at 7 a.m. UTC!
🔹 Real-time volume & order flow (ES/NQ)
🔹 Scenarios, timing, and risk management
🔹 No shortcuts, pure microstructure
youtube.com/live/KC6vv10LoKw
4
270
📊 ATAS Weekly: 2008 CRISIS Incoming?
The market looked bullish. The data told a different story.
🔹AI hype gets bigger
🔹Oil shock warning
🔹Fed cuts in trouble
🔹Bond market warning
and more...
📱 Watch now youtube.com/watch?v=r5299A5w…
1
3
440
👀 You can actually read liquidity now.
That’s one of the first things traders mention after trying the new Heatmap (Beta). No overloaded visuals, no messy blur just a clean view of what’s happening inside the order book.
Oliver Sparing already tested the module in live market conditions and shared their thoughts on:
🔹Tracking liquidity shifts in real time
🔹Spotting absorption faster
🔹Keeping focus during volatile moves
#ATASHeatmap
5
511
🗓 Heatmap (Beta) — official release on May 19!
The spring promo is over, but the exciting part is just beginning. In just two weeks, the new Heatmap (Beta) module will become available to all ATAS users.
What's great about the new Heatmap (Beta)?
🚀 600 FPS — the heatmap stays smooth even during extreme volatility
💎 3D mode — visualize liquidity and volume Bubbles in a new dimension
🔗 Flexible linking — combine Heatmap with Footprint and DOM, and overlay indicators directly inside the module
🧩 Price axis synchronization — all windows move in unison when you scroll the price scale
The module will be available on all plans, including the free Start plan.
🎁 Want to skip the setup hassle? Join the waitlist and on release day we'll send a ready-made template with professional settings straight to your inbox.
Register & get the template
web.atas.net/4dzqFzH
3
11
778
The ATAS X Challenge has launched! 🚀
This is a historic moment a prop firm evaluation simulation is taking place in the new ATAS X (Beta) for the very first time.
COMP accounts are activated, and the leaderboard challenge.atas.net/leaderboa… is already tracking every participant's decision.
👉 Use the advantages of ATAS X (Beta): tab-based workflow and the speed of the new version.
👉 Manage your risk: keep the $2,000 daily limit in mind. Discipline is your ticket to the final.
👉 Stay focused: 10 intense days of competition lie ahead.
Who will take home the trophies the ATAS X Trophy 🏆 and top Apple tech? We'll find out very soon.
8
649
Compete for the ATAS X Challenge Trophy! 🏆
Complete a prop firm evaluation simulator and win top Apple prizes:
🥇 1st place: ATAS X Trophy iMac 24"
🥈 2nd place: MacBook Air 15"
🥉 3rd place: iPhone 17 Air
Requirements:
✅ Access to the US market — with an active Pro or Ultra subscription or a free trial of these plans
✅ ATAS X (Beta) installed for Windows and macOS
✅ Demo environment — no entry fees, no risk
Put your strategy to the test. Apply before May 6 at 9:00 UTC.
➡️Learn more about the Challenge
web.atas.net/4tc0XGd
Disclaimer: The ATAS X Challenge is an analysis simulation for educational and competitive purposes. It does not involve trading real assets, investment services, or financial advice.
1
9
789
🔥 Heatmap (Beta) - a new way to see liquidity
We’ve rebuilt the heatmap from the ground up. Now it’s a standalone module that can be used independently or combined with any tools from Smart DOM to footprint charts.
Dimitri Bussola has already tested the capabilities of the new module. Hear what he says about nanosecond-level precision and ultra-smooth rendering at 600 FPS.
1
23
1,079
🚀 The future is here!
From May 6 to 15, join the first Challenge powered by ATAS X (Beta) - the new ultra-fast version for Windows and macOS.
Analyze statistics, sharpen your strategies before real prop evaluations, and win top Apple trophies 🍏:
🥇 1st place: ATAS X Trophy iMac 24"
🥈 2nd place: MacBook Air 15"
🥉 3rd place: iPhone 17 Air
How to participate:
🤑 Today only: Upgrade your Plus, Pro or Ultra subscription and save up to €650
🎁 Get access to ATAS X (Beta) Heatmap (Beta) as a bonus
➡️ Register for the Challenge before May 6 web.atas.net/4uhgt4l
Disclaimer: The ATAS X Challenge is an analysis simulation for educational and competitive purposes. It does not involve trading real assets, investment services, or financial advice.
2
5
581
♟️ April Challenge is over: Checkmate!
You showed a true grandmaster level with the tools of the analytics platform.
🏆 Top 3 Traders:
🥇 sami*****@hotmail.fr
🥈 iuli******@gmail.com
🥉 fran*****@proton.me
🎁 Your prizes are already waiting:
🥇 3 months Ultra Merch Pack
🥈 2 months Ultra Merch Pack
🥉 1 month Ultra Merch Pack
Winners, check your inbox. We have already emailed you instructions on how to claim your prizes.
Didn’t make the winners list? This is just the beginning. Keep the pace, sharpen your strategy, and stay tuned. More challenges and new chances to prove yourself are coming.
4
744
Dear Traders,
Trading teaches us patience, resilience, and the ability to start again, no matter how the last trade went.
Easter carries that same meaning.
A reminder that every setback can turn into growth, every challenge into experience, and every new day into another opportunity to do better.
Warmest wishes to you and your family on this holiday. Wishing you clarity in your decisions, discipline in your strategy, and confidence in your journey both in trading and beyond.
Warmest wishes,
The ATAS Team

1
8
776
♟️ ATAS Challenge: Checkmate the Market
From March 31 to April 10, we're launching the April Challenge a risk-free prop trading simulator in the ATAS demo environment. Test your skills in real market conditions without risking your deposit. Just you, the market, and volume.
✅ Evaluate your strengths and weaknesses
✅ Share performance statistics
✅ Prepare for real prop challenges
💎 Win valuable prizes
🏆 Register via the link
notion.atas.net/atas-challen…
🟢 Start: March 31, 09:00 UTC
🏁 Finish: April 10, 09:00 UTC
Participation is completely free!
👍 To participate in the tournament, access to the US market is required.
⚠️ Disclaimer: This Challenge is a trading simulation conducted exclusively for educational and competitive purposes. It does not constitute financial advice or an investment service.

1
2
715
Do you always record all trades in your journal, or do some of them sometimes “not count”? 😉
4
14
866
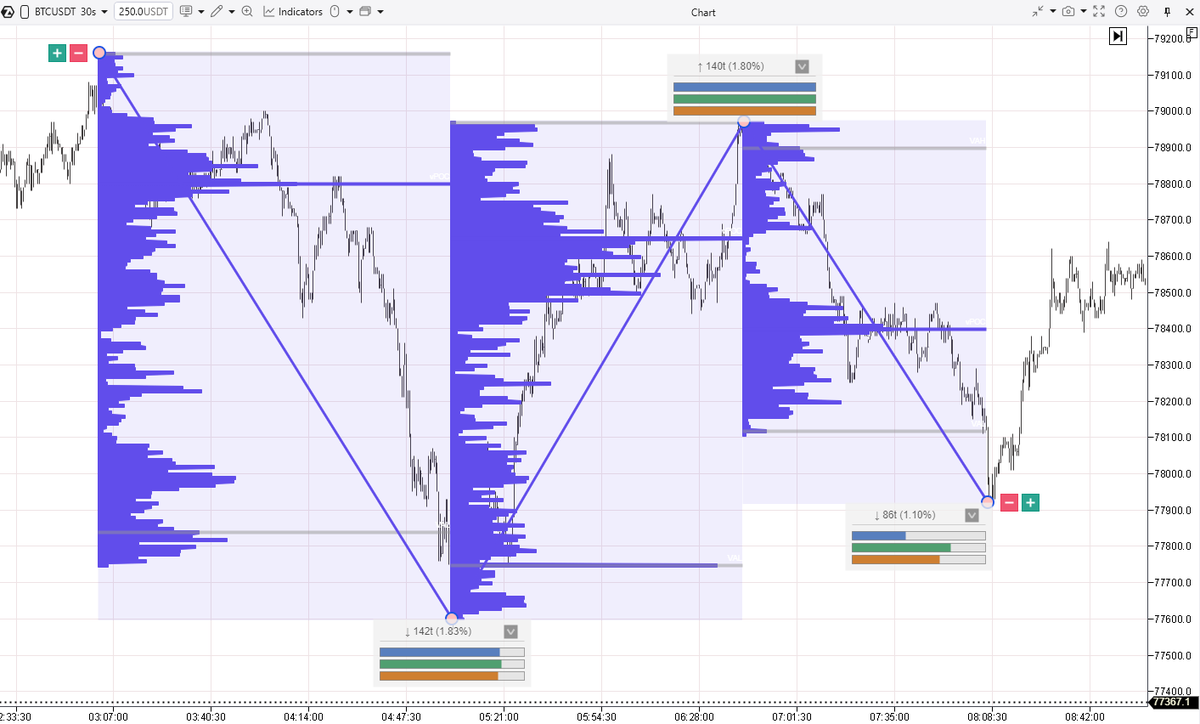
ZigZag TPO & Profile. Analyze the strength of market waves in just a few clicks.
ZigZag TPO and Profile is a unique drawing object in ATAS that is not available in other analytical platforms. It combines wave analysis with detailed volume information inside each market swing.
💡What is the value of this feature?
Now you can quickly mark market movements into swings and evaluate their internal strength in just a few clicks.
The tool shows the volume distribution inside each wave, which helps to:
🔹 find balance and imbalance zones
🔹 identify local support and resistance levels
🔹 see where the price spent the most time thanks to TPO
For each swing, a profile is built and three scales are displayed to compare waves:
🔵 Blue scale - volume relative to other waves
🟢 Green scale - movement speed (price : time)
🟠 Orange scale - wave density (volume : price distance)
Click the dropdown menu to see the exact values of these metrics.
How to use the tool
1️⃣ Select ZigZag TPO and Profile in the Volume Analysis section of the drawing objects menu
2️⃣ Click on the extremes to build the wave structure
3️⃣ Right-click to finish the drawing
4️⃣ Need to adjust the structure? Simply drag the extreme points with the mouse
The tool can also be visually customized like any other drawing object in ATAS.
📱 Video overview is already available on our YouTube
youtube.com/watch?v=pSmNedAc…
🚀 Install the latest version of ATAS and try ZigZag TPO in your analysis.
5
13
966