730 Photos and videos


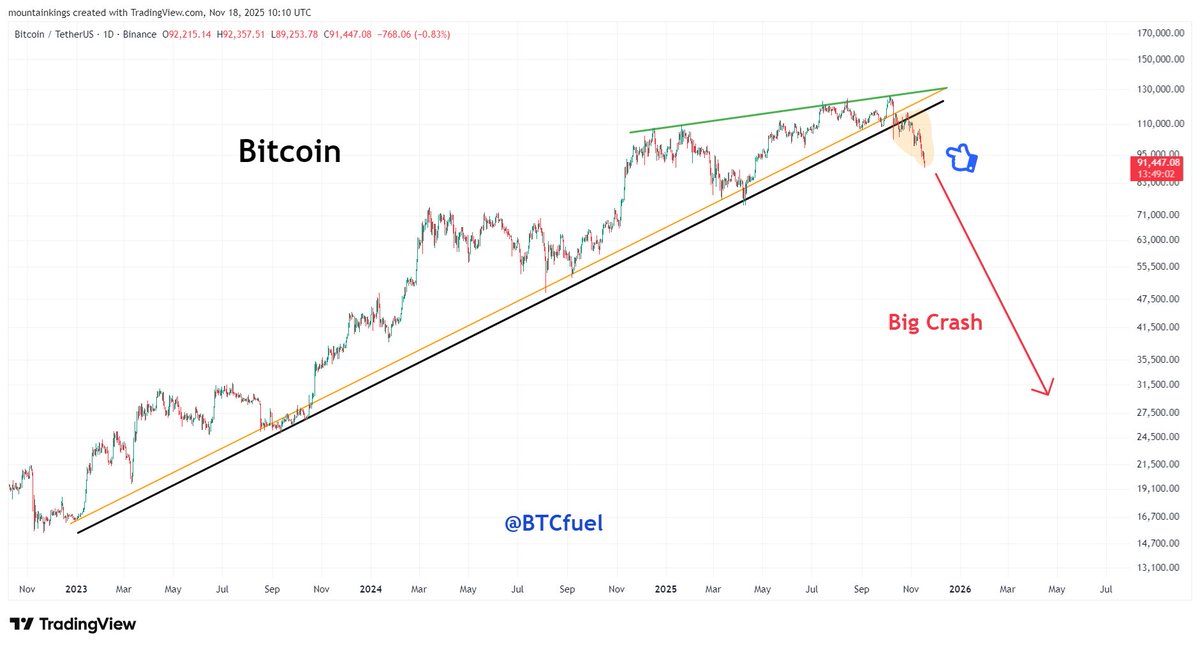

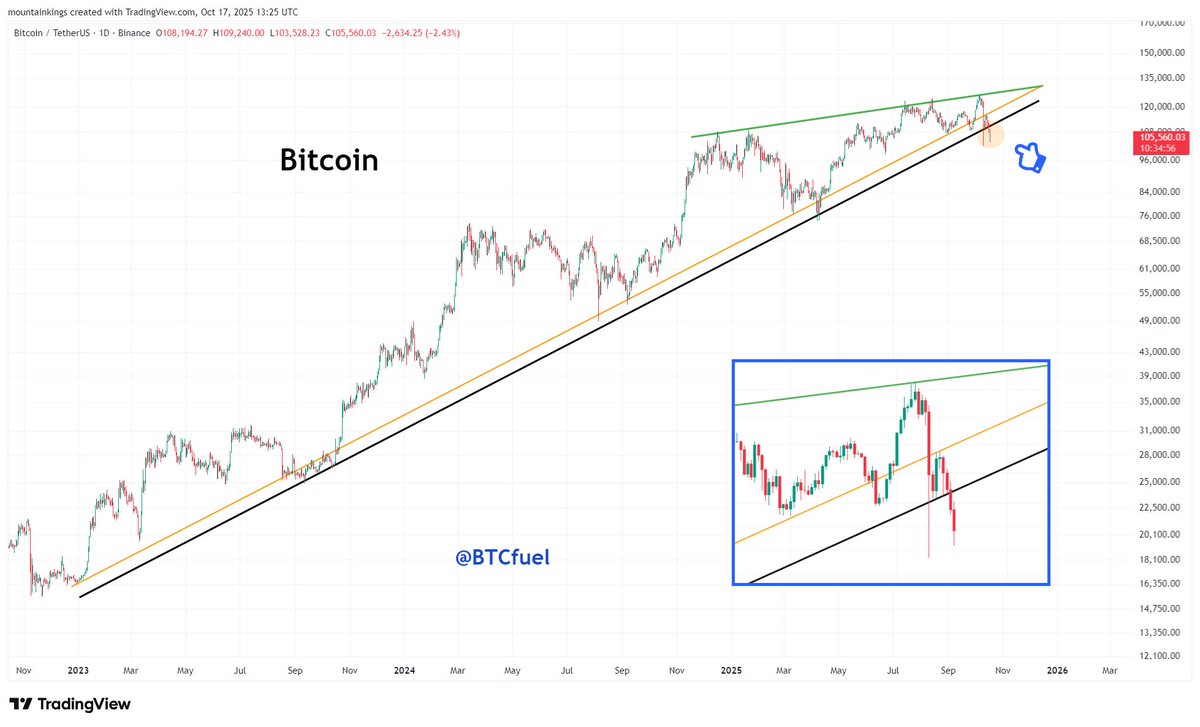

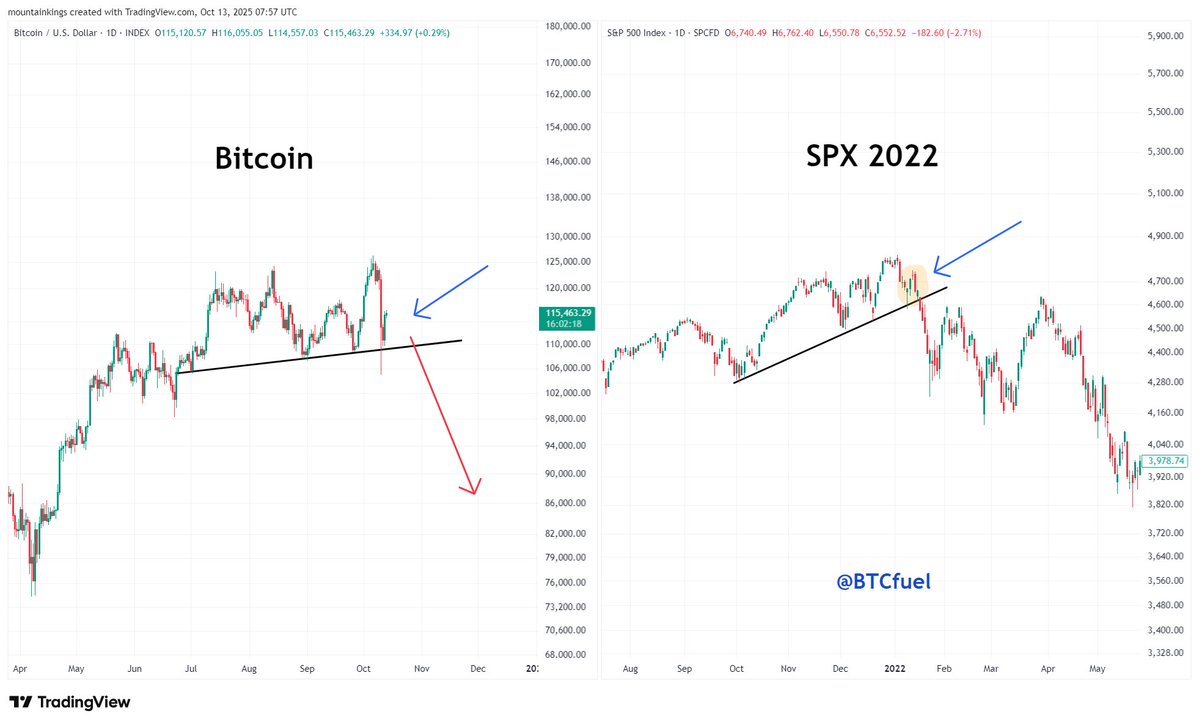
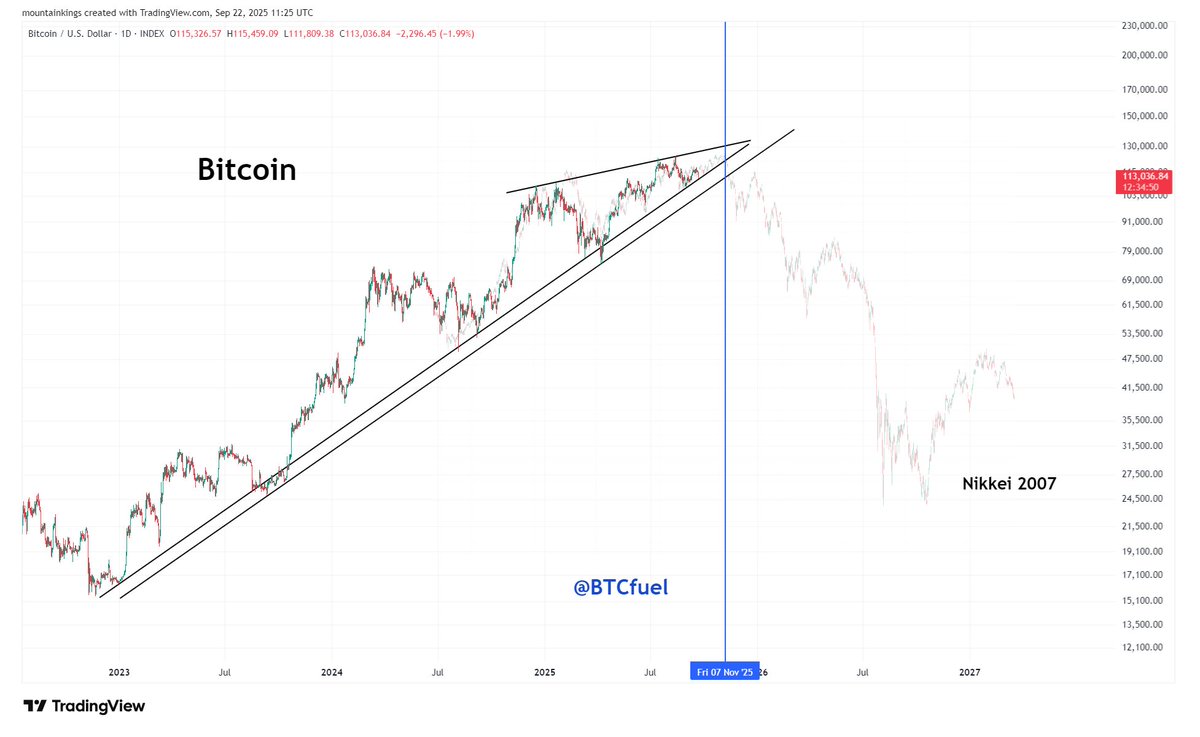
#Bitcoin compared with 3 other market tops. Bitcoin is currently very likely in the topping area. When it loses the blue trendline it's game over. I expect this to happen before the first half of November. Price could stay below 124k or go to about 130k max, forming a double top
8
19
56
24,683
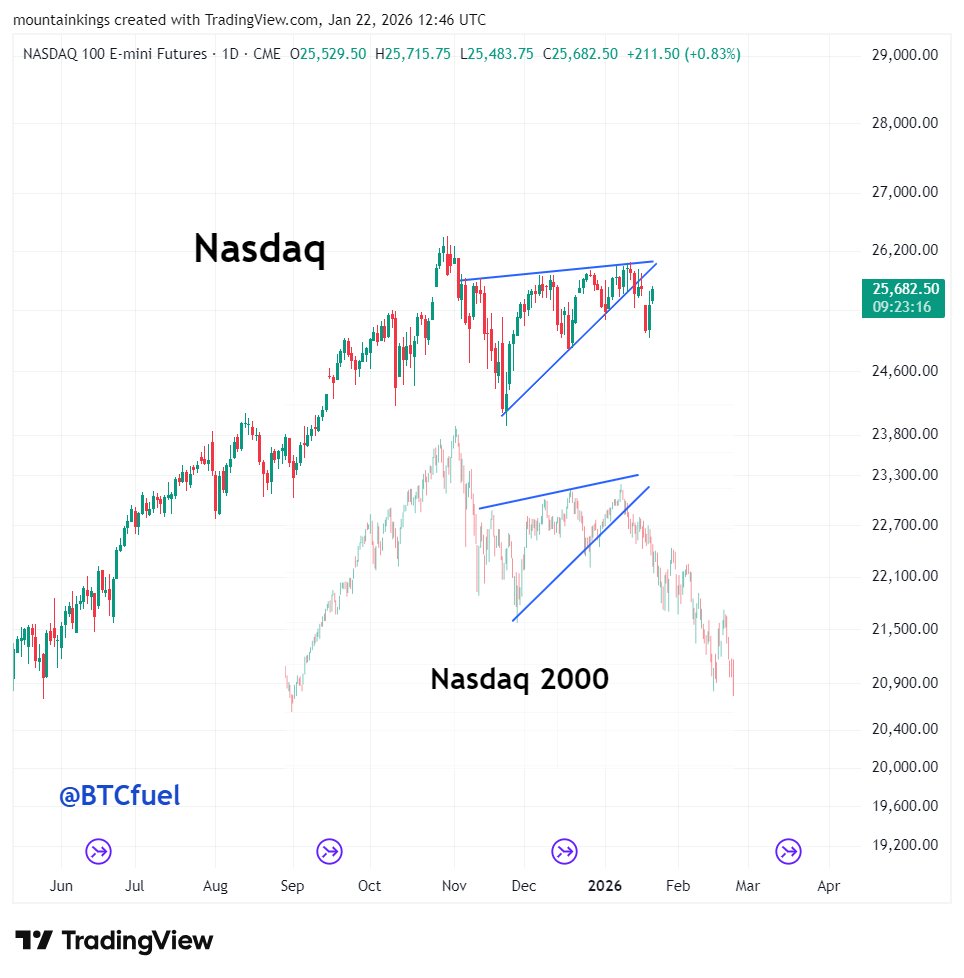
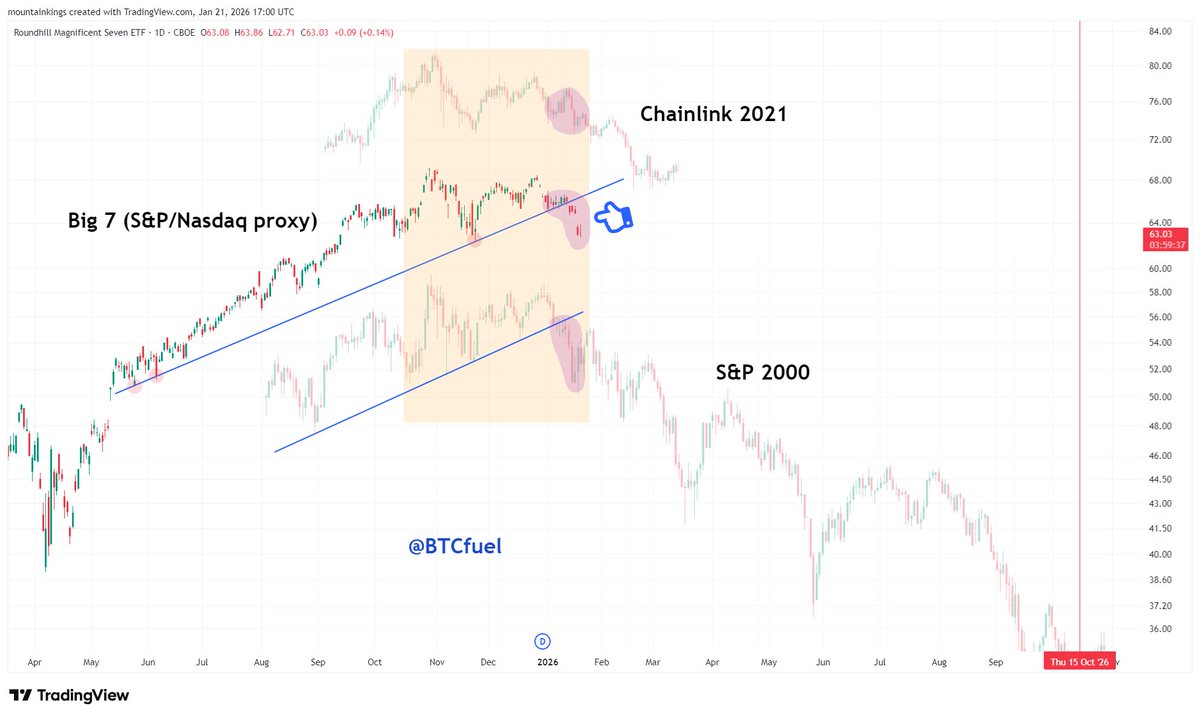
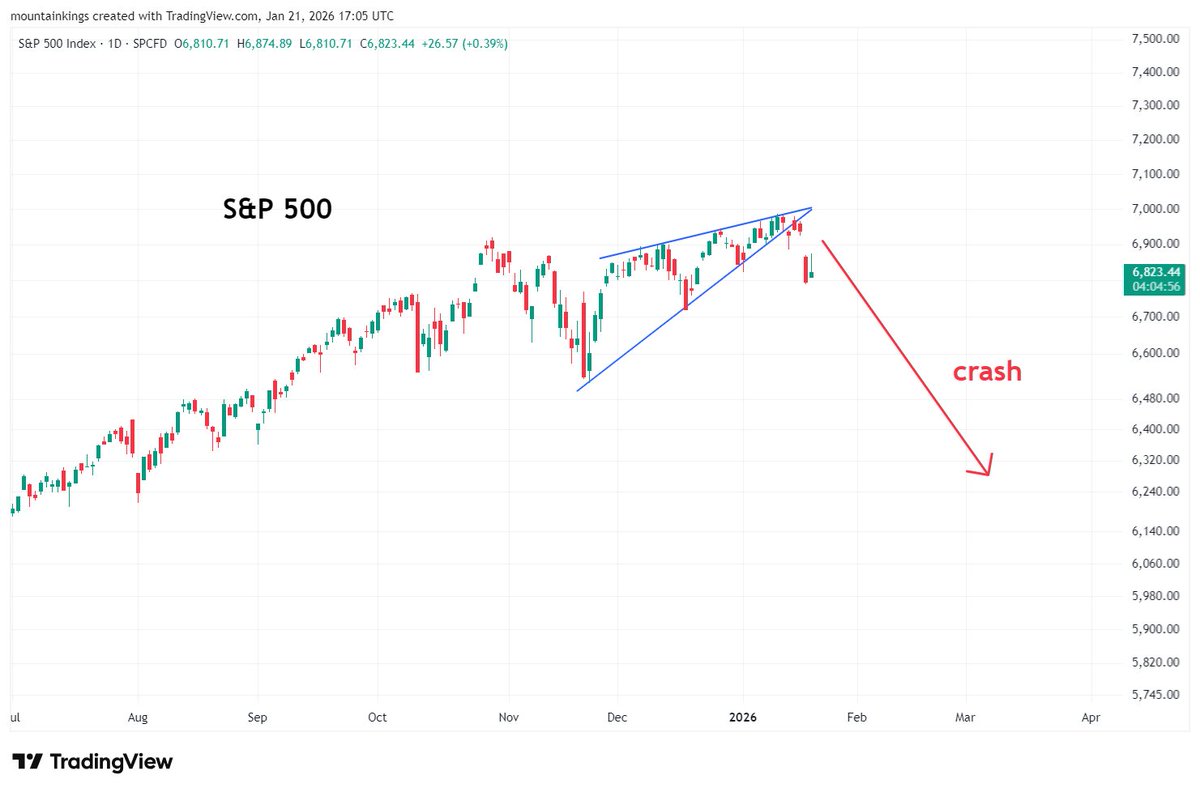
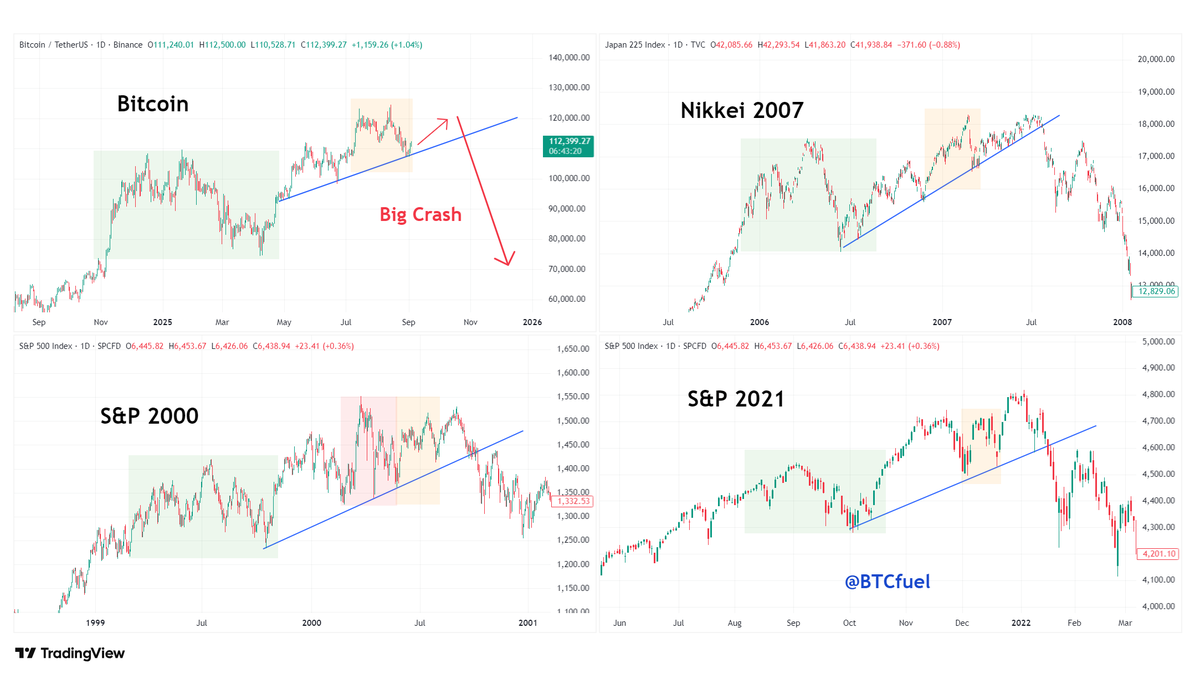
I do not expect the S&P in 2026 follow the same 2000 crash pattern, I think it the drop could be more fast and the crash worse

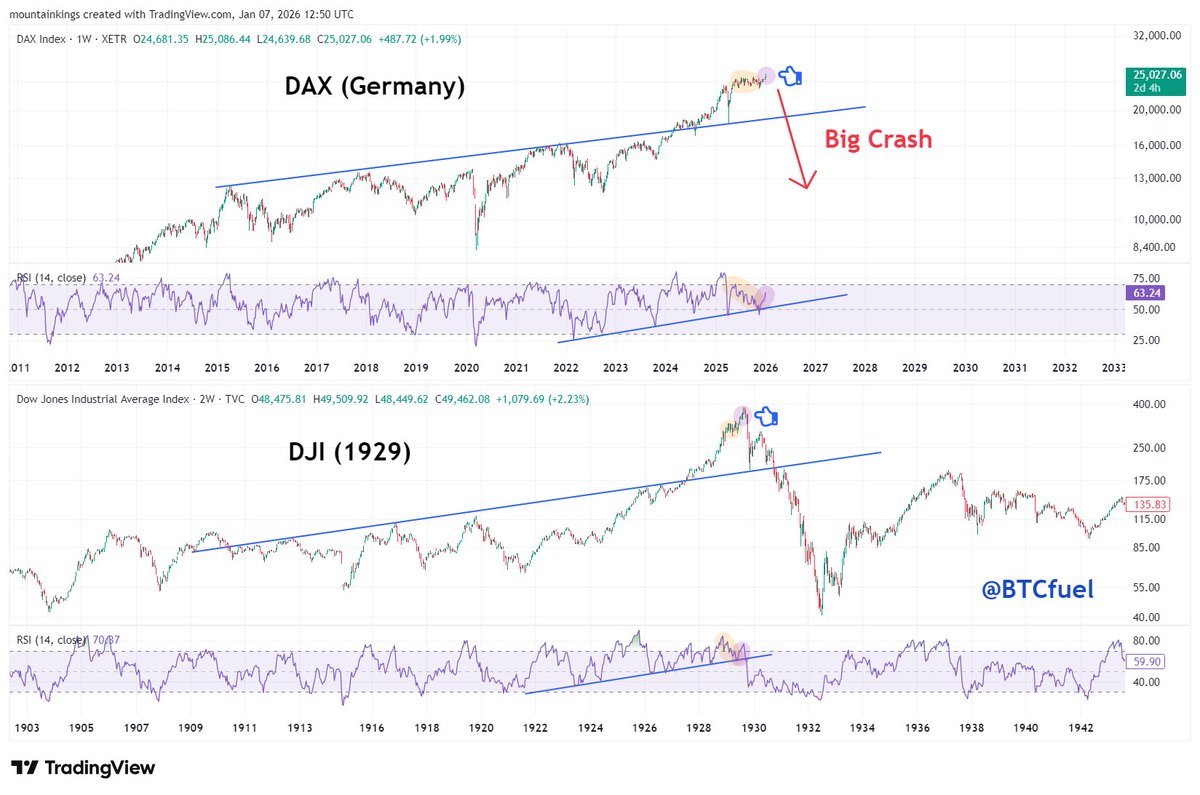
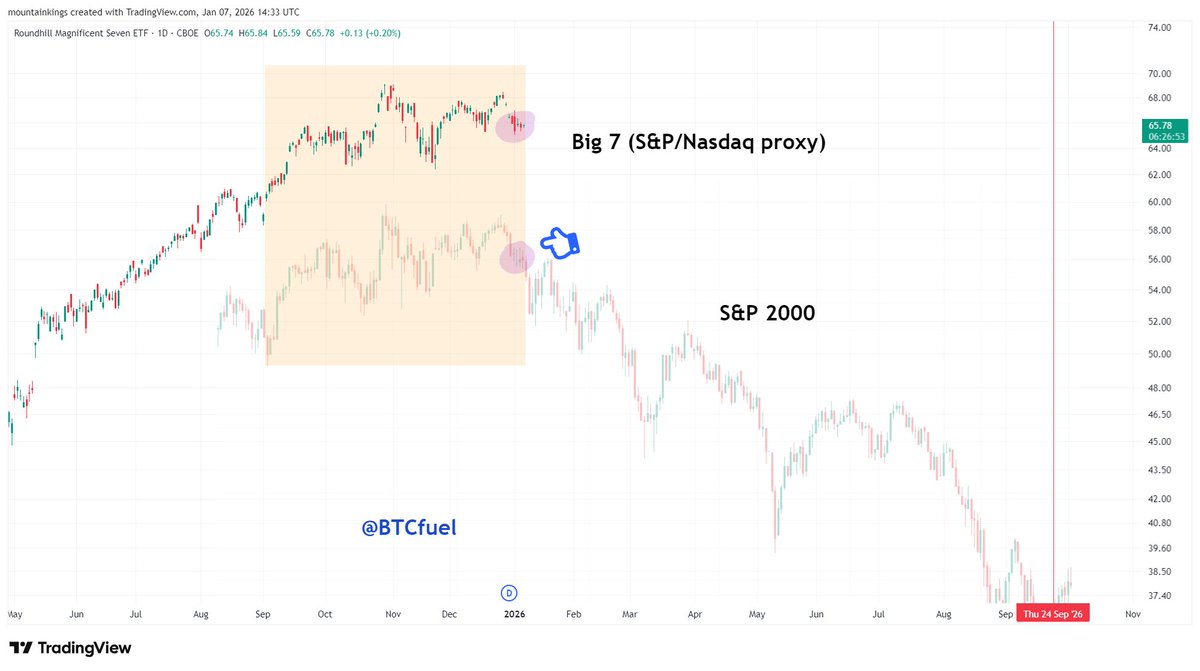
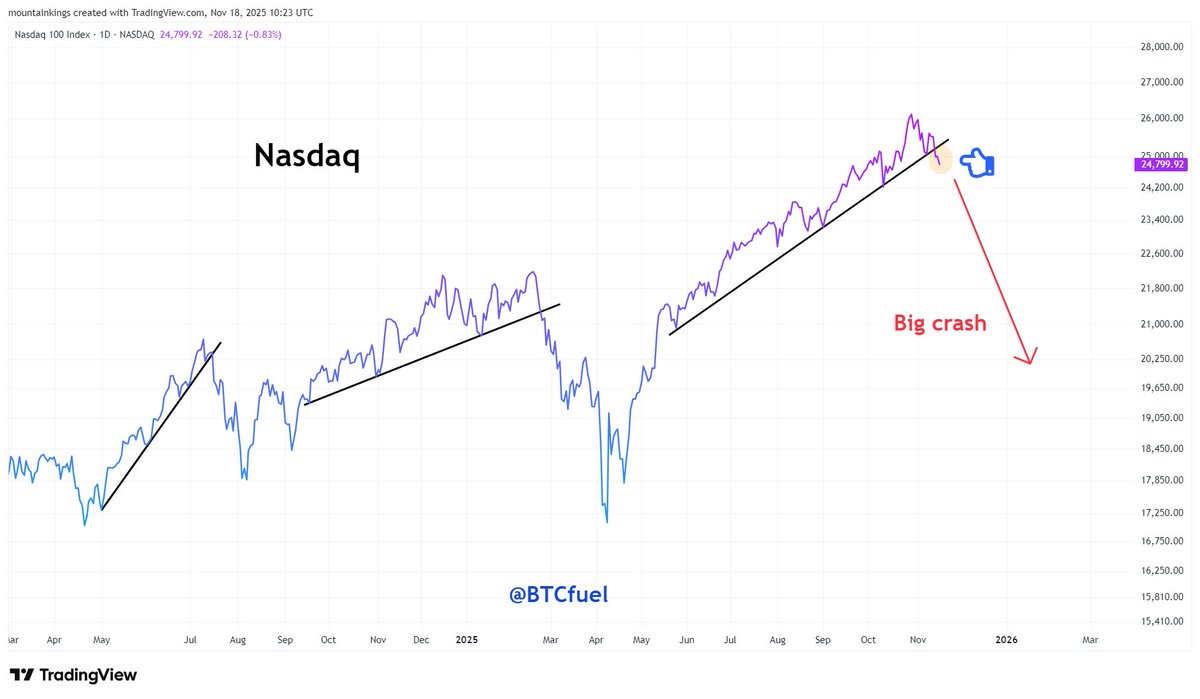
#SPX & #Nasdaq - The big 7 (MAGS ETF) show a similar pattern as the 2000 S&P dotcom bubble top. A big crash is coming in 2026, and possible crash continuation in 2027
1
2
6
1,980
#SPX - I'm not following the spx as closely as Bitcoin, but the top might too be in for the S&P. The last 2 cycles, S&P topped within 2 months after Bitcoin. Also a clear bearish divergence on the daily chart. In case the top is not in yet, it will likely be before christmas
5
2,484