
Bots are out of control and I will only see your posts if you follow me. All posts are for entertainment purposes only.
Joined October 2012
- Tweets 45,737
- Following 2,053
- Followers 9,244
- Likes 21,865
7,308 Photos and videos


Thanks to President XI and China....cyber attack
cloud.google.com/blog/topics…
2
138
I'm giving this deal with Iran a 50% chance of actually working. They could simply be playing another game. Who tf knows...Lock in profits kids.
3
238
$ELTK 14.85 down 7.50 today reported The AMPLIFY-7P study did not meet its pre-specified primary DFS endpoint in the intent-to-treat population results from its randomized Phase 2 AMPLIFY-7P study evaluating ELI-002 7P in patients with adjuvant mKRAS-driven pancreatic ductal adenocarcinoma (“PDAC”) following completion of standard locoregional therapy.
3
192
$CAST 1.55 up 3.80 from Fri said it is expanding its DIRECTV relationship across residential and Platform-as-a-Service (PaaS) ecosystems, positioning DIRECTV streaming (which no longer requires a home-mounted satellite dish) as a core integrated subscription offering within its consumer, residential and enterprise partner network.
5
339
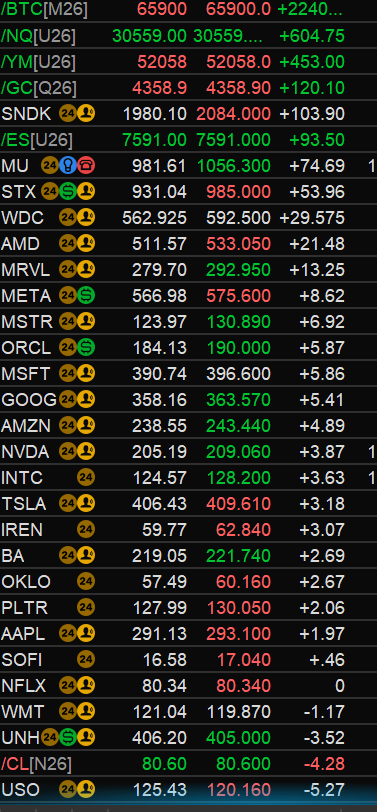
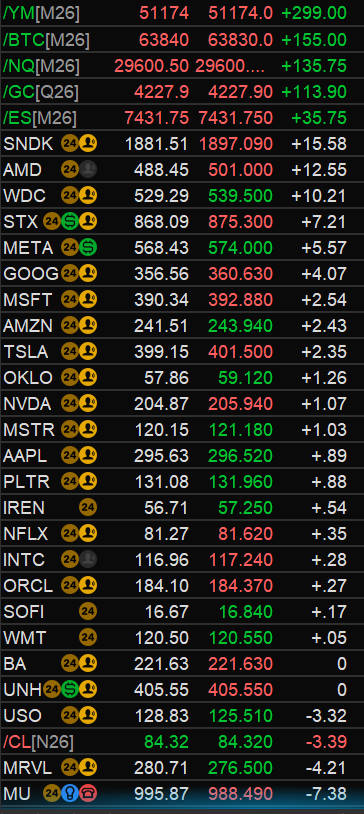
$IREN 59.77 up 3.70 today announced it has completed the acquisition of Ingenostrum, S.L. (Nostrum Group), a developer of grid-connected AI data centers based in Spain
6
289
$OUST 39.80 up 3 and Benchmark Electronics (BHE) expanded their long-standing manufacturing partnership to ramp up high-volume production of Ouster's new Rev8 OS digital lidar sensors, the companies said Monday.
4
299
$STX 93104 up 60 Morg Stanley pt to 1035 from 767 maintains overweight
4
305
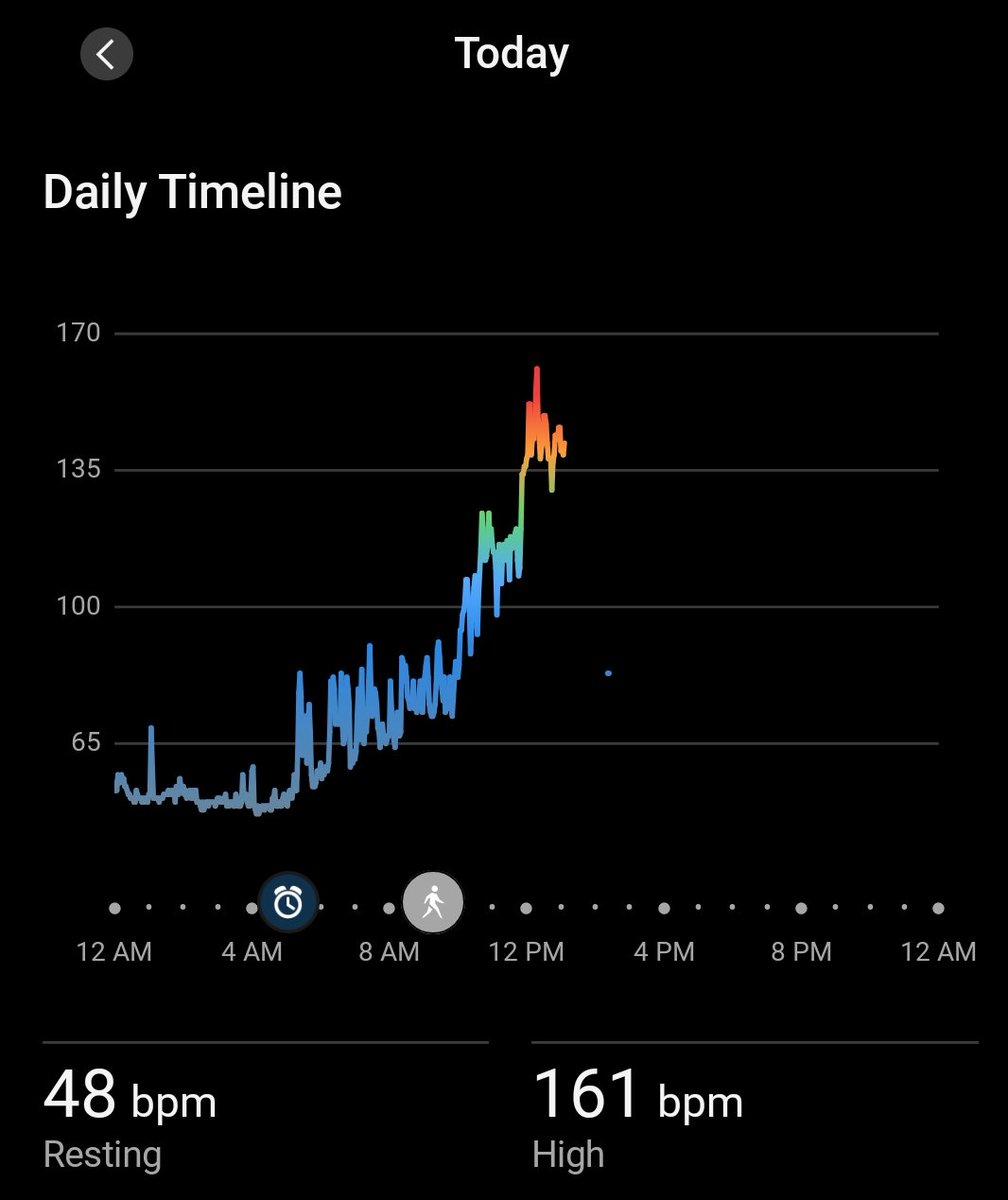
Good 'I helped a neighbor for 6 hours yesterday put down sod in 100 degree heat index so I'm a little tired and how long will 'this' ceasefire last' Monday morning. Let's find a few...
1
8
267

Jun 13
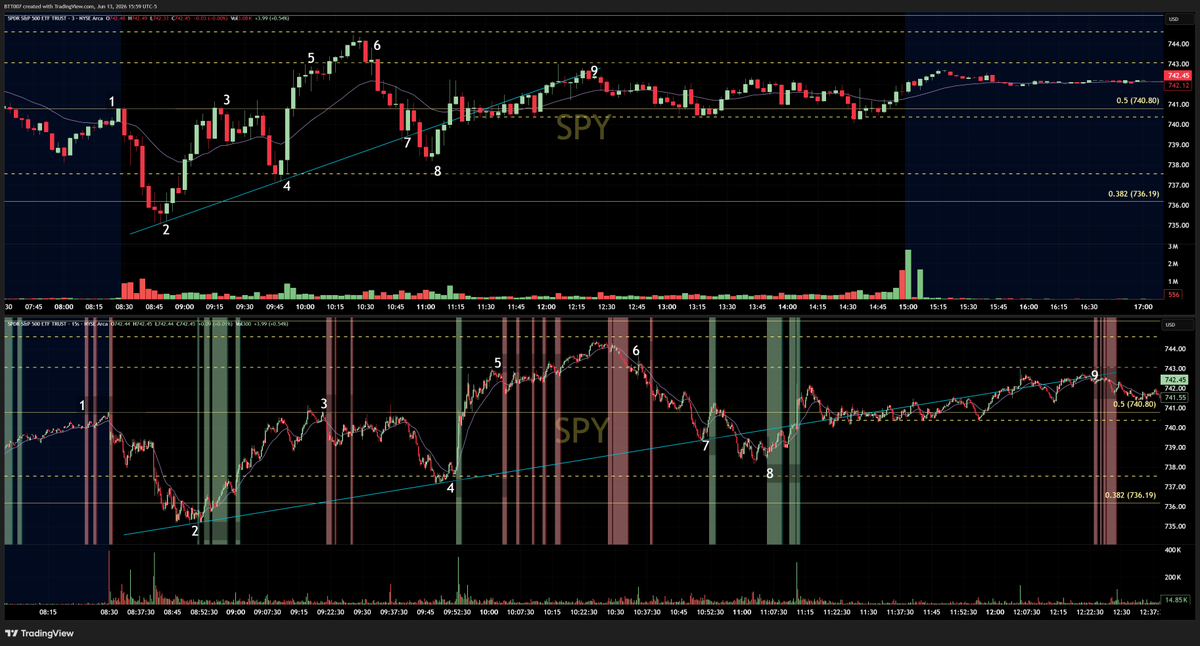
Mental breaks @MarkMoses777 and how we always get pulled back to the markets. Some early afternoon coding and, hmmmmm...what do we have here? Possible momentum shift turning points? On the top the 3min $SPY and the bottom the 15sec $SPY. The first red bar in a sequence on the 15sec chart (bottom chart) shows where the momo is potentially changing on the longer time frame to bearish and green a momo shift to bullish. Remember kids...trends begin and end on the shortest timeframe, the 1 tick chart. But, good luck reading that. Numbers on the 15sec chart synced with the 3min chart. Now, we add this to your ST option flow bro and...
1
7
1,935