
Data scientist turned full-time crypto trader since 2016. Math, data, and history over hype and vibes.
Joined September 2016
- Tweets 3,924
- Following 360
- Followers 6,085
- Likes 2,931
1,155 Photos and videos


Receipts. 📋
Track record: 32-15 directional (68%), range cover 69% over 47 days.
Yesterday: neutral call -> BTC 0.4%, in range. [OK]
Not here to predict every wiggle. Here to be right more than wrong and show you the work. NFA.
1
30
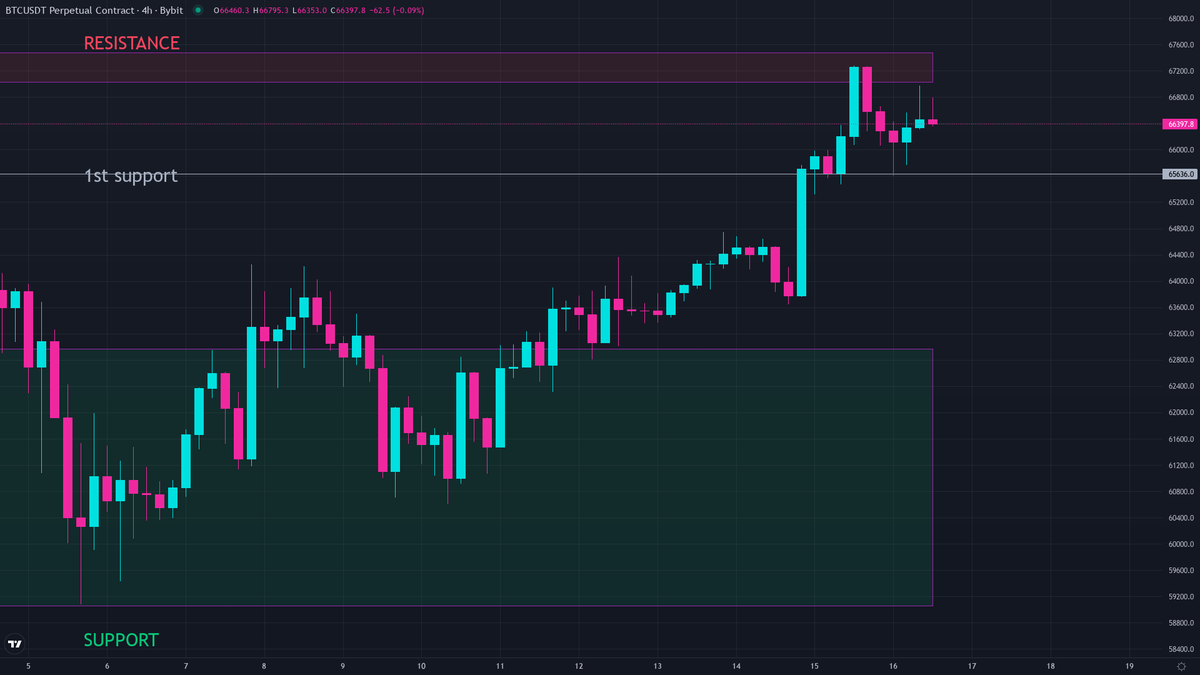
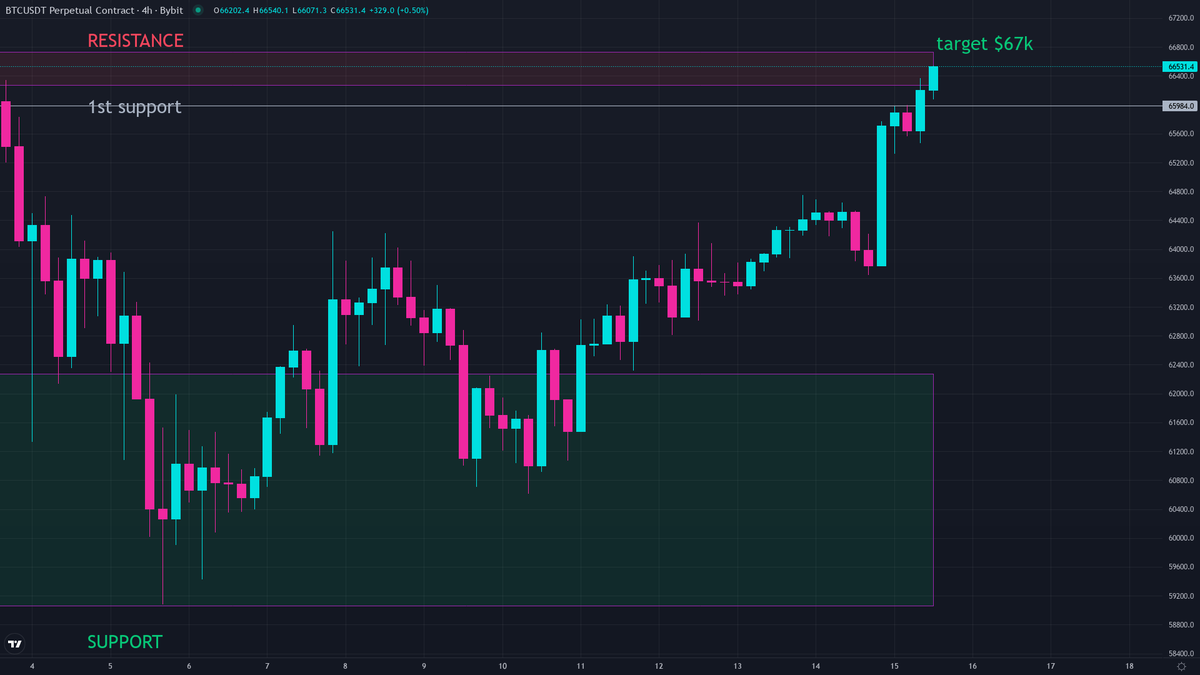
Game plan: watch $67,250.
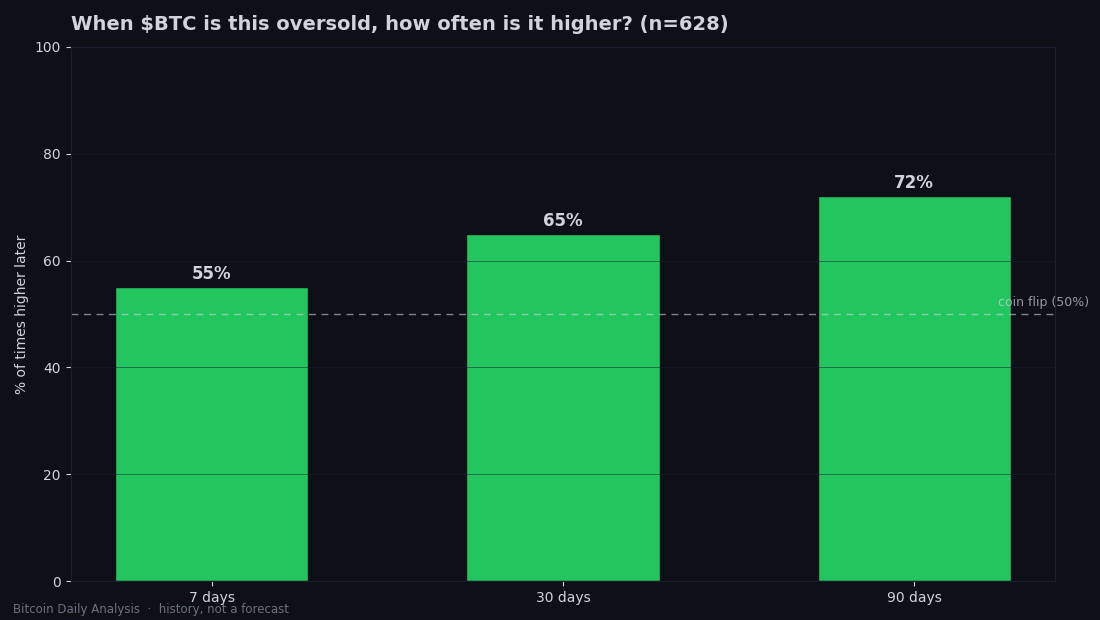
Reclaim it hold = next leg toward $72k opens. Fail to break it or lose $65,466 = June seasonality takes over.
Stay patient. Size your positions to survive being wrong.
NFA. Trade your plan. 📌
24
Bitcoin Daily retweeted

Jun 15
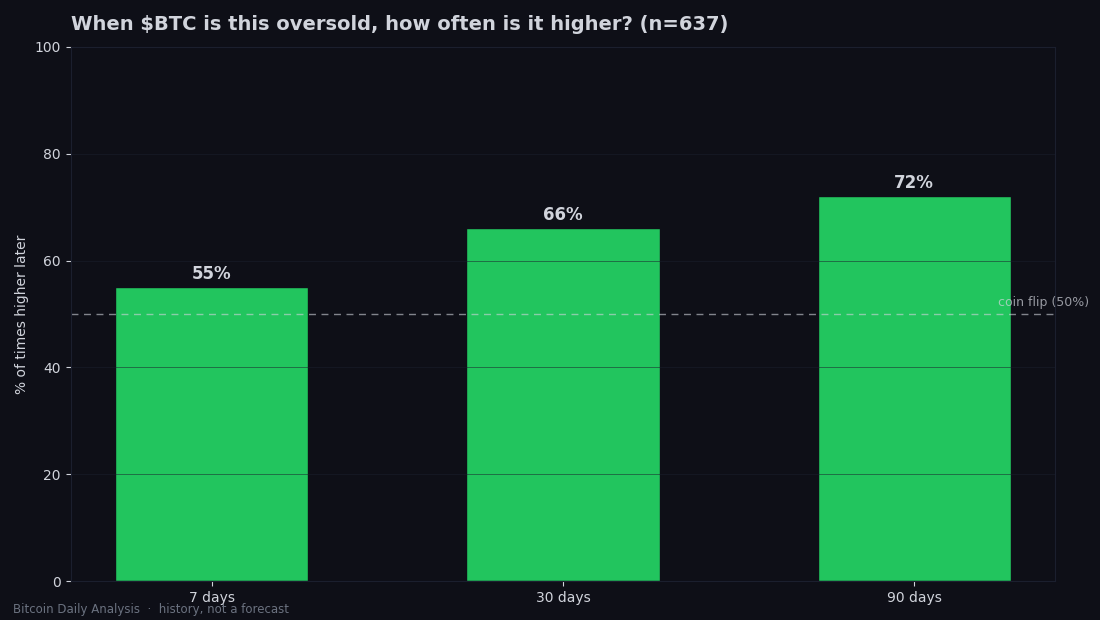
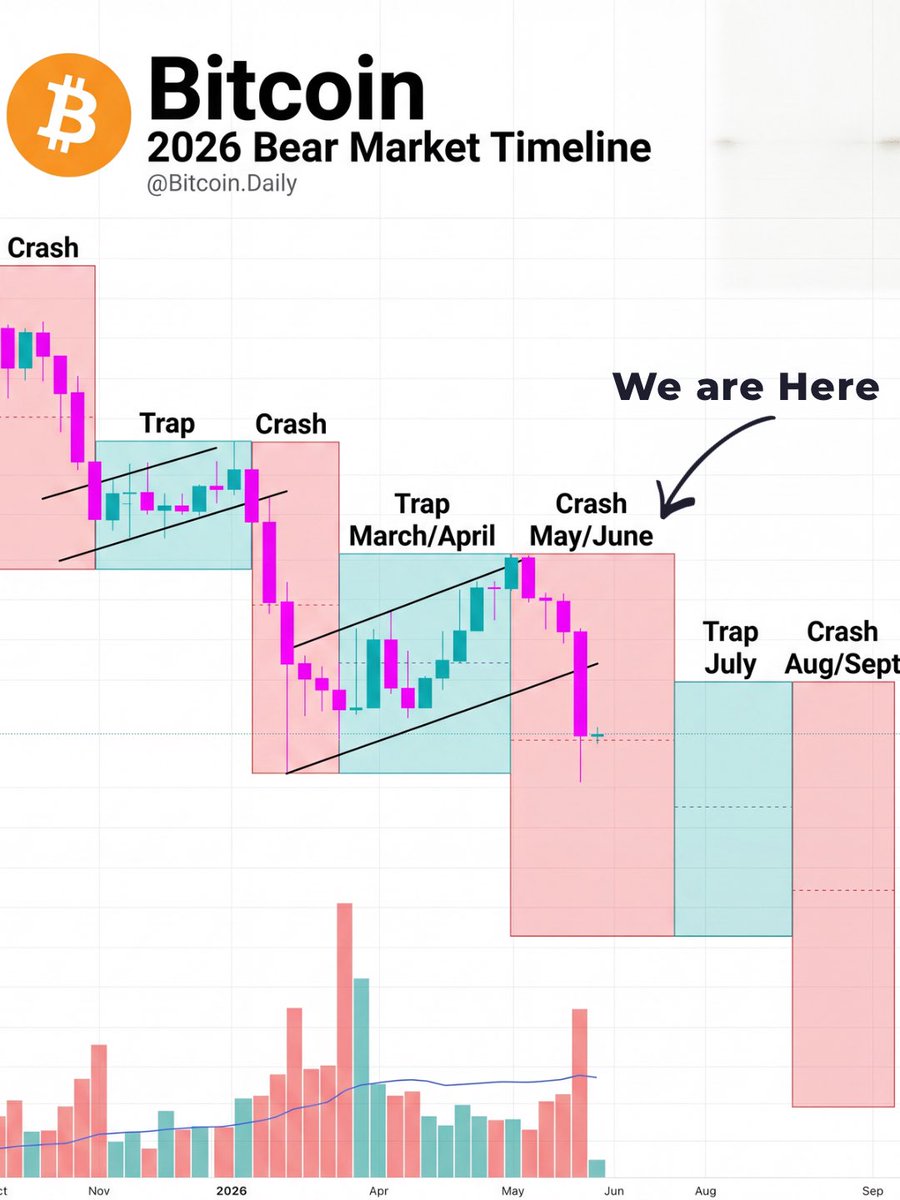
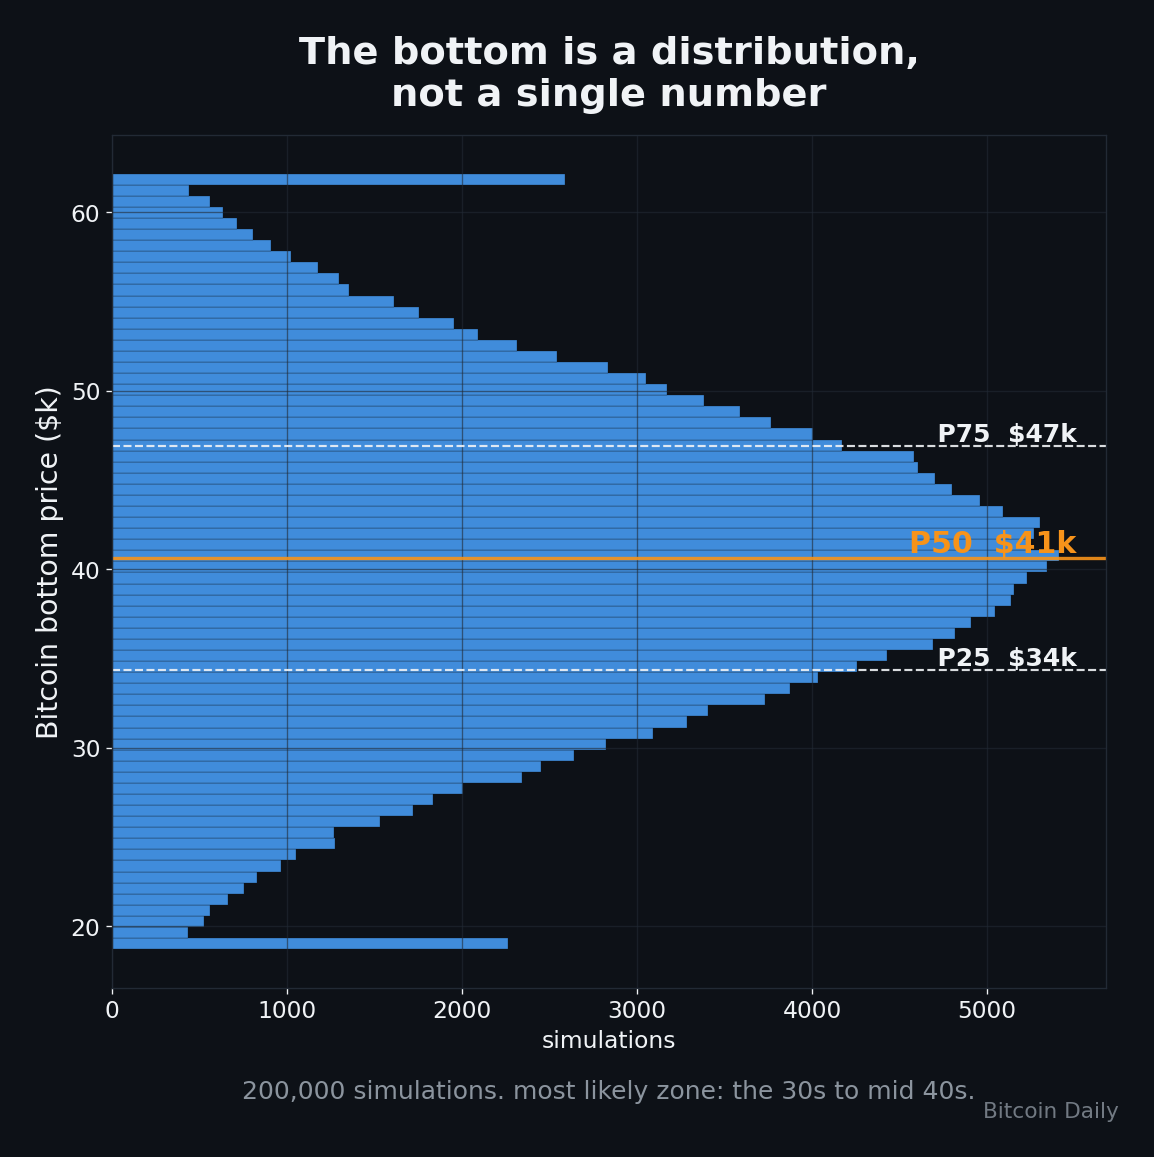
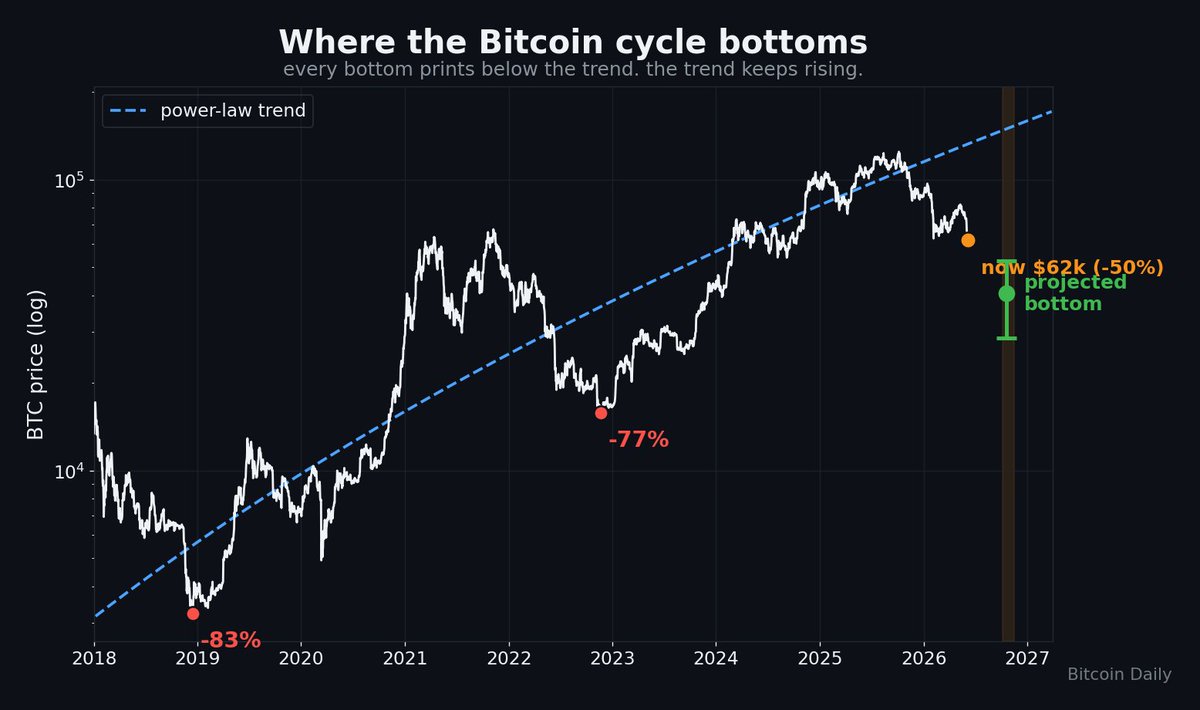
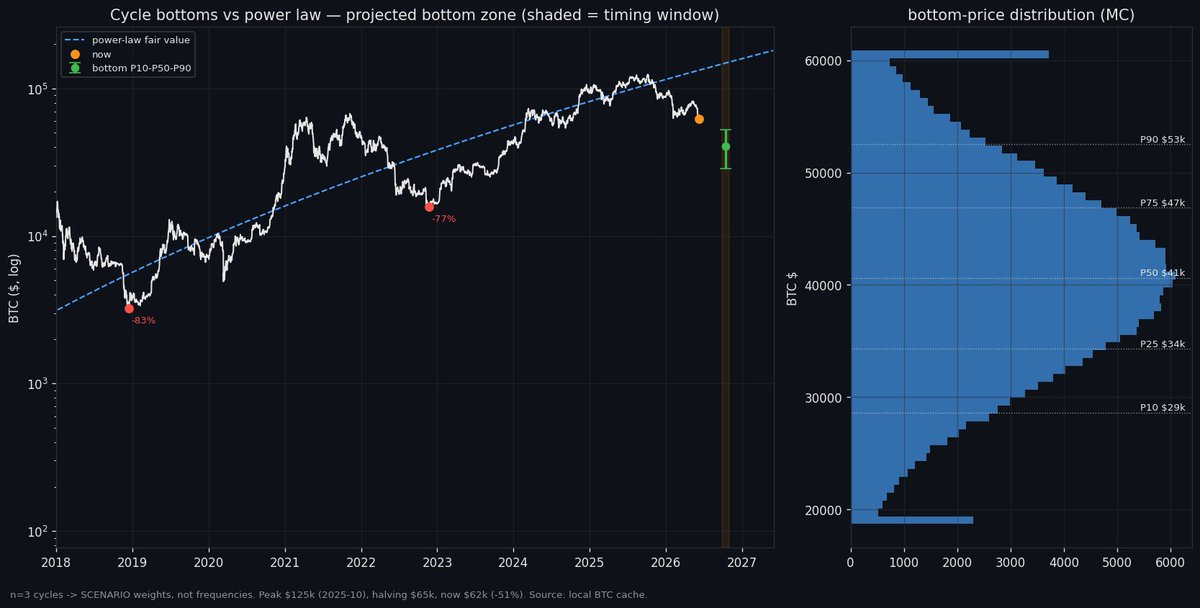
Everyone gives you one number for the Bitcoin bottom.
I ran 200,000 simulations on 15 years of cycle data instead.
The honest answer is a distribution, not an exact number.
Lets break it down.
1
2
4
349
Jun 15
$BTC Daily Analysis Report 🧵
$66,478 | 1.3% today | 5.3% this week
BTC ripped off $63.6k lows and smashed right into 5-day high resistance at $66,500.
Bottom in - or just a dead-cat bounce into supply? 👇
1
4
217
Jun 15
SCORECARD:
31-15 dir (67%) | Range coverage: 69% | 46 days tracked
Yesterday's call: neutral
BTC actual: 3.6% | Range broke [MISS]
Receipts up. Was too cautious after the flush - extreme oversold range break should have flipped the bias. Noted.
1
67
Jun 15
GAME PLAN:
Watch $66,500. A clean daily close above it opens the door to $70k .
Can't hold it? Expect chop back to $64-65k.
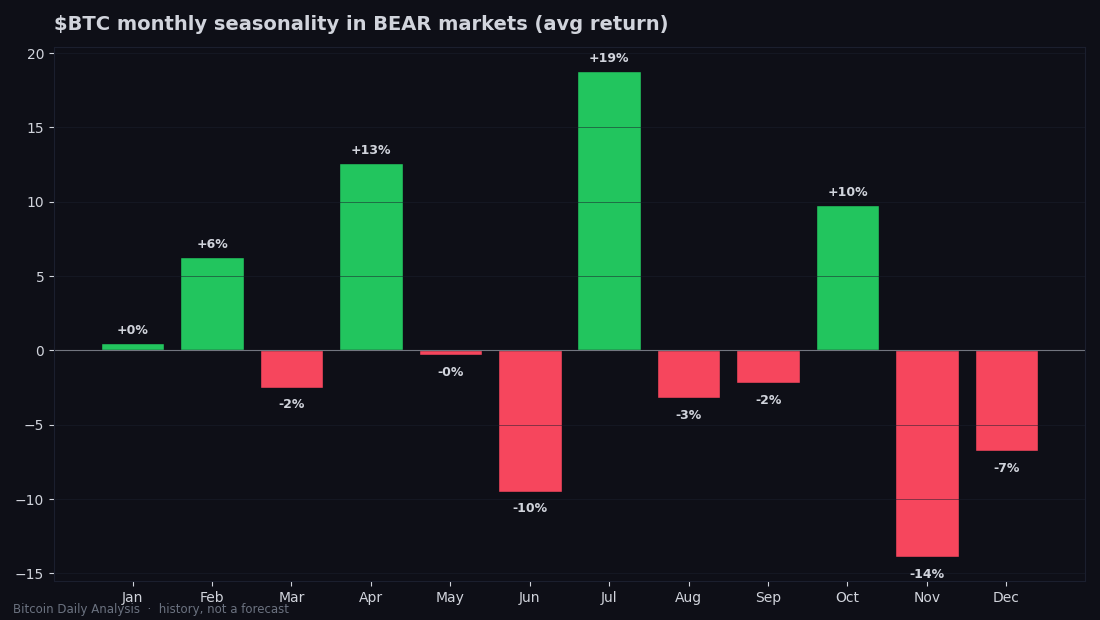
Bear seasonality flat daily trend = don't over-lever either direction.
Wait for confirmation. Protect capital. NFA.
56