
The underpinnings of the machine. Macro, markets, and the technical observations of price.
Joined March 2018
- Tweets 10
- Following 19
- Followers 22
- Likes 10
7 Photos and videos


Jun 13
The tell isn't the high, it's the retest of it.
Anchored VWAP from the top is where the bounce gets judged. Price that can't get accepted back above it builds a lower-high complacency shoulder.
Failed retest = the trend never broke. It just paused.
Anchored VWAP to the prior highs gives us a defined area for continuation or collapse. $SOXL
22
Jun 10
Discipline isn't restraint you experience as suffering. It's what's left when you stop needing the trade to mean something about you.
27
Jun 10
Felt urgency is not real urgency. The market will hand you another setup. It will not hand you back the capital you torched forcing one.
41
Jun 8
The semi parabola is the same shape as Nasdaq 2000 and BTC 2017: vertical final leg, then violent swings both directions as the trend exhausts. Larger down days chased by a smaller % bounces.
It's volatility expansion at the top. Confirmed when the next lower high holds.
47
Jun 5
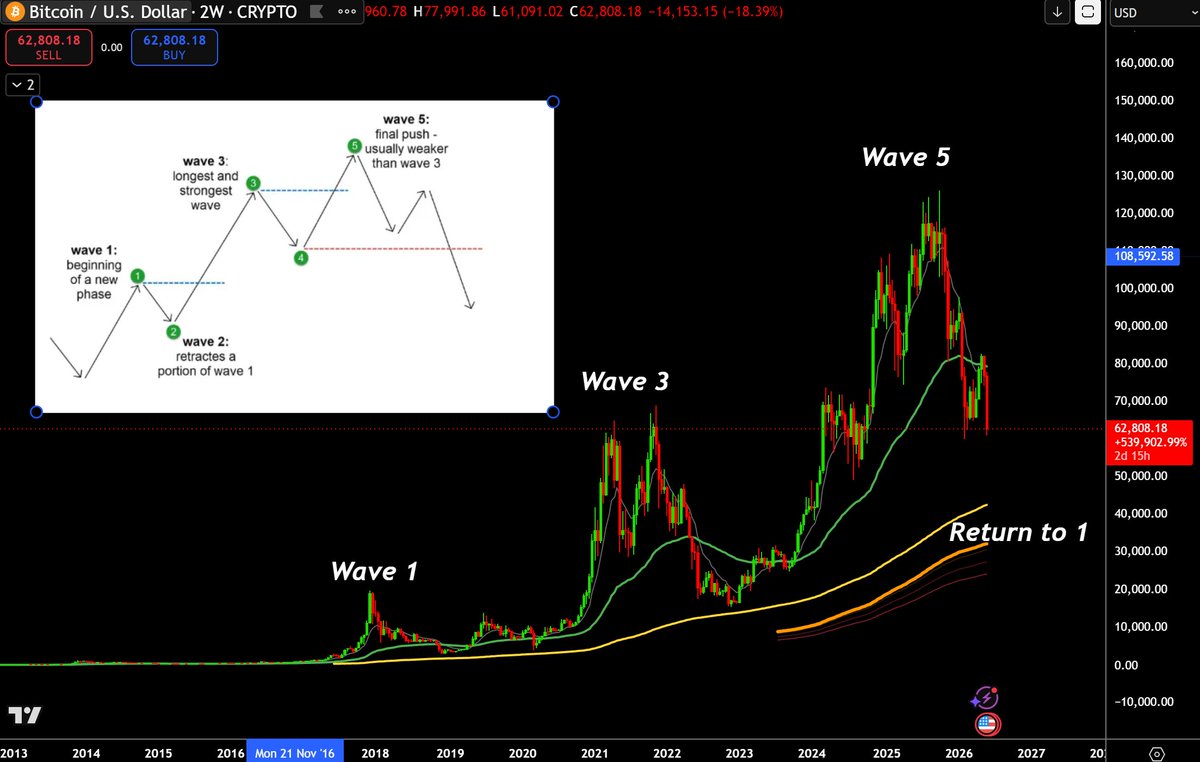
I'll be honest: I hate Elliott Wave. On low timeframes it's a Rorschach test you can count anything into anything.
But on the highest timeframes, where each wave is years long and emotion-driven, the structure gets harder to dismiss. And BTC's full history on the chart counts clean: five waves, textbook proportions, wave 3 the strongest, wave 5 weaker than 3 on every measure.
Here's why I don't dismiss it, it agrees with everything I can actually measure. Wave 5's momentum is visibly weaker than 3's. Each cycle's gain has compressed. And BTC has already shown us what its corrections look like: every major cycle top resolved with a 70-80% drawdown. That's not wave theory. That's its documented base rate.
If the count is right, the A-B-C that follows a completed five targets the prior wave-1 zone the 25-35K region. I hold that loosely; counts are hypotheses, not prophecies.
But notice what it would rhyme with. Semis stretched significantly above their long-term mean. Leveraged vehicles going vertical out of decade ranges. And the largest crypto asset arguably completing its final impulse. None of these is proof alone. Together they describe the same place in the cycle.
49
Jun 5
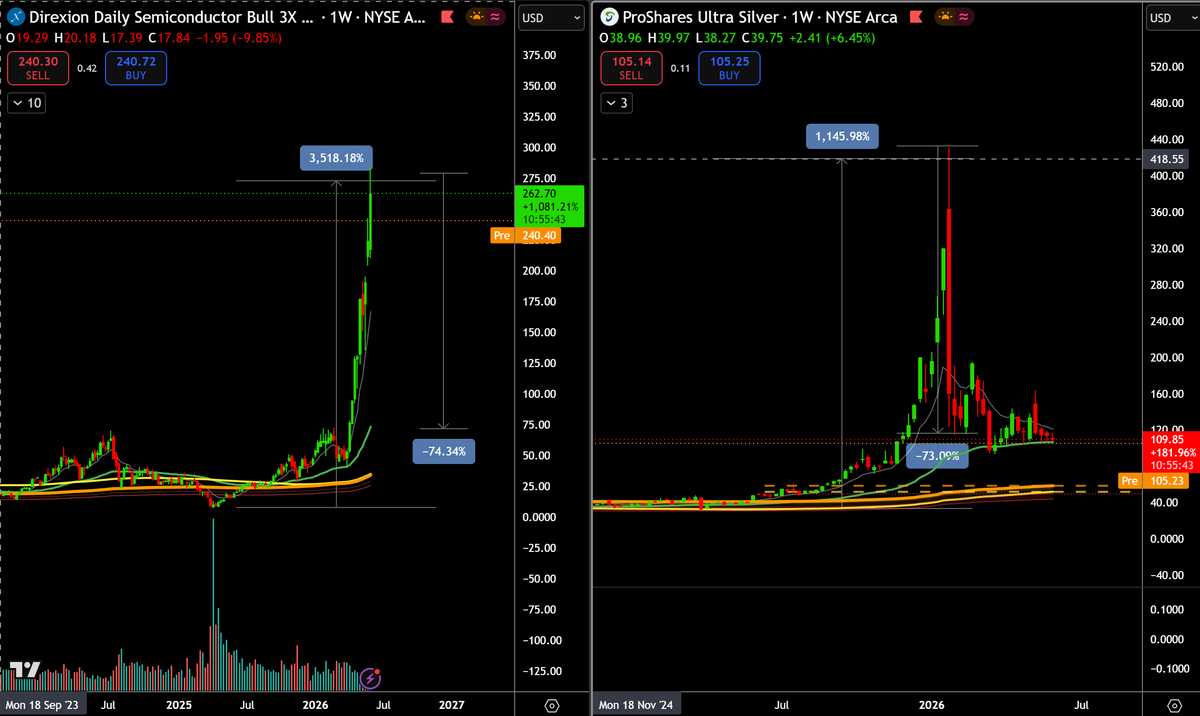
The leveraged pair is telling you where we are.
SOXL the 3x semiconductor vehicle just went vertical out of a multi-year range. 500% in eight weeks.
That kind of move in a leveraged wrapper doesn't happen mid-trend. It happens when the underlying enters its terminal phase and the leverage compounds the blowoff.
Here's what the people buying it up here don't realize: it doesn't take a crash to destroy a 3x vehicle. It takes a pause.
Silver just ran this exact experiment. AGQ 2x silver blew off 1,146%, then gave back 73% in weeks. Silver didn't go to zero. It didn't even fully revert. The vertical phase simply ended, and daily-rebalanced leverage did the rest. AGQ still sits near those lows. Path decay doesn't give it back.
Now run the math on SOXL. A 20% pullback in SMH an ordinary correction, the kind healthy bull markets have is roughly −60% in SOXL before decay makes it worse. In 2022, SMH fell 45%. SOXL lost ~90%.
Every dollar buying SOXL after a 500% eight-week vertical is betting the parabola never even rests.
Parabolas don't rest. They end.
42
Jun 4
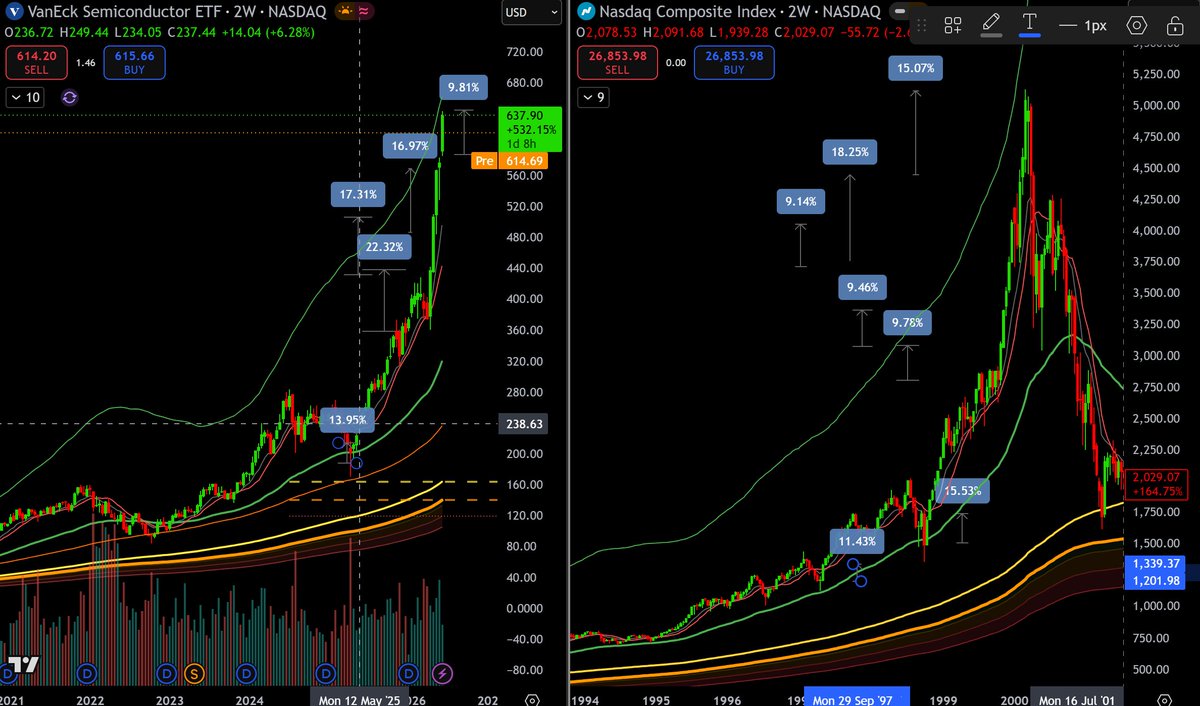
The counter-argument is "we're just getting started." Maybe. But look at what the candles themselves are doing. On the 2W, single bars are now as large as entire legs used to be 22%, 17%, 17%, and the current bar still printing.
That's not what the start of a move looks like. That's what the Nasdaq's 2W candles did in late 1999, the expansion sequence that marked the terminal phase, not the beginning. Same fractal, same place in the structure. Early moves grind. Terminal moves expand. These candles are expanding.
1
68
Jun 3
The AI buildout is real. That's the problem.
Everyone arguing the bull case keeps telling me the revenue is real, the capex is real, the demand is real. Yeah. It is. The internet was real in 2000 too, and those names still came down 80%.
Real doesn't save you. Real is what gives you permission to overpay.
Here's the part nobody says out loud: they're pricing the speed as if it's permanent. As if this rate of buildout is the new floor.
But look at what kind of move this is. It isn't growing fast and steady. It's growing faster than fast, the acceleration is still increasing into the top. That's the tell. Steady growth can run for years. A move that has to keep accelerating just to stay alive is burning fuel it can't refill.
The moment it can't accelerate anymore, not even reverse, just stop speeding up, every dollar that was priced on the acceleration leaves.
That's why the floor isn't where people think. There's nothing level underneath a parabola. There's only the slope. Take the slope away and there's nothing.
I've watched this exact thing empty a portfolio I spent years building.
Going to lay the whole case out over the next while. Charts, the analogs, the math. Stick around if you want the reasoning instead of the noise.
1
2
8
1,050
Jun 3
Same parabola, three different scales — and the magnitude keeps landing in the same place. 261% (SMH), 261% (Nasdaq 2000), 249% (BTC 2017). A small asset compresses it into weeks, an index stretches it over years. The shape and the size are the constant. The clock isn't.
1
82