
Data Scientist ~ Cities Statistics Art ~ ABBA Enthusiast ~ #MetBrewer Creator ~ Cowboy at Heart ~ 🏳️🌈
- Tweets 366
- Following 442
- Followers 1,946
- Likes 4,196


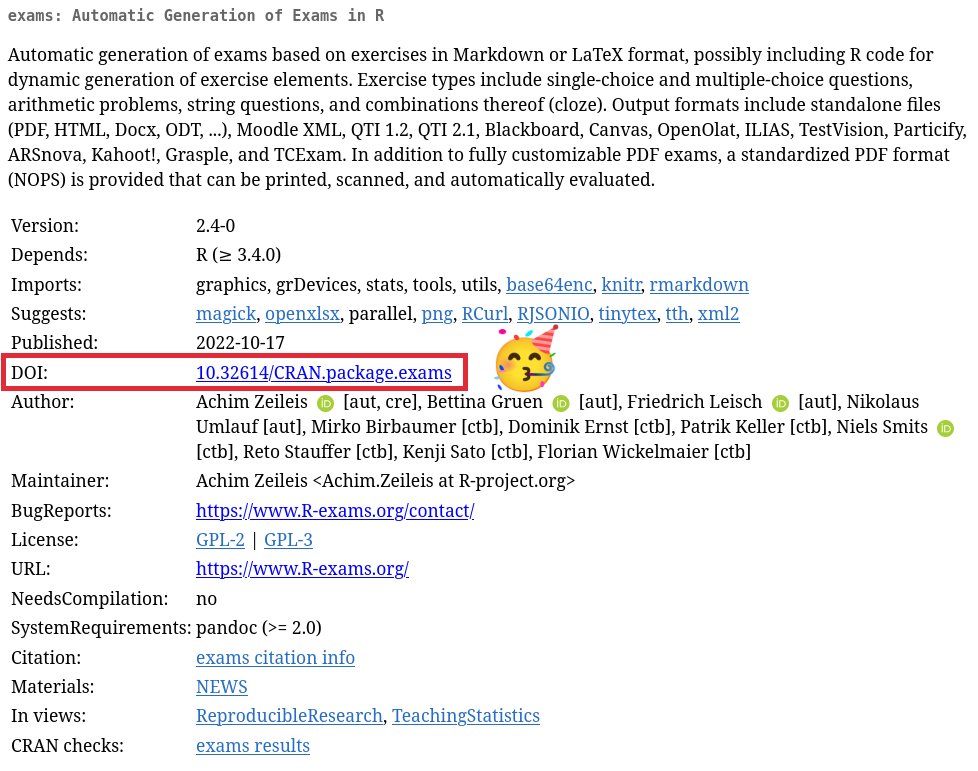
ALT Screenshot from https://CRAN.R-project.org/package=exams - the CRAN landing page for R package "exams". This page now includes the DOI 10.32614/CRAN.package.exams


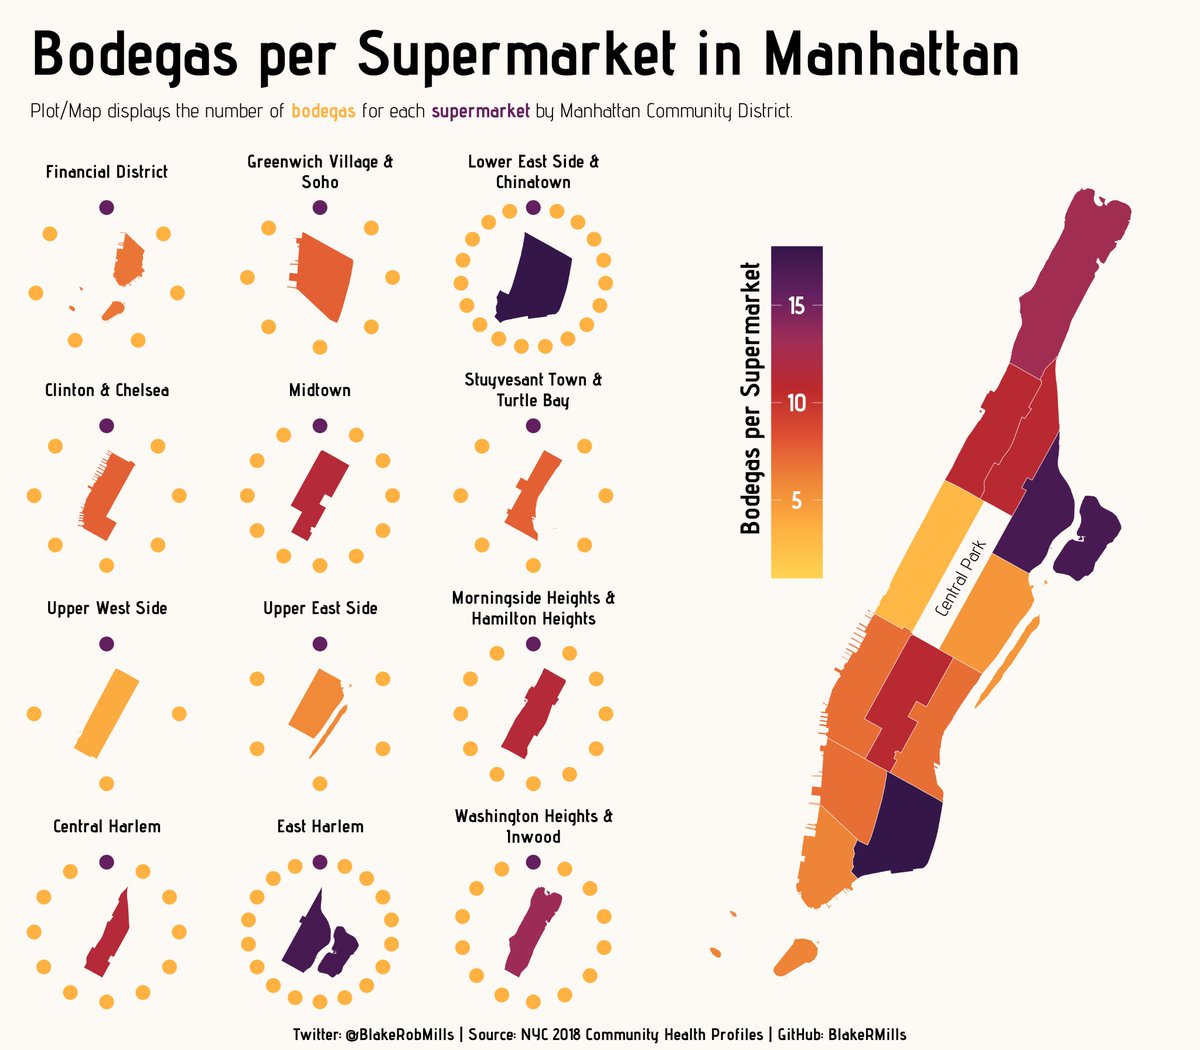
ALT Map/chart shows the number of bodegas for each supermarket in Manhattan.
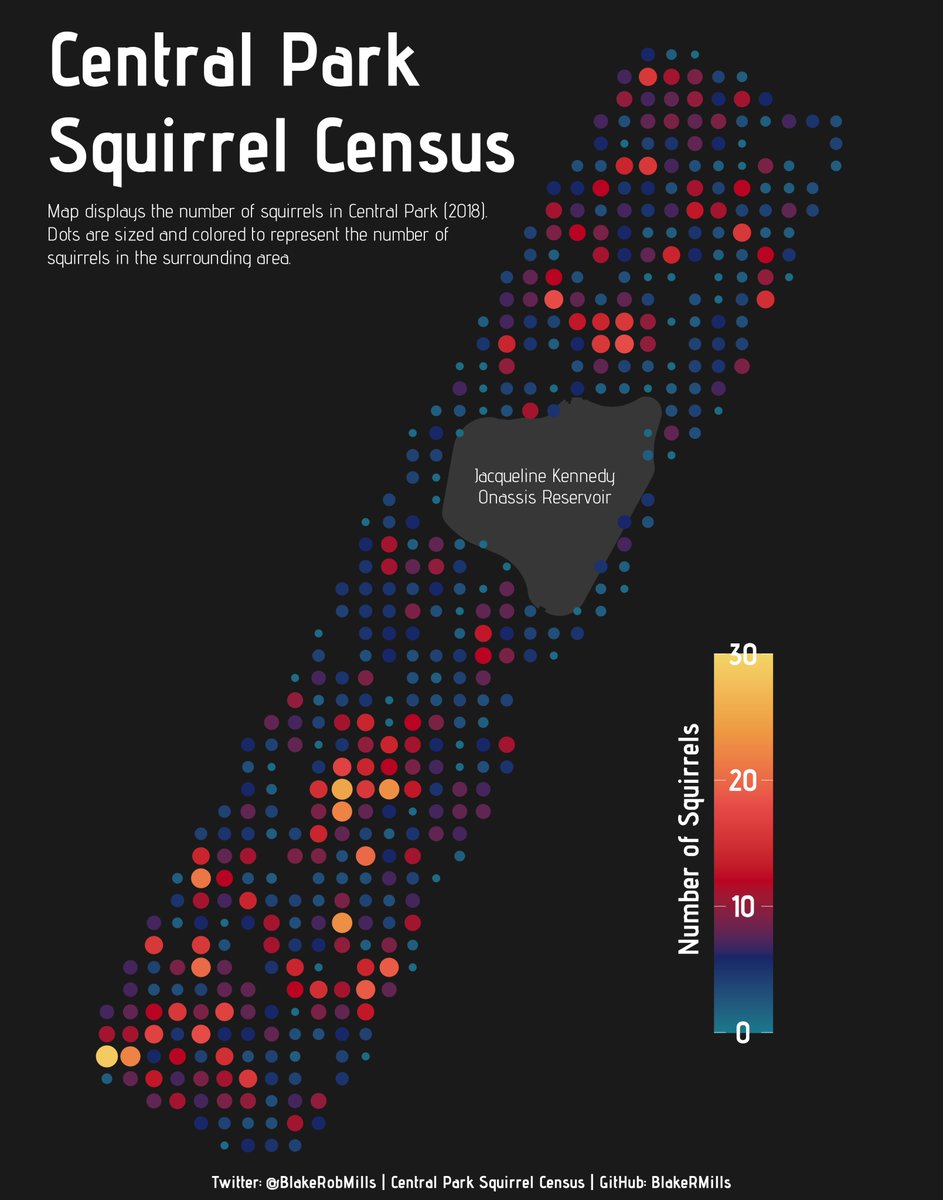
ALT Map displays the number of squirrels in Central Park (2018]. Dots are sized and colored to represent the number of squirrels in the surrounding area.
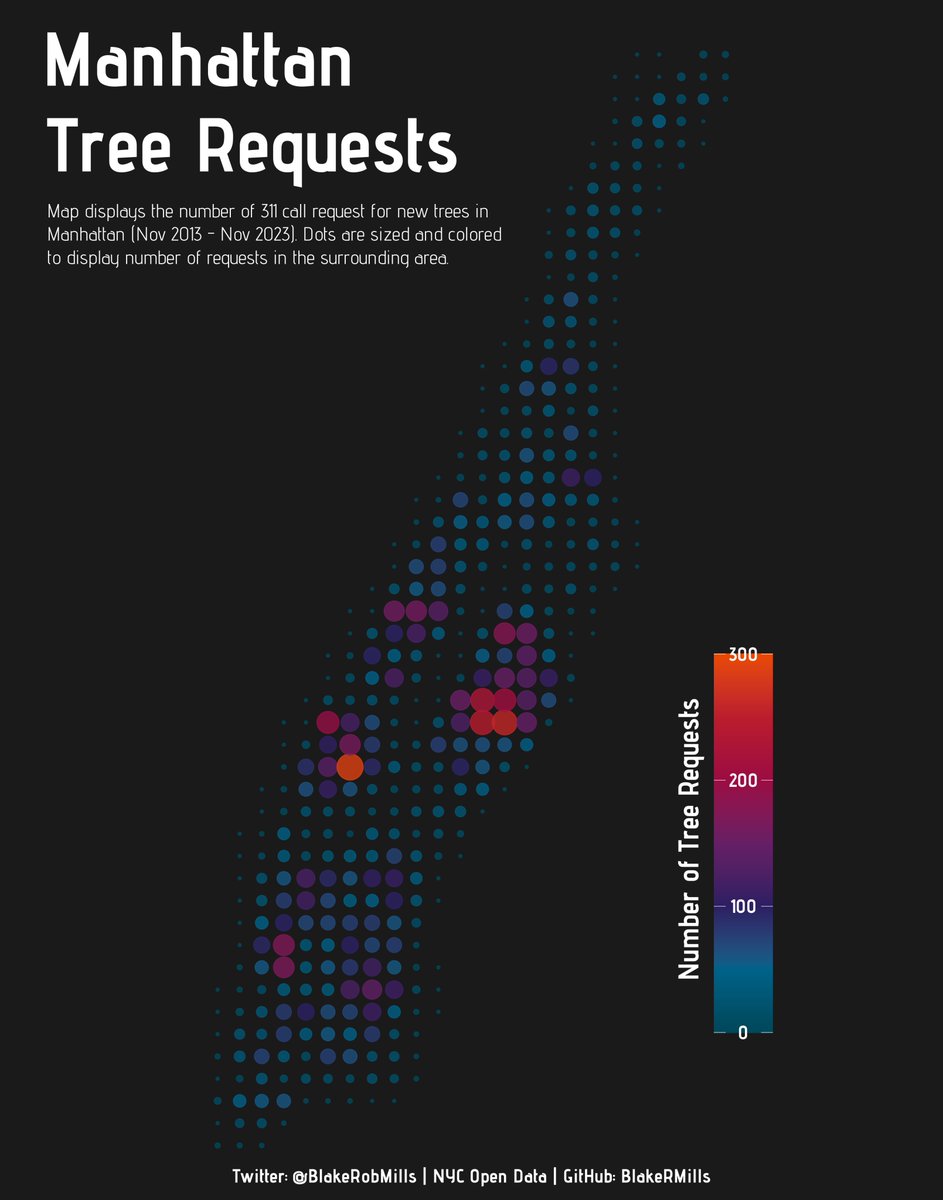
ALT Map displaying the number of 311 call requests for new trees in Manhattan.
ALT Earthquakes around Antarctica (Jan 2020 - Nov 2023)
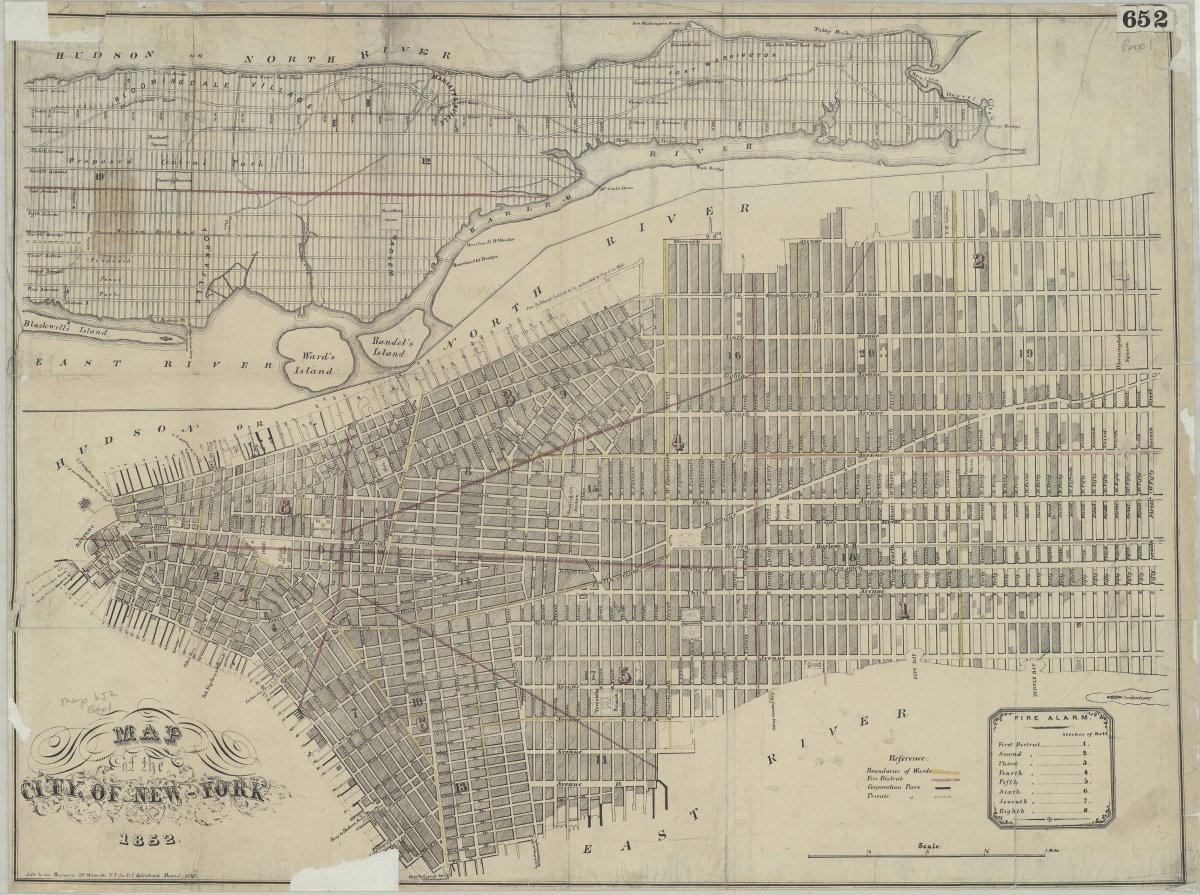
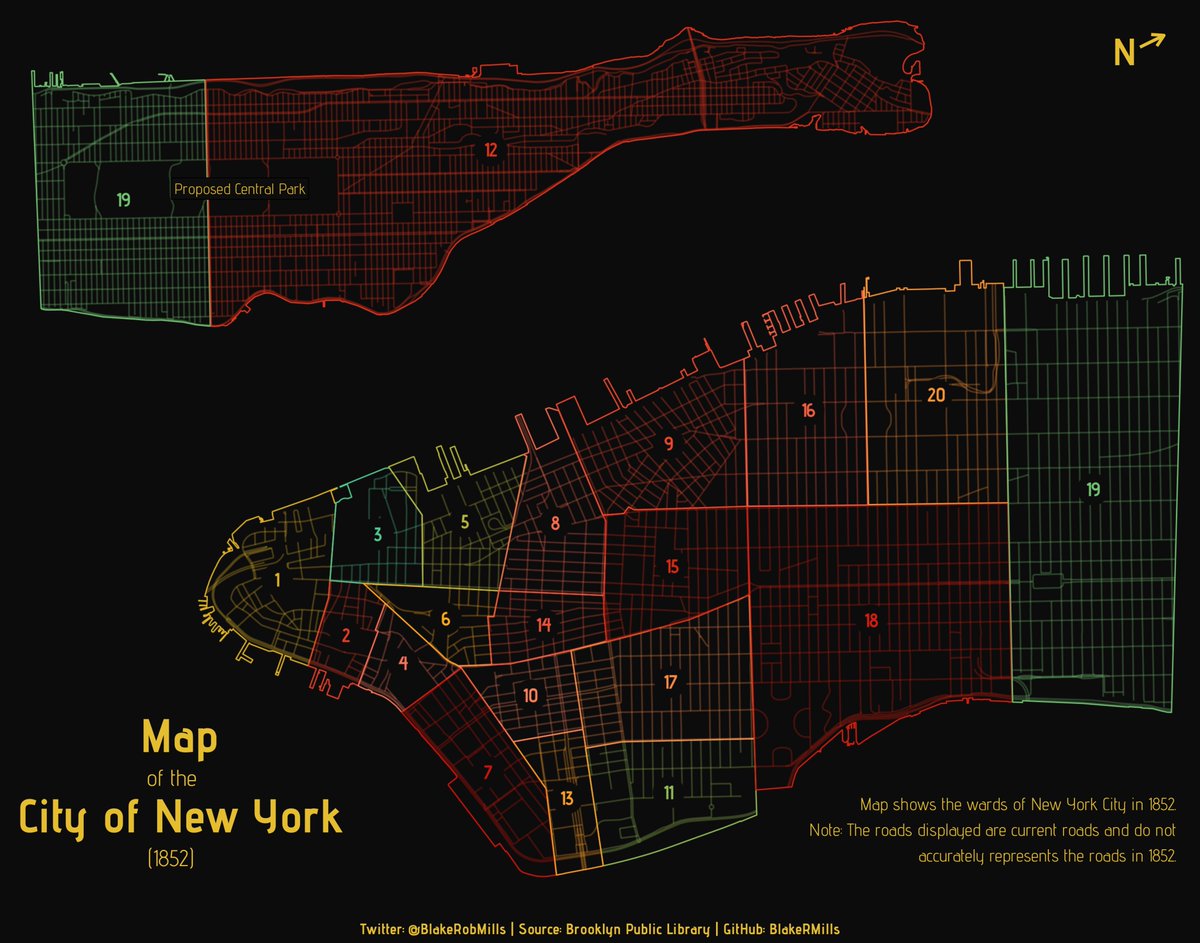
ALT Map of the wards of New York City in 1852. Source: Brooklyn Public Library

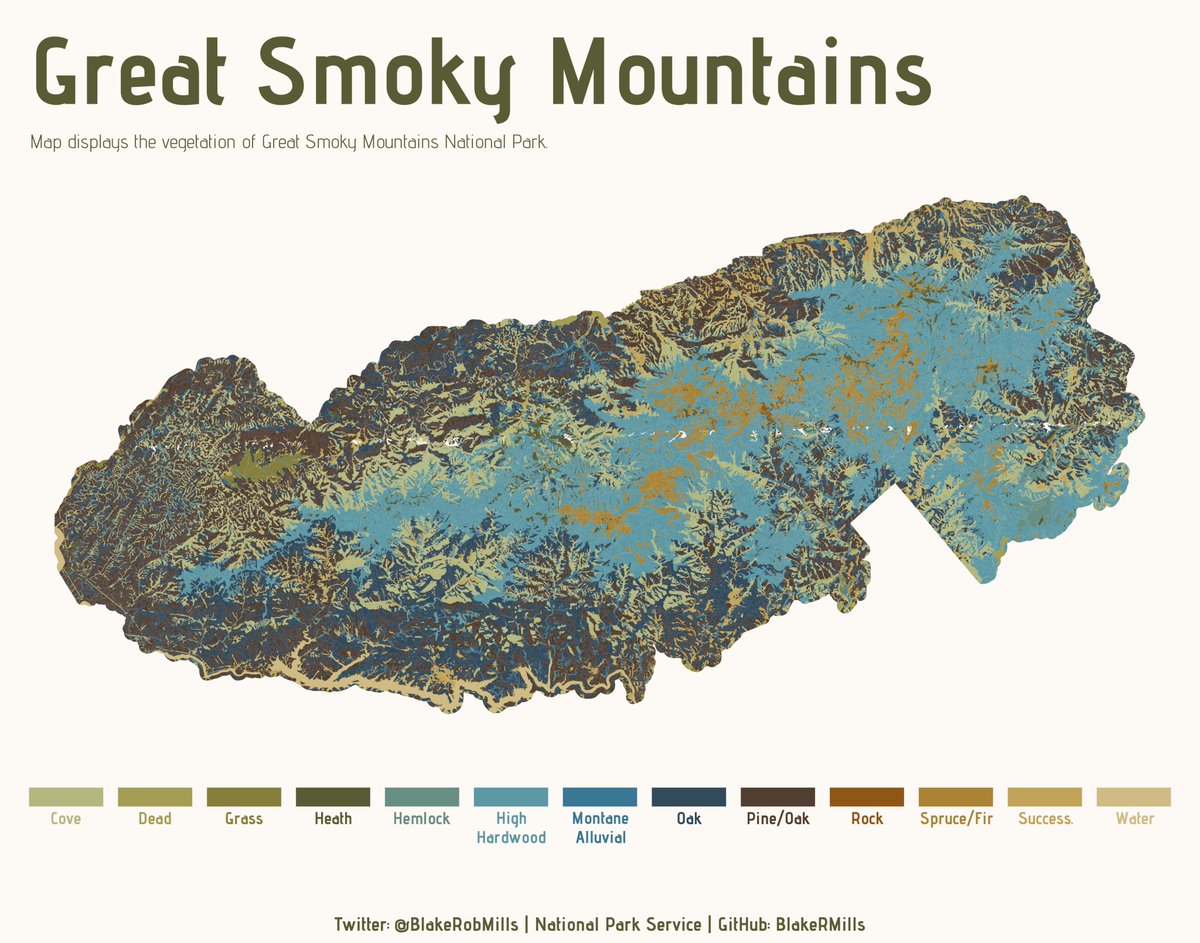
ALT Map showing the vegetation of Great Smoky Mountain National Park
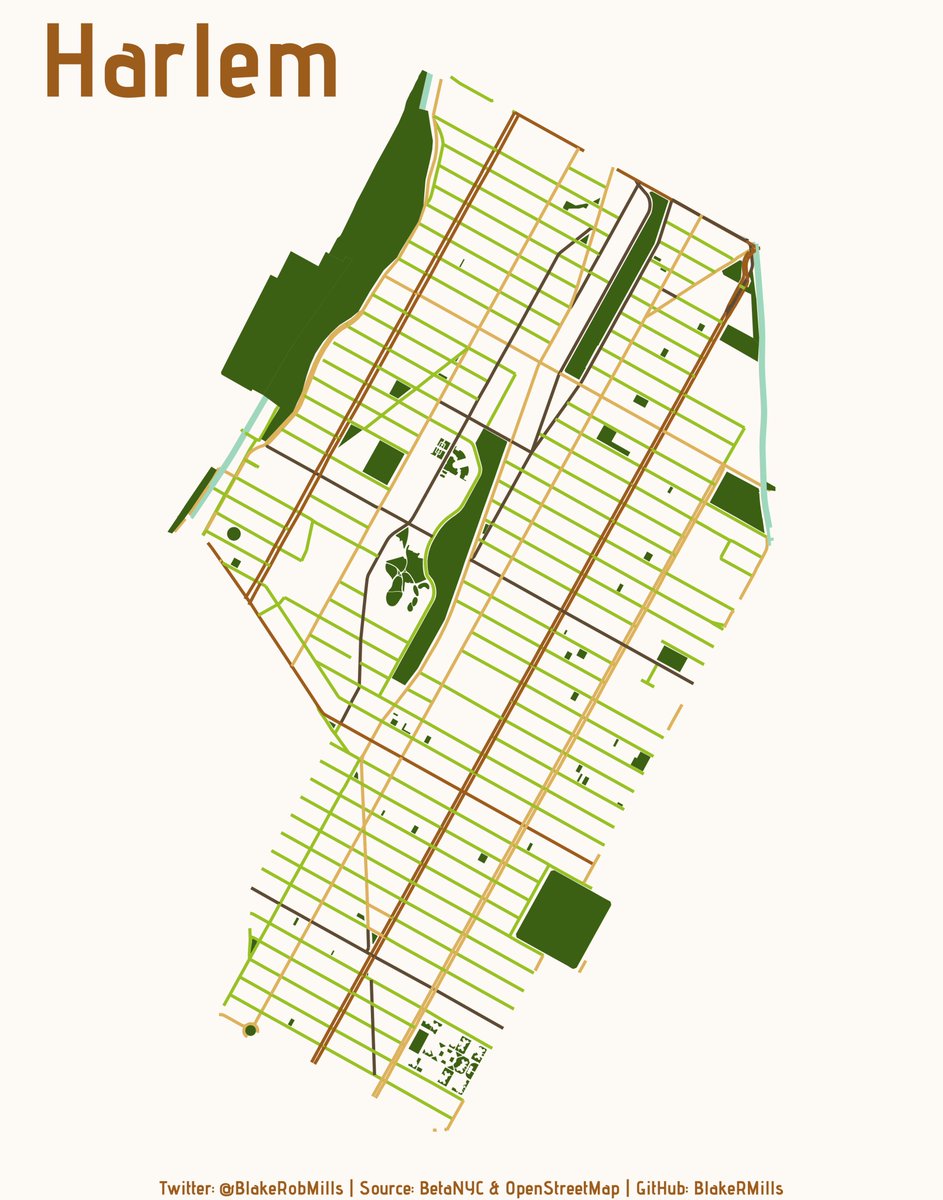
ALT Map of the Streets and Parks of Harlem
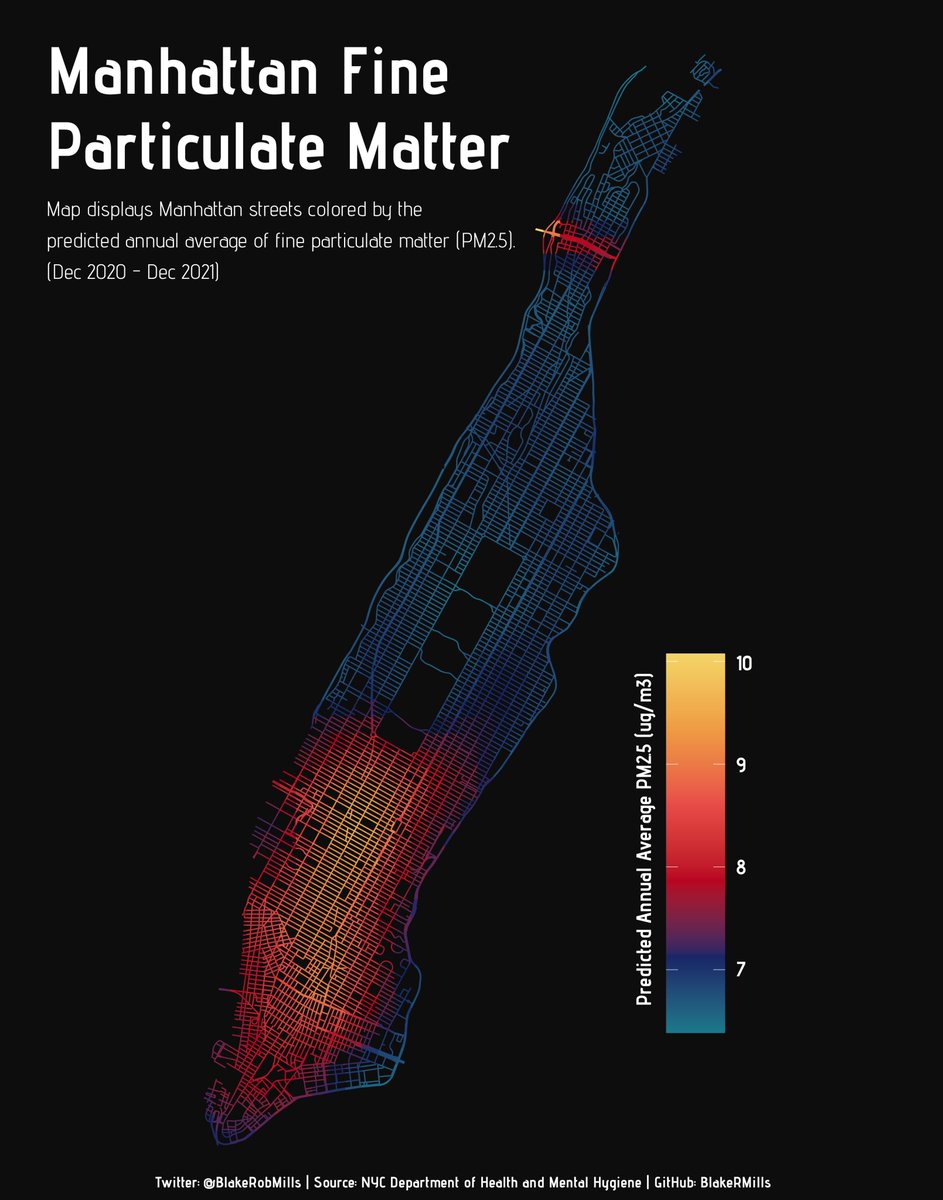
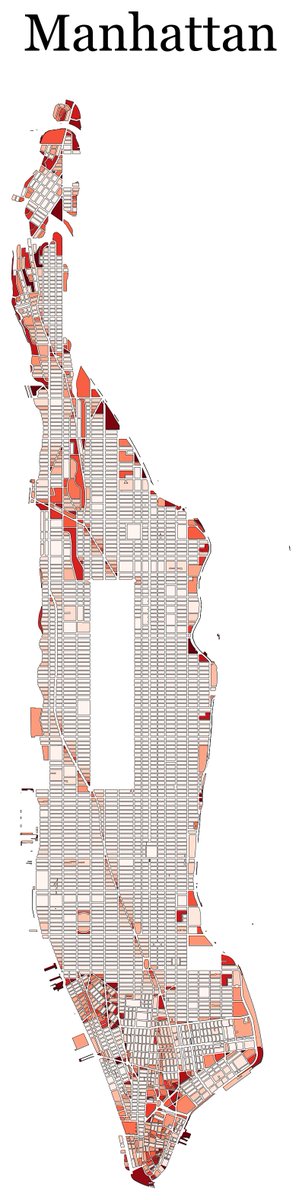
ALT Map of PM2.5 concentration in Manhattan (Dec 2020- Dec 2021)
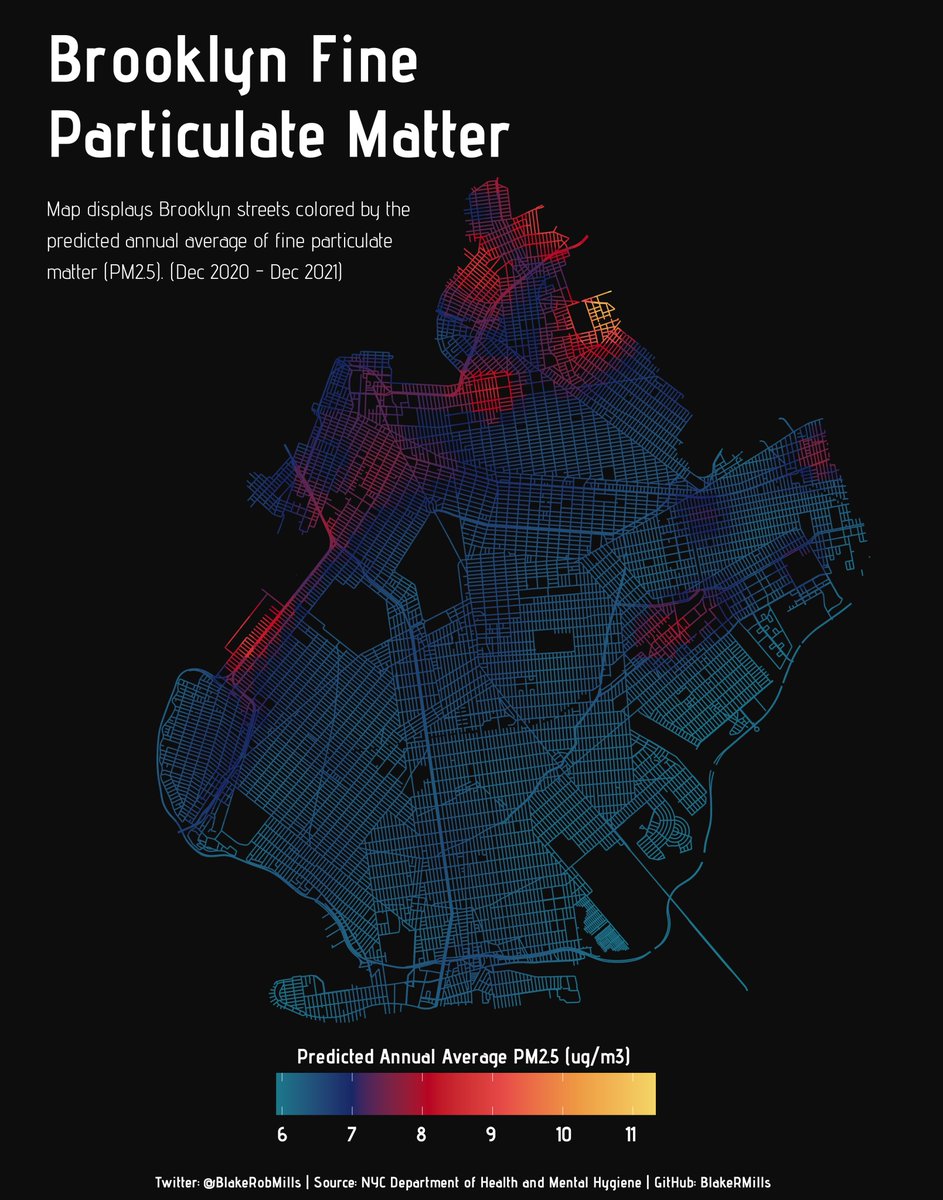
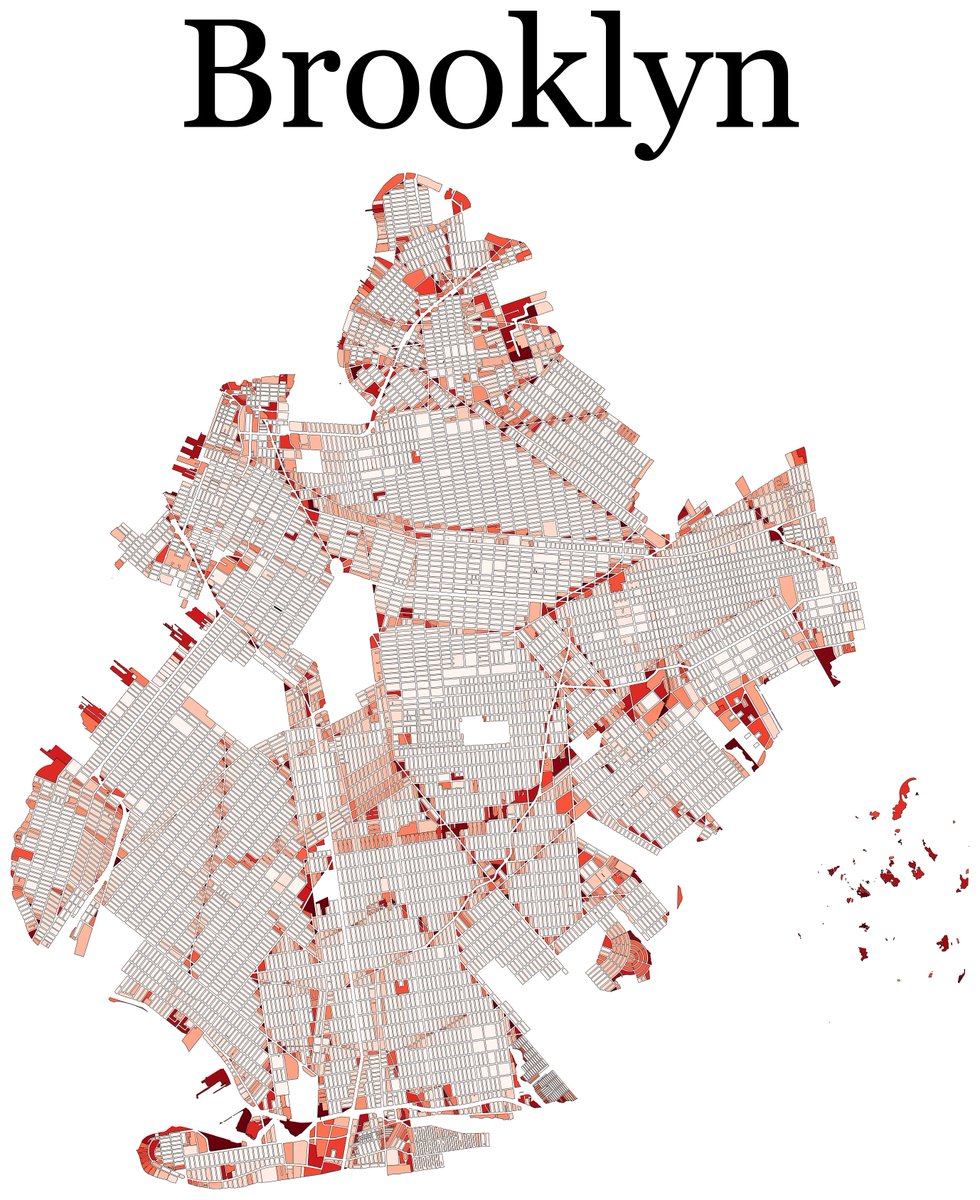
ALT Map of PM2.5 concentration in Brooklyn (Dec 2020- Dec 2021)
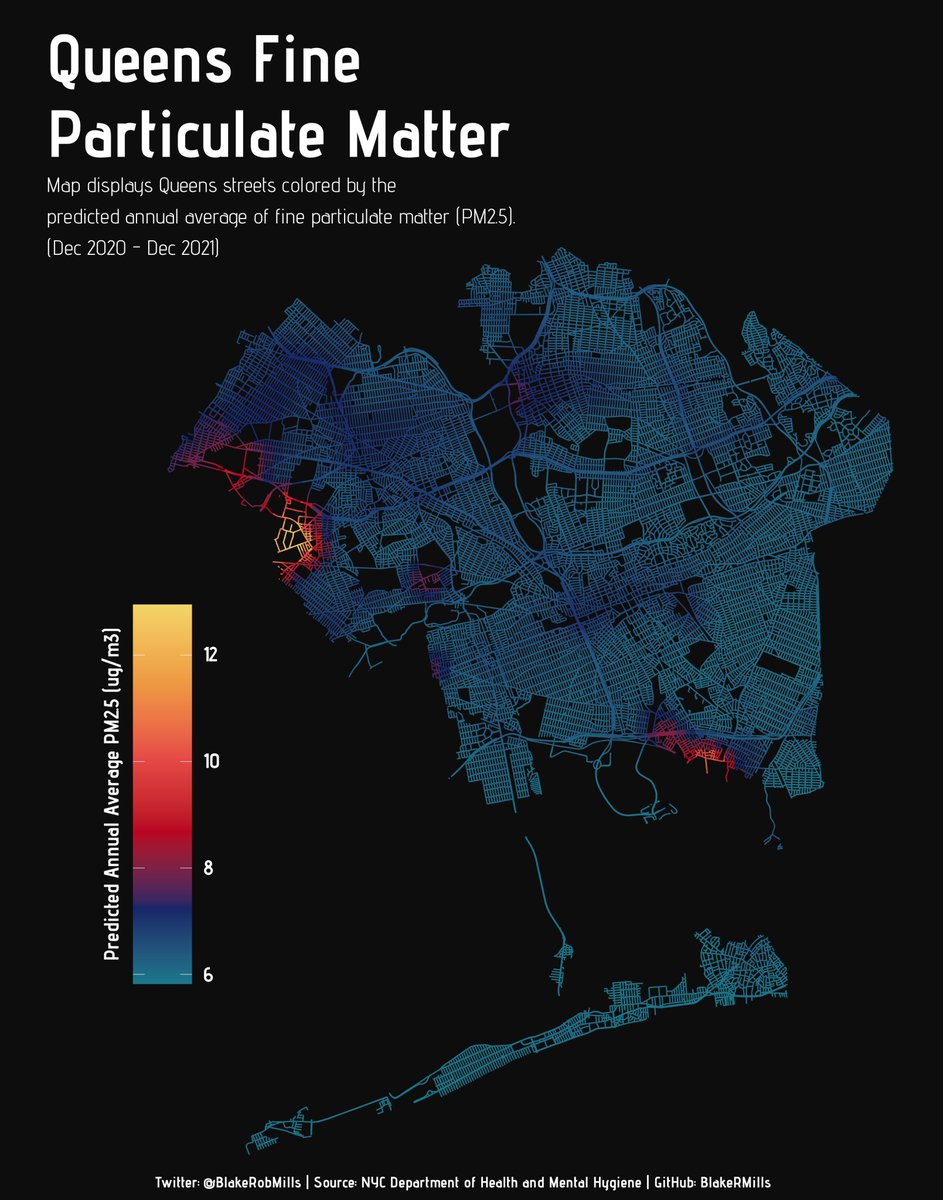
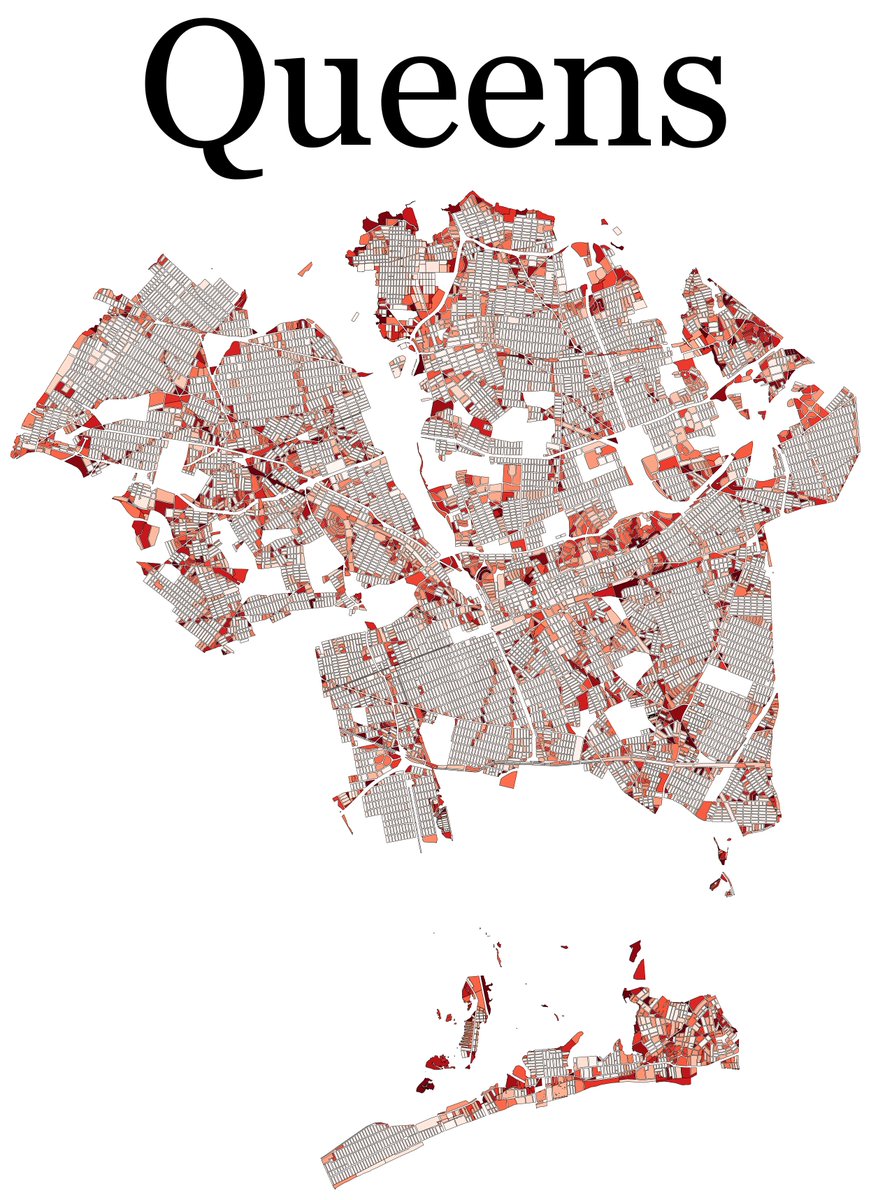
ALT Map of PM2.5 concentration in Queens (Dec 2020- Dec 2021)
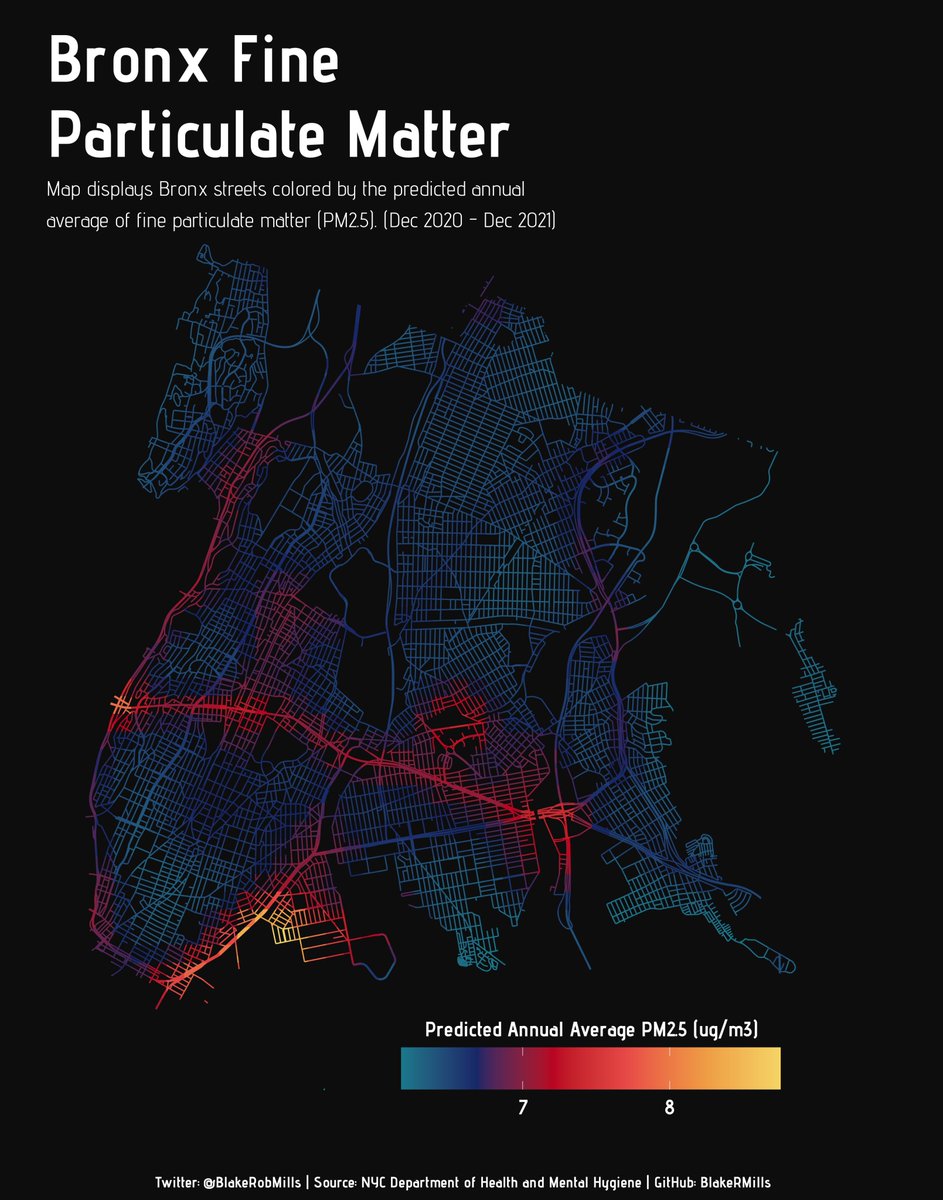
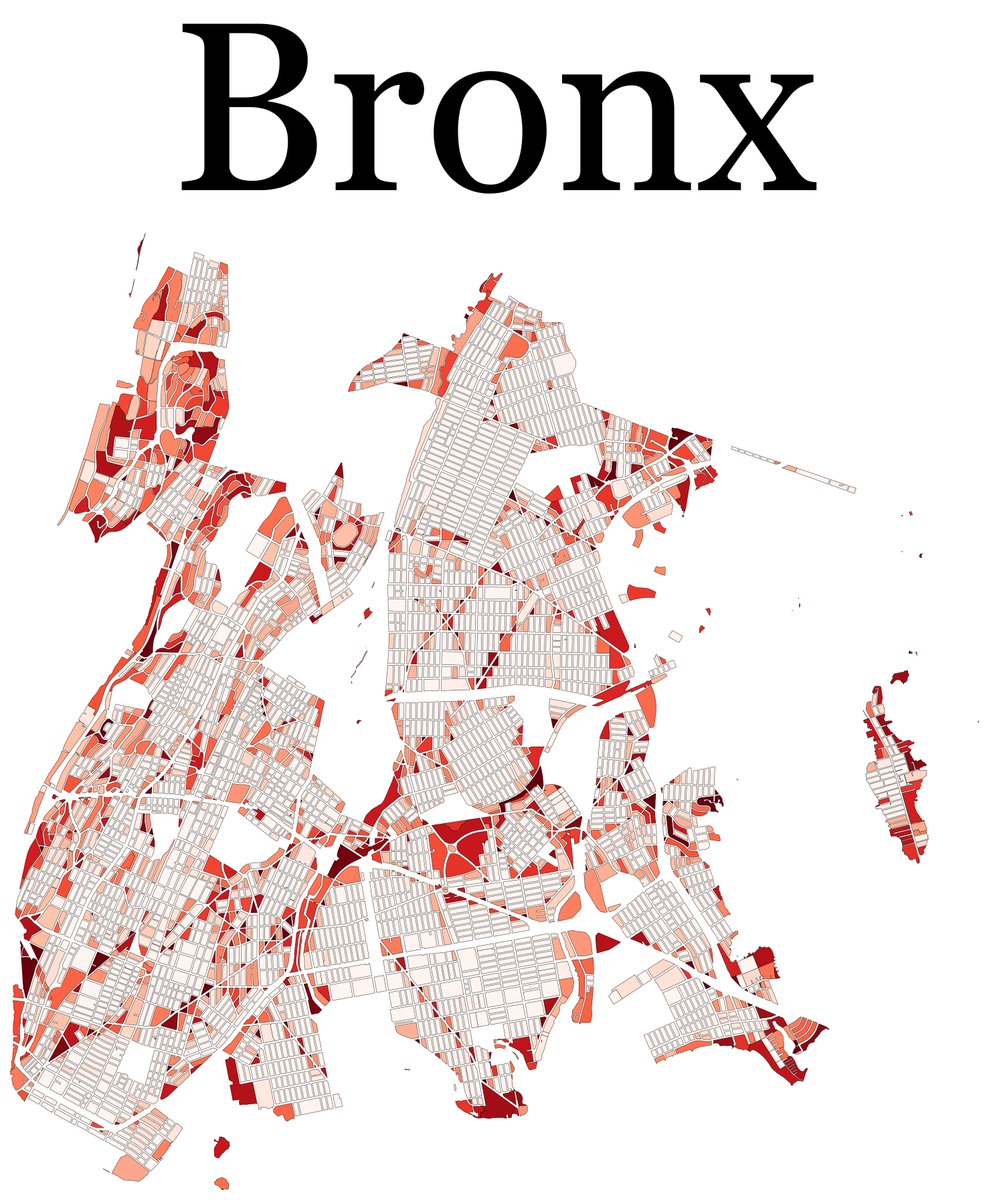
ALT Map of PM2.5 concentration in The Bronx (Dec 2020- Dec 2021)
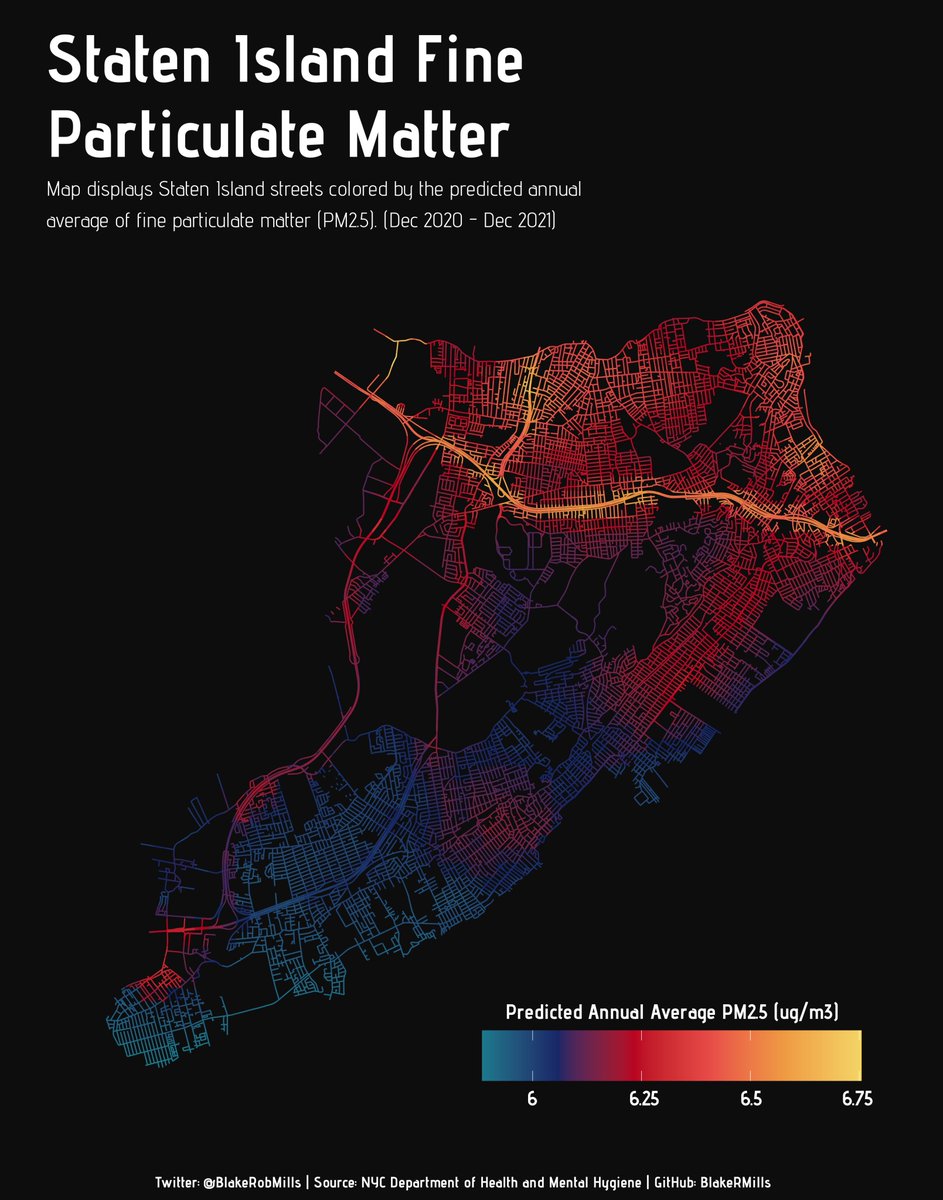
ALT Map of PM2.5 concentration in Staten Island (Dec 2020- Dec 2021)