
BloombergNEF (BNEF) is a strategic research provider covering global commodity markets & disruptive technologies driving the transition to a low-carbon economy.
Joined January 2010
- Tweets 14,105
- Following 477
- Followers 75,969
- Likes 770
4,573 Photos and videos


Jun 12
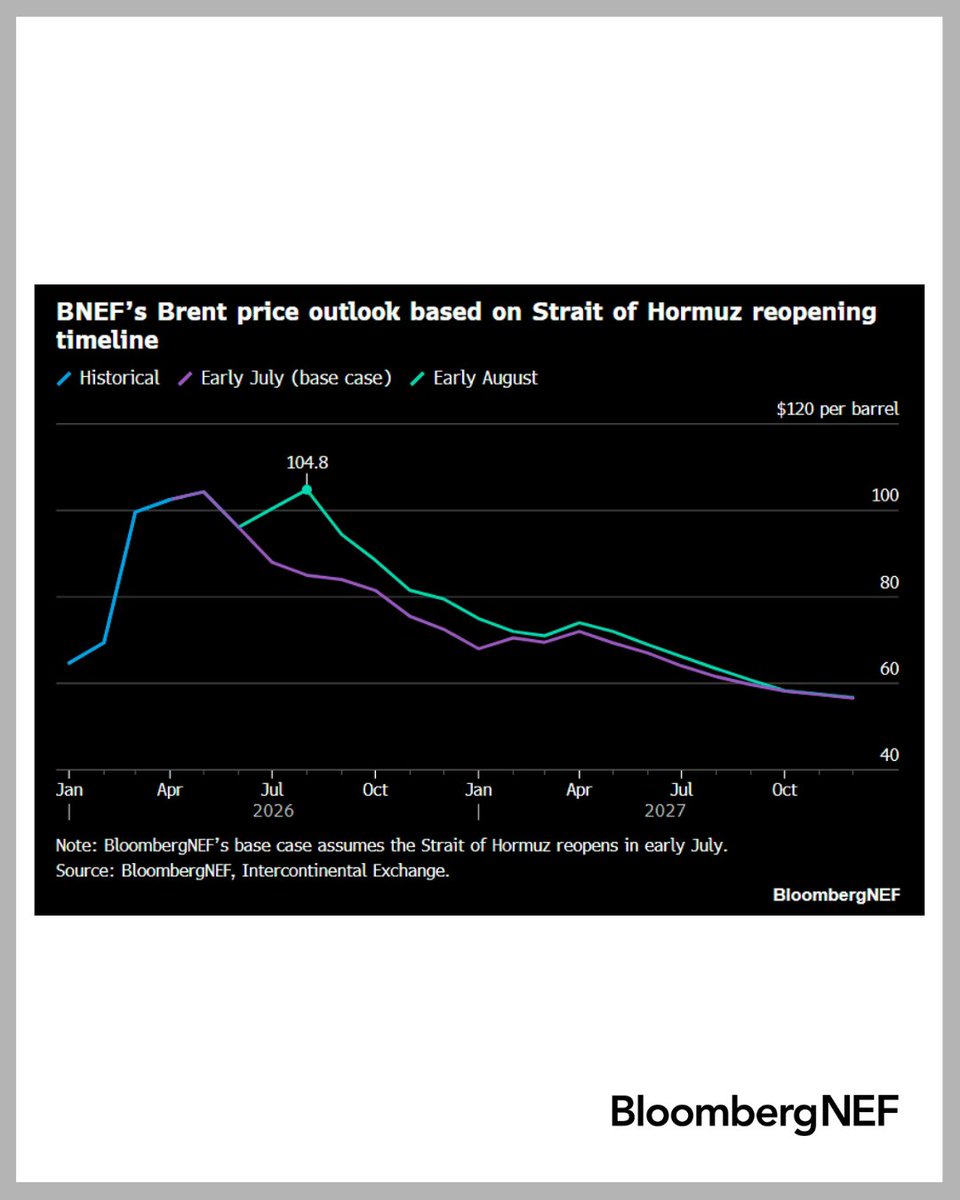
Even though the Strait of Hormuz is largely closed and inventories are being drawn down sharply, a sustained oil price rally has failed to materialize. The oil market is dealing with a temporary supply disruption on top of a structurally bearish backdrop.
The BloombergNEF modelling reflects the possibility that oil prices may have already peaked, or are close to peaking. Here are the three factors that support the bearish view:
⚡ Demand: Oil demand is increasingly fragile, and the slowdown appears more structural than cyclical. Efficiency gains continue to reduce fuel intensity. Electric vehicles are taking a bigger bite out of gasoline demand.
📊 China inventories: China has sharply trimmed its crude imports, reflecting both softening domestic demand and opportunistic stockpiling over the past several years, when sentiment and prices were low. Today, those stockpiles work in the other direction, limiting the scope of the price rally beyond $120 per barrel.
🛢️ Production: While demand softens, supply keeps expanding. Supply growth outside OPEC remains robust, especially in the Americas. As Middle East barrels come back on top of rapidly growing supply elsewhere, the market could swing from a deficit this year into a sizable surplus next year.
Read more here: bloom.bg/4vM0Dj3
6
3
7
995
Jun 9
That's a wrap on #BNEFSummit Amsterdam 2026! ✅
Big thanks to our speakers, attendees and Sponsors.🤝
⬇️ ⬇️ ⬇️
🔷 Partner:
@SolaXPower
🔷 Sponsor:
@MHI_Group
✨ Relive the Highlights of the BNEF Summit New York!✨
🎥 bloom.bg/4urCSf9
📸 bloom.bg/4ak5waF
3
6
3
971
May 20
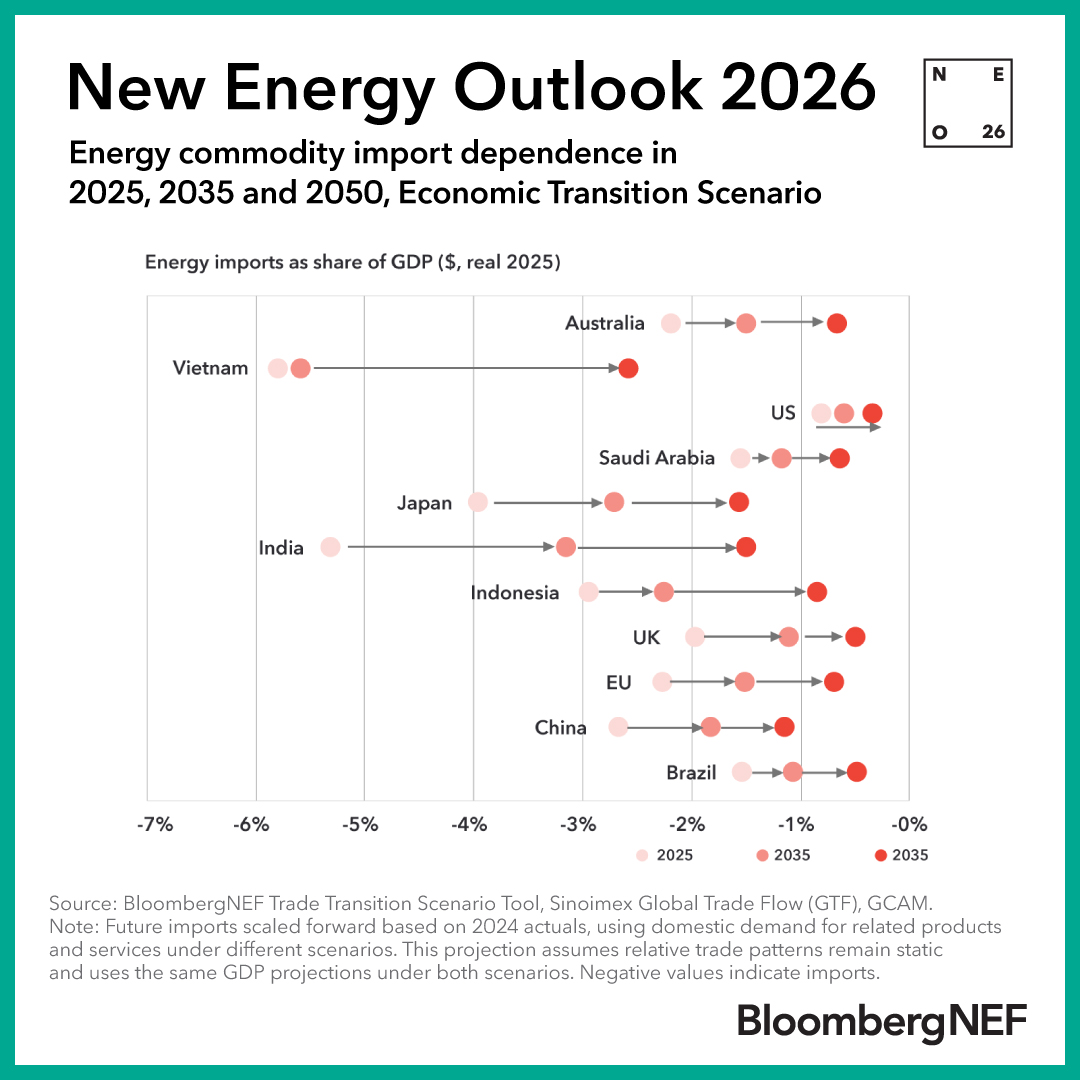
🚨 BloombergNEF’s annual flagship report, New Energy Outlook 2026, is now live.
Energy security is top of the global agenda after successive energy market shocks. This year’s outlook finds that countries continuing to deploy economically competitive clean technologies can reduce their reliance on imported fossil fuels and strengthen energy security.
📈 This chart shows how energy commodity import dependence evolves across major markets through 2050 under BNEF’s Economic Transition Scenario, which maps how the energy system is most likely to evolve over the next decade and through 2050.
Asian economies with high import liabilities, including Vietnam, Japan, Indonesia and India, have some of the most to gain.
Download the Executive Summary and Public Benchmark Dataset: bloom.bg/3PBYnLR
14
13
34
5,169
May 19
🚨 BloombergNEF’s annual flagship report, New Energy Outlook 2026, is now live.
Energy security is top of the global agenda after successive energy market shocks. This year’s outlook finds that countries continuing to deploy economically competitive clean technologies can reduce their reliance on imported fossil fuels and strengthen energy security.
📈 This chart shows how energy commodity import dependence evolves across major markets through 2050 under BNEF’s Economic Transition Scenario, which maps how the energy system is most likely to evolve over the next decade and through 2050.
Asian economies with high import liabilities, including Vietnam, Japan, Indonesia and India, have some of the most to gain.
Download the Executive Summary and Public Benchmark Dataset: bloom.bg/4wKBxCC
1
6
15
1,630
May 8
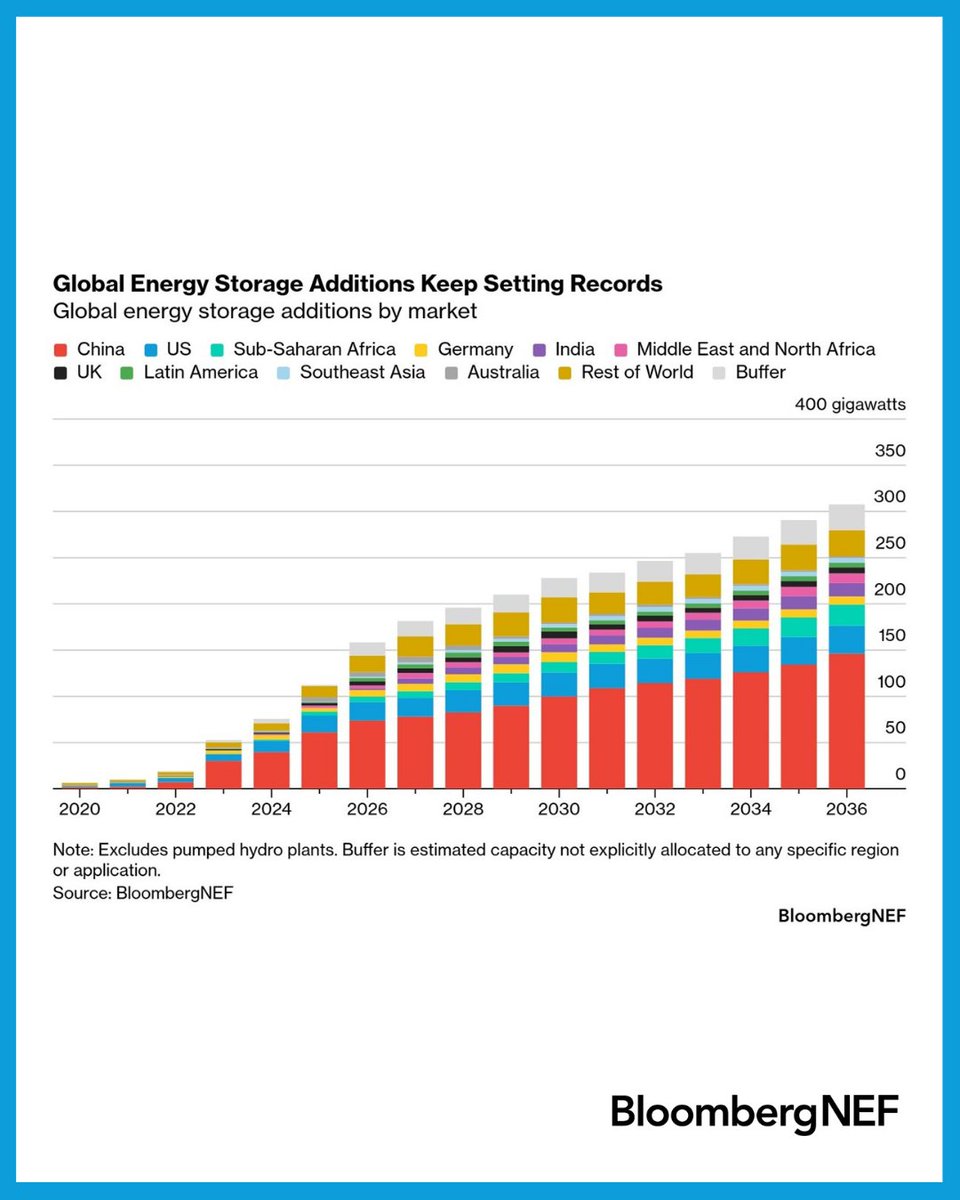
Energy storage has crossed a major threshold: annual additions exceeded 100GW for the first time in 2025. 🔋
In BloombergNEF’s latest Energy Storage Market Outlook, global deployment reached 112GW in 2025, excluding pumped hydro, up 48% from 2024, with 307GWh of batteries added worldwide.
Here are three things to know from the research:
• Energy storage surge far outpaces wind and solar growth: Annual additions of energy storage, excluding pumped hydro, reached 112GW in 2025 – up 48% from 2024. It only took four years for energy storage to increase annual additions to more than 100GW from 10GW, compared with roughly eight years for solar and 15 years for wind.
• The Iran war has yet to reach energy storage: The direct impact on energy storage markets has been limited to date, primarily due to China’s dominance in battery supply chains. Soaring fossil fuel prices could influence revenues, retail electricity prices and project costs, with impacts likely to be highly regional.
• Non-lithium chemistries gain traction: Lithium-ion batteries, especially lithium iron phosphate, accounted for more than 90% of annual additions in 2025. In 2026, long-duration energy storage is set to quadruple to 2GW, with most capacity coming from non-lithium-ion technologies. BloombergNEF also expects sodium-ion batteries to start gaining share in the stationary storage space.
Read more: bloom.bg/3P6PoCc
11
34
66
15,544
Apr 22
Day 1 of the #BNEFsummit in New York focused on how energy security, AI-driven demand and infrastructure bottlenecks are reshaping the next phase of the energy system.
⚡ Energy Transition & Investment
Global energy transition investment rose 8% last year to $2.3 trillion, while US investment increased 3% to $378 billion. Even amid policy disruption, the US still deployed about 70GW of wind, solar and storage last year — a record.
🤖 AI, Data Centers & “Speed-to-Power”
US data center power demand is projected to rise from about 40GW today to above 100GW by 2035. The challenge is no longer whether load growth is coming — it is how quickly grids, generation and interconnection can keep up.
🔋 Storage, Gas & Grid Buildout
A recurring theme across discussions was that flexibility helps, but it is not enough on its own. Solar, storage and gas are all being pulled into the race to meet large-load demand, while global grid investment needs to reach $600 billion per year by 2027.
🚗 Electrification & Competitive Pressure
The US continues to set EV sales records, but has fallen behind China and several Asian markets on adoption. At the same time, the economics of clean power remain broadly competitive even as subsidies are removed.
🏗 The Real Constraint: Execution
Across panels, capital availability was not the main concern. The bigger barriers were permitting, transmission, large-load interconnection, equipment lead times and skilled labor — all now central to whether new infrastructure can be delivered at speed.
🎥 Watch the Live Stream 👉 bloom.bg/4u2xYoP


2
1
9
2,238
Apr 16
Clean power use is rising and will emerge stronger from the Iran war as surging prices of gas and oil and disrupted fossil fuel supplies impose severe strain on economies.
The world could double down on low-carbon energy, according to one view. Batteries, or storage, will be a big part of the shift. So will corporations, which are increasing renewable energy consumption. Power-thirsty hyperscalers for the first time made up about half of the green power purchases last year.
Here are three things to watch:
1️⃣Solar-plus-storage gains appeal in Saudi Arabia, a fossil fuel powerhouse
2️⃣Hyperscalers are buying ever more clean energy
3️⃣Power supply from Australia’s batteries up
Read more → bloom.bg/4cMaNcE
3
10
1,885
Mar 24
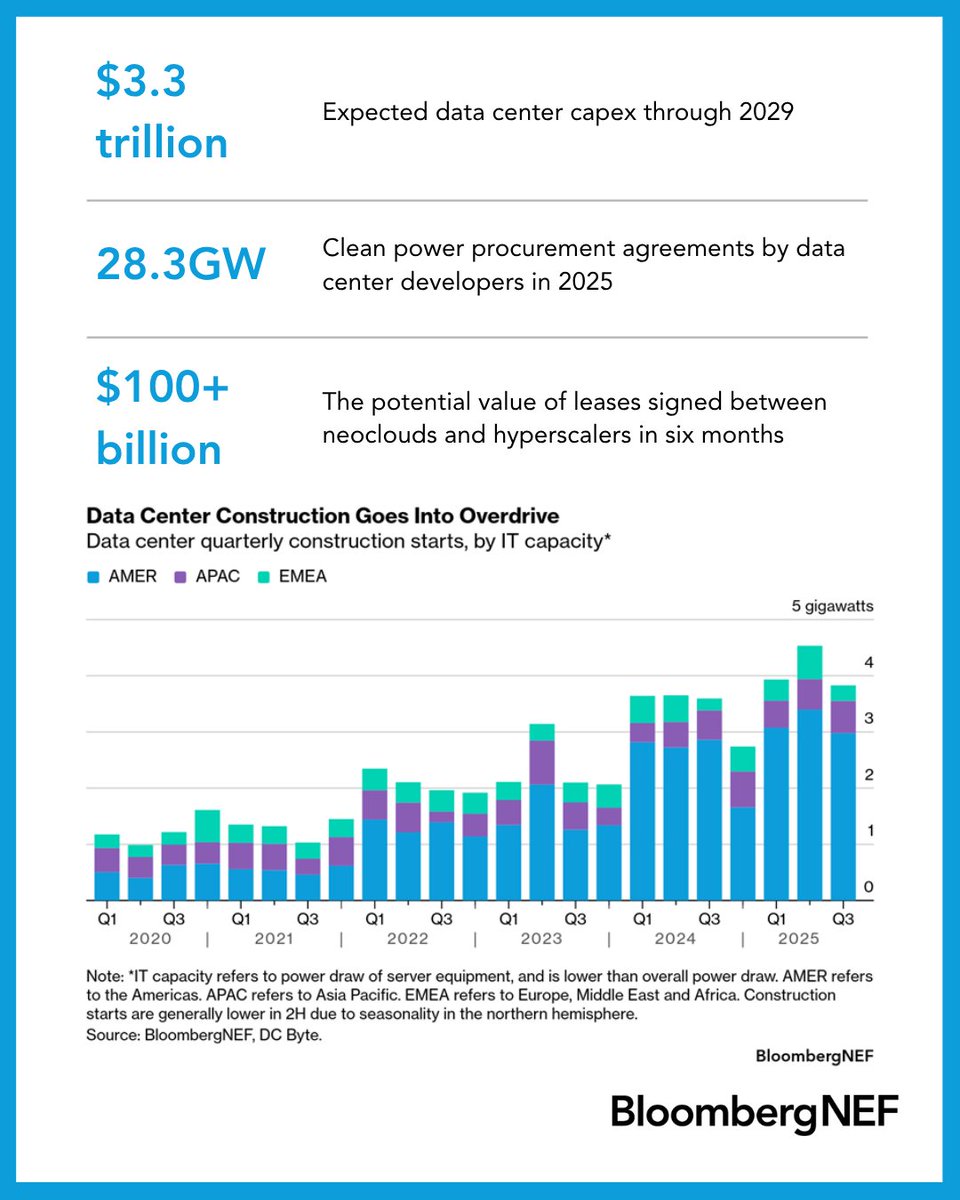
Despite equity market jitters and “bubble” fears, the digital infrastructure boom continues. The latest iteration of BloombergNEF’s Data Center Market Indicators combines capital, capacity and power trends to help answer the question: how much of this demand is real? 🌐
1️⃣ Capex is nearing $750 billion in 2026, up from less than $450 billion the prior year
2️⃣ 23.1GW of IT capacity is under construction across 831 sites globally, with about three quarters in the US
3️⃣ Data centers signed 28.3GW of clean power PPAs in 2025, accounting for about half of corporate procurement
4️⃣ Hyperscaler–neocloud leasing activity exceeded $100 billion in six months
5️⃣ Leading AI labs are reporting 30–40% gross margins on inference services
Download the full report here → bloom.bg/4c3XNyM
#DataCenters #AI #PowerMarkets #DigitalInfrastructure #CleanPower
1
3
7
1,727
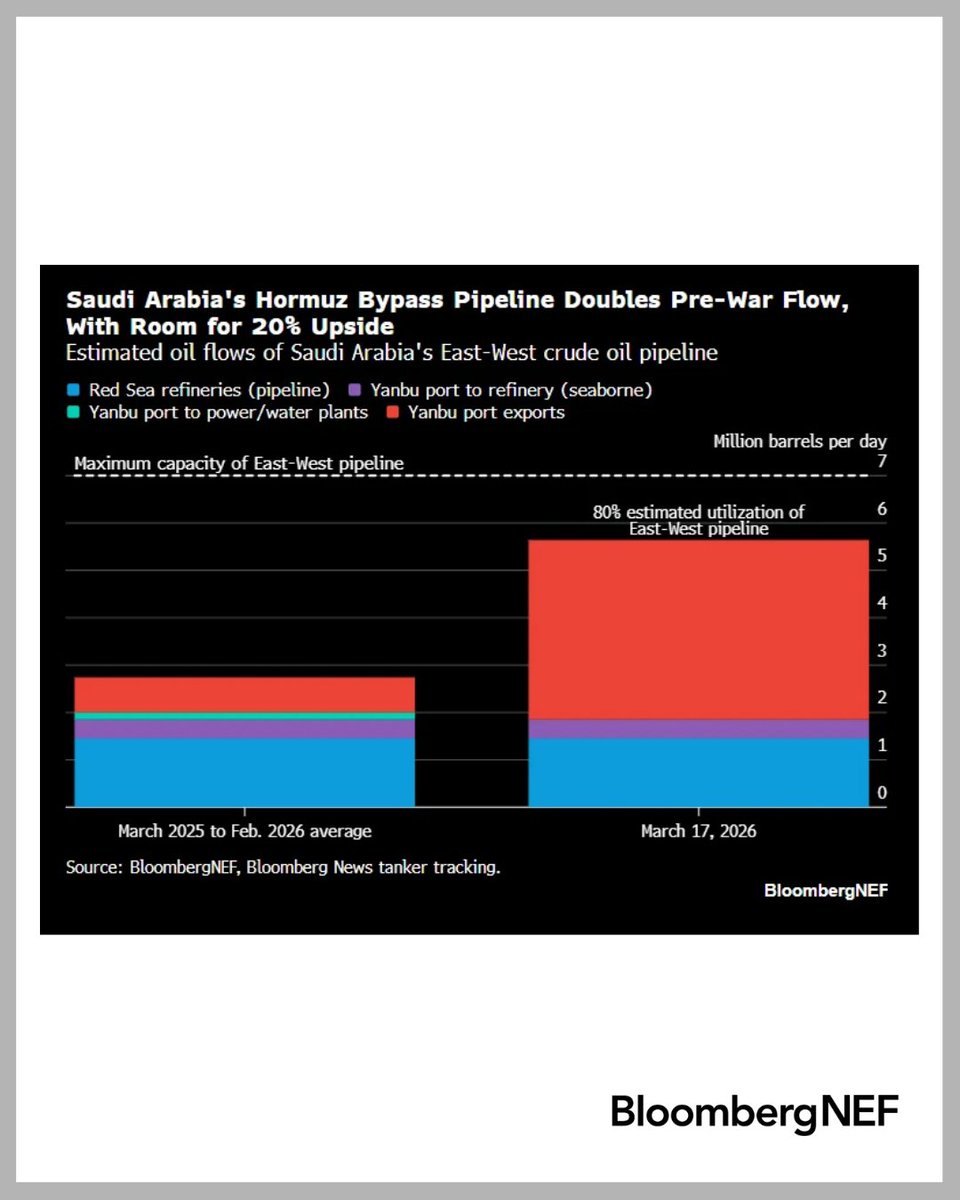
Mar 23
Iran-linked strikes briefly halted crude loadings at Saudi Arabia’s Yanbu oil terminal last week, highlighting the vulnerability of Red Sea export routes.
BloombergNEF analysis shows the risks extend beyond a single disruption:
▪️Shipments had climbed to ~4.2 million barrels per day by March 18 before being halted
▪️It is not clear the Kingdom can fully sustain exports via the Red Sea, despite East-West pipeline capacity of up to 7 million barrels per day
▪️Tanker operators may be unwilling to accept the risk of further strikes
Even with alternative routes, flows cannot fully replace volumes through the Strait of Hormuz.
Explore the analysis ➡️ bloom.bg/4uL8QEn
1
6
2,517
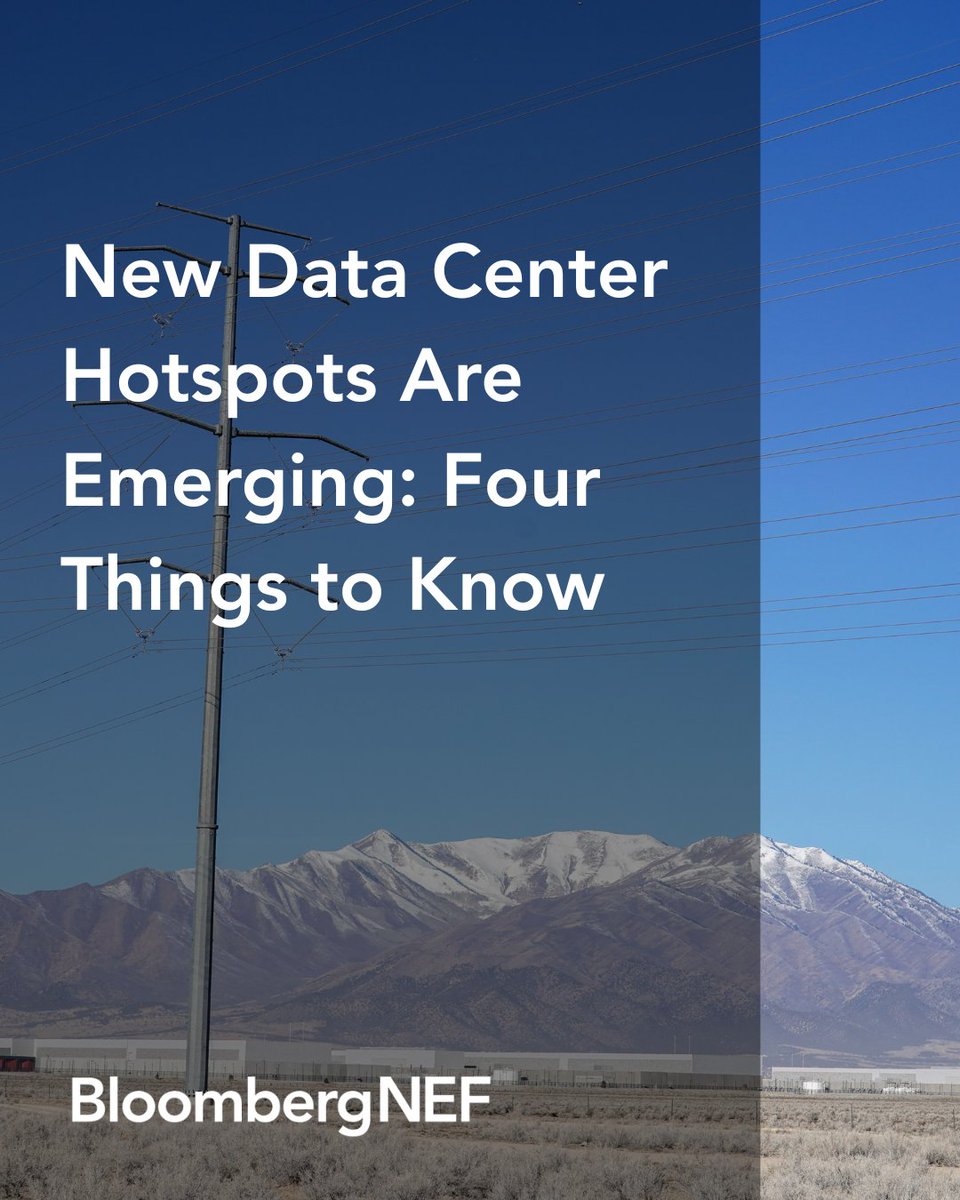
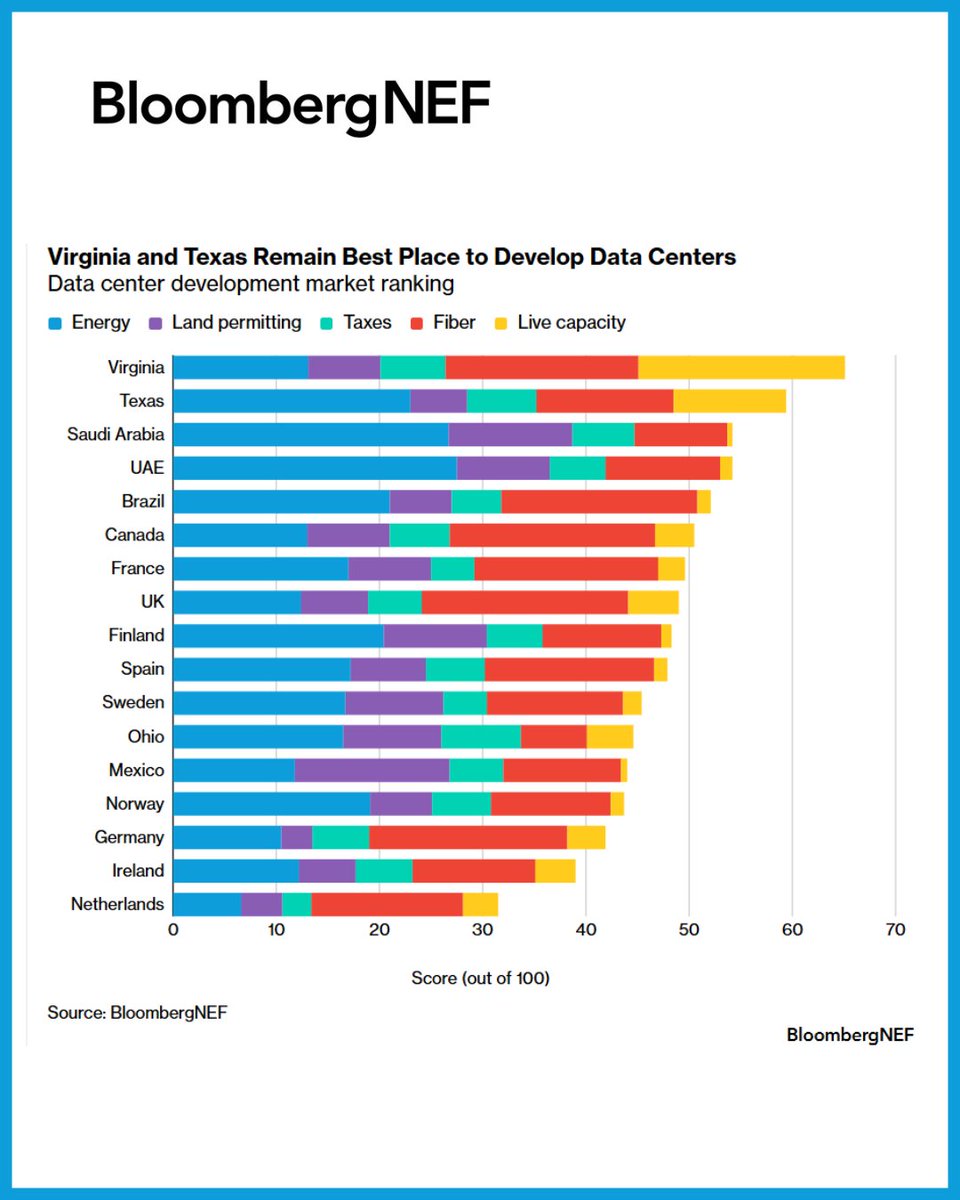
Mar 16
The geography of data center development is being redrawn at speed. ⚡🌍
BloombergNEF is tracking nearly 23GW of IT capacity under construction globally, as AI and cloud workloads drive the next phase of digital infrastructure growth. But energy availability, permitting and grid constraints are reshaping where capacity lands. Tax policy, fiber connectivity and existing ecosystems continue to influence competitiveness.
Our experts outline four key themes in the article, and the companion podcast explores what really determines where the next gigawatt gets built.
📖 Read:
bloom.bg/3P67LGV
5
14
32
3,354
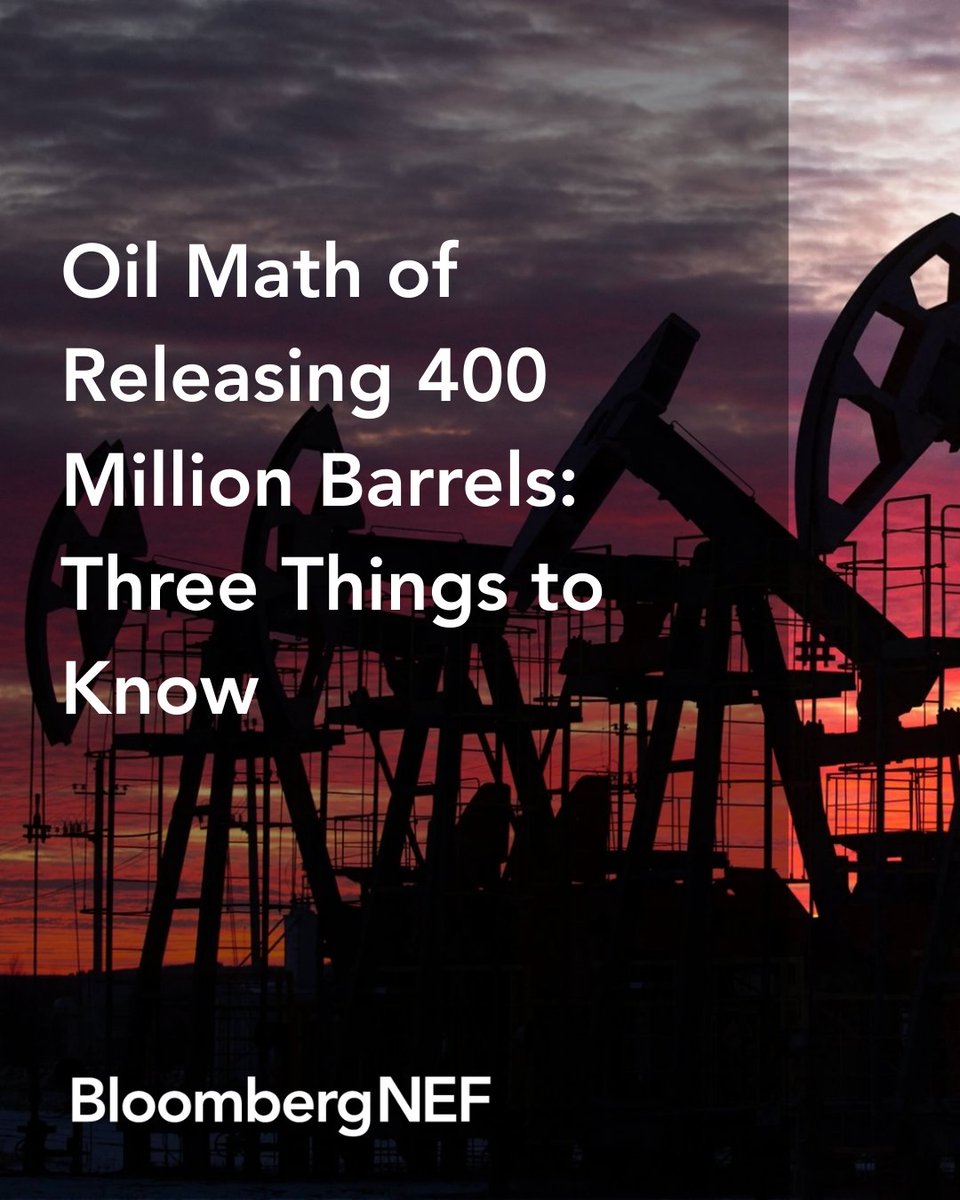
Mar 13
The International Energy Agency (IEA) has announced a record 400 million-barrel release from emergency oil reserves to help ease market turmoil caused by the Iran war.
But that quantity will only cover about four days of global demand. 🛢️📉
“It is a relief for the oil market, but apparently not enough to stem overall supply concerns,” said David Doherty, BloombergNEF's Head of Natural Resources Research, citing days of whipsawing oil prices following the IEA release. “We see structural oversupply re-anchoring prices if the supply shock is temporary.”
Here are three things to know from BNEF’s analysis:
📊 Oil balance: There was near consensus among key agencies on 2026 being a year of surplus oil production. That may change.
🛳️ Production cuts: Disruption of oil flows through the Strait of Hormuz has led Saudi Arabia and others to start reducing oil production.
🔁 Supply support: The IEA’s decision to release 400 million barrels is more than double the 183 million barrels unlocked after Russia invaded Ukraine.
Read more here: bloom.bg/4lpjP1X
3
8
1,650
Mar 13
That's a wrap on #BNEFSummit Beijing 2026!✅
Big thanks to our speakers, attendees and Sponsors.🤝
⬇️ ⬇️ ⬇️
🔷 Sponsor:
🔸@Castrol
✨Relive the Highlights of the BNEF Summit Beijing!✨
🎥 bloom.bg/4sFCgSz
📸 bloom.bg/3PjRIW1
1
5
1,043
Mar 12
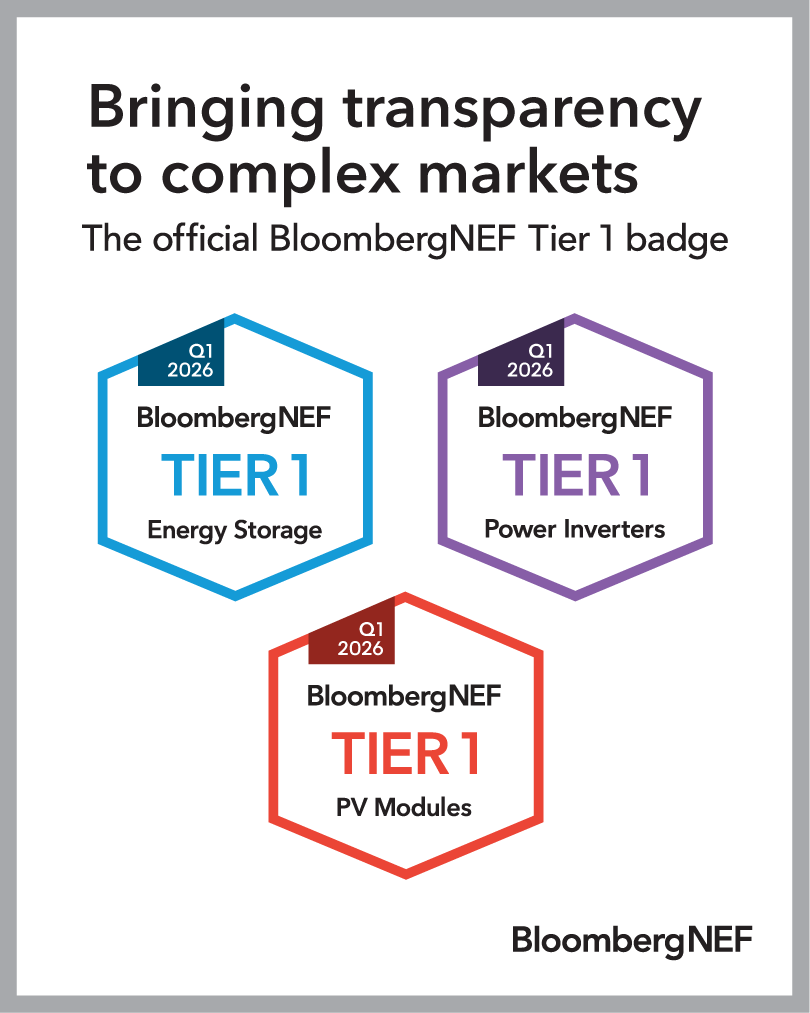
Bringing Transparency to Complex Markets: The Official BloombergNEF Tier 1 Badge.
We are pleased to announce the launch of the BloombergNEF Tier 1 badge, introduced today at the BNEF Summit Beijing.
Built on over 20 years of experience assessing companies and their role in the energy transition, BloombergNEF’s Tier 1 reports identify leading manufacturers and suppliers of PV Modules, Power Inverters, and Energy Storage Systems. Drawing on a proprietary database of 200,000 individual projects and asset finance transactions, our classification system uses data-driven, objective criteria to separate the top tier of companies from the many other players in their respective fields.
Alongside this launch, Tier 1 lists are published quarterly to align with industry workflows.
Explore our new dedicated website to learn more about the BloombergNEF Tier 1 classification and our methodologies: bloom.bg/4b5HxNr
Join us in celebrating this next step in advancing industry transparency and helping the world’s leading energy players stand out.
#BNEF #BNEFTier1 #CleanEnergy #SolarPV #EnergyStorage #Renewables #BNEFSummit #Tier1 #EnergyFinance
1
5
1,193
Mar 11
The #BNEFSummit Beijing 2026 is right around the corner! 📢
We are delighted to announce the participation of the following distinguished speakers:
🔸Jianjun Cao, Chief Expert, SINOPEC Economics & Development Research Institute Co., Ltd.
🔸Jiaquan Dai, Chief Economist, CNPC Economics & Technology Research Institute (CNPC ETRI)
🔸Shengwei Guo, Vice President, CNOOC Energy Economics Institute
🔸Peter Huang, Global President of Thermal Management & Data Centre, Castrol
🔸Hao Jiang, Assistant Director General / Chief Technical Expert, China Renewable Energy Engineering Institute (CREEI)
We're looking forward to welcoming our Sponsor 🤝
⬇ ⬇ ⬇
🔷 @Castrol
📍 Beijing
📅 12 March 2026
🔗 Learn more: bloom.bg/4umTfe4
1
5
1,040
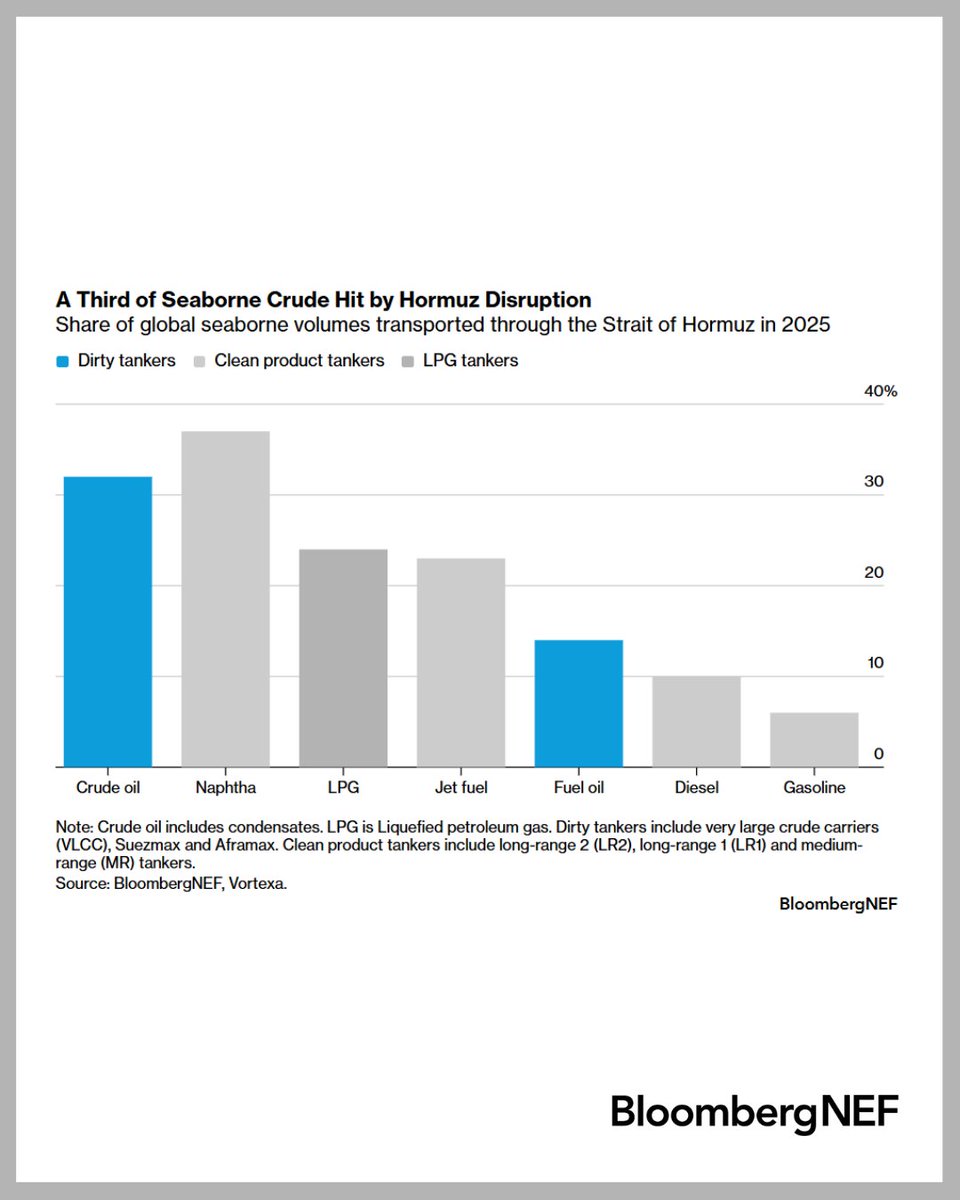
Mar 2
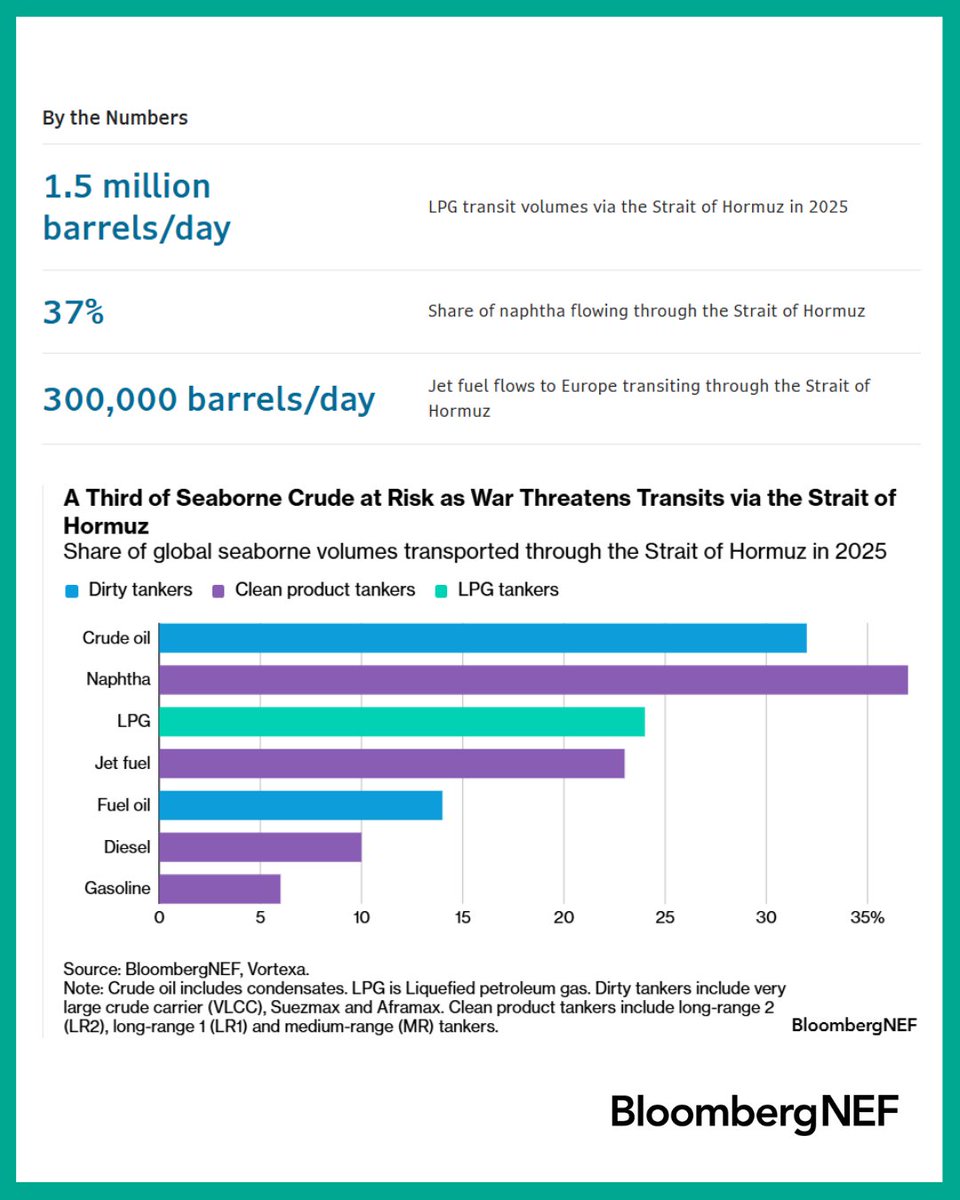
Escalating conflict involving Iran is threatening flows through the Strait of Hormuz, a corridor for 13.7 million b/d of crude, representing 32% of global seaborne trade, and 20% of global LNG supply.
A disruption would impact 16% of global seaborne oil products trade, including:
• 24% of global LPG 🔥
• Over 37% of global seaborne naphtha 🏭
• More than half of Europe’s jet fuel imports ✈
• Over 10% of global seaborne diesel 🌏
Read more about the risks to crude, LNG and oil products flows through the Strait of Hormuz in BloombergNEF’s latest analysis: bloom.bg/4r7EjO3
2
6
12
1,861
Feb 20
Corporate clean energy buying fell in 2025, ending nearly a decade of growth.
BloombergNEF’s Corporate Energy Market Outlook shows power purchase agreement volumes declined year-on-year, reversing a sustained expansion in voluntary procurement. Big Tech companies remained key buyers, accounting for nearly half of global deal activity. However, despite rising power market volatility and policy uncertainty, corporations are becoming more sophisticated as their appetite for clean, firm power grows.
Explore the insights → bloom.bg/4tHqicx
2
8
1,527
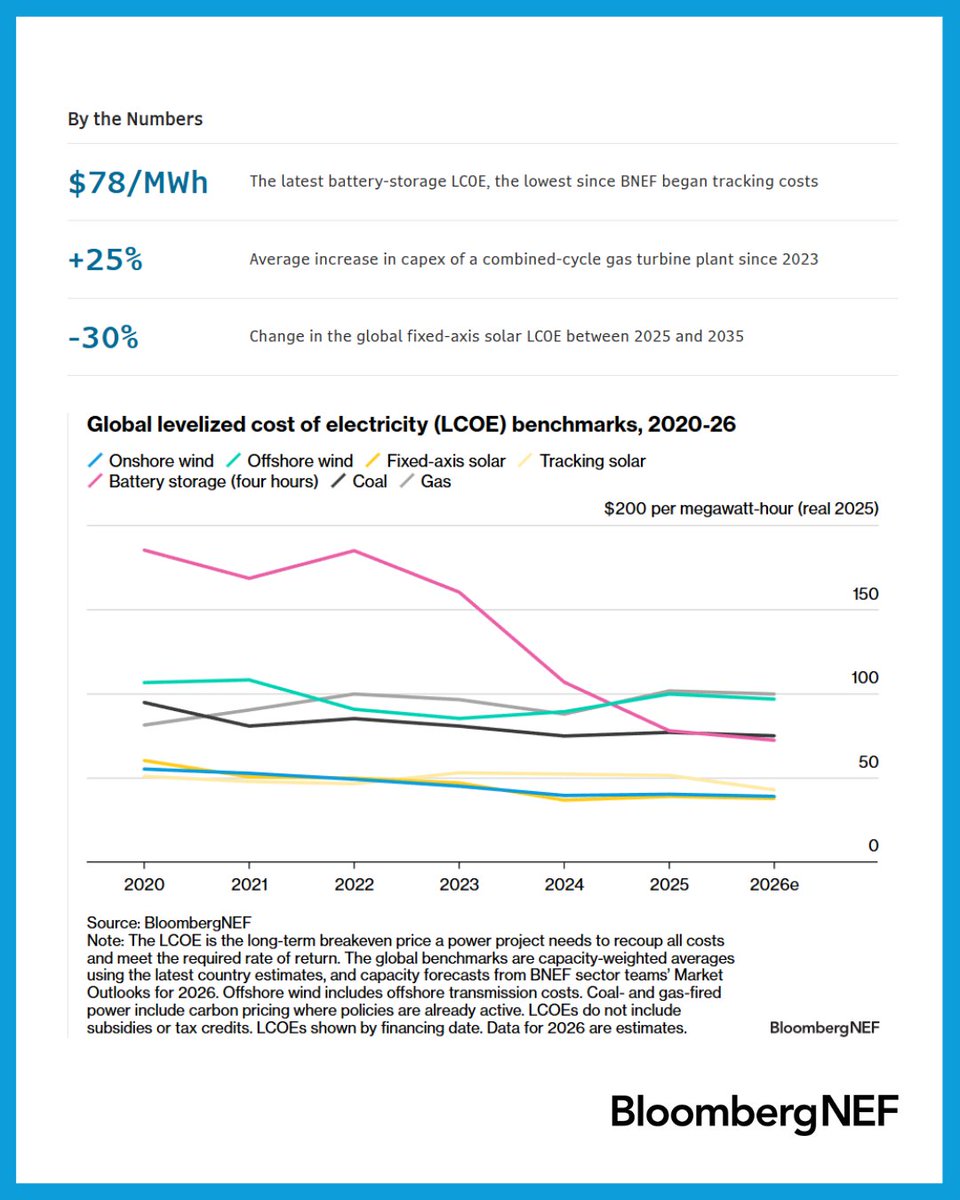
Feb 19
📉 Battery storage costs have fallen to a record low, even as solar, wind and gas turbine costs increased.
BloombergNEF’s research shows the global benchmark levelized cost of electricity (LCOE) for a four-hour battery storage project declined 27% year-on-year to $78/MWh.
By contrast, global LCOEs in 2025 rose for:
• Solar: 6%
• Onshore wind: 2%
• Offshore wind: 12%
• Combined-cycle gas turbine plant: 16%
The data underscores diverging cost trends across generation and storage technologies this year.
Explore the research ➡️ bloom.bg/4aqBNxh

5
74
179
14,460
Feb 18
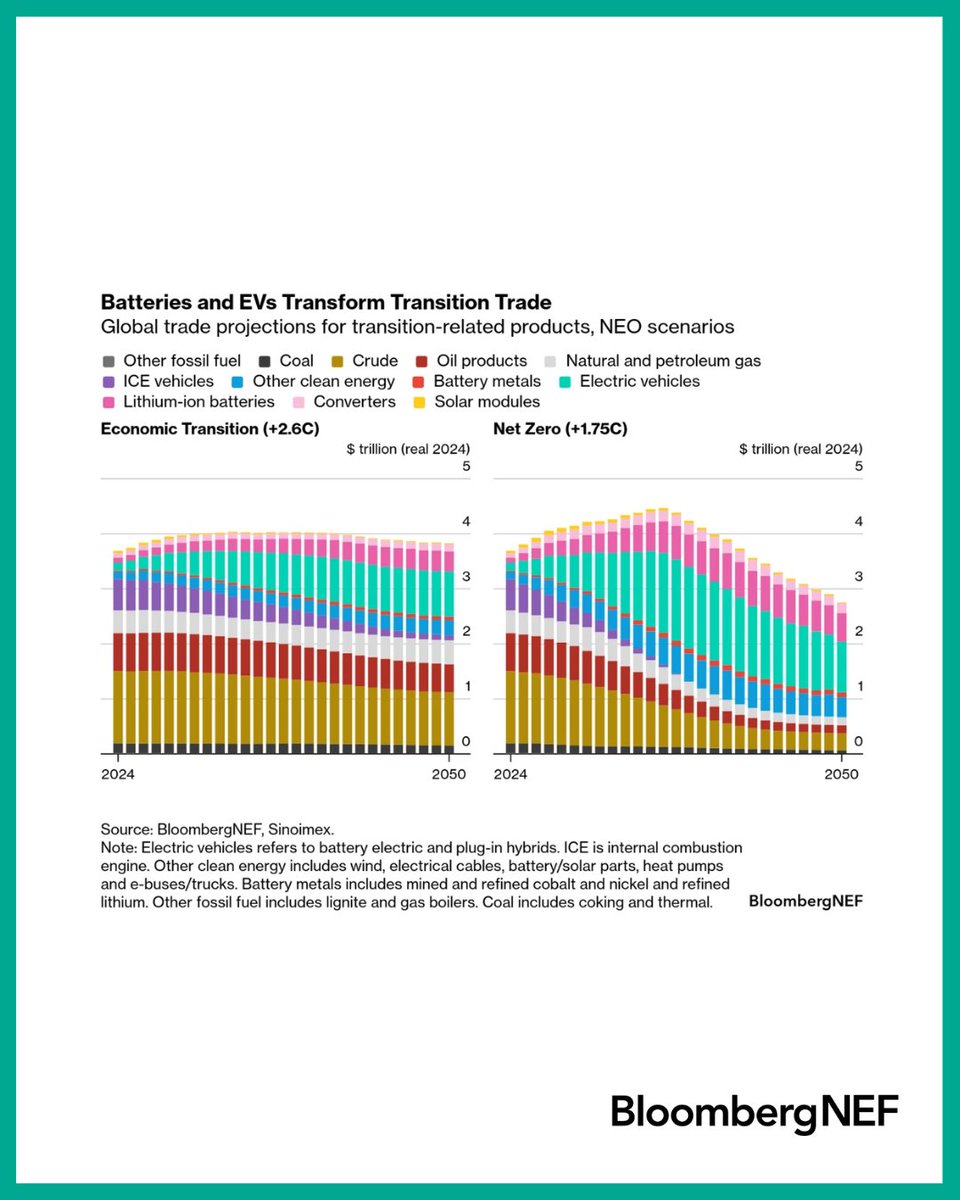
How will the global shift to lower-carbon, more secure energy reshape trade flows? 🌍
Which countries stand to gain or lose as clean technologies scale?
Clean energy accounted for just 2.2% of total cross-border goods trade in 2024, but that share is set to rise as the transition gathers momentum.
Our inaugural Trade Transition Scenarios model trade-flow projections through 2050, spanning 28 geographies and 28 transition-related product categories.
Key insights from our Economic Transition Scenario:
📈 Electric vehicle (EV) and battery trade more than triples to $880 billion by 2035, up from $234 billion in 2024.
📉 Internal combustion engine (ICE) vehicle trade declines sharply. Rising EV adoption shrinks ICE vehicle trade to $340 billion by 2035, down 39% from 2024 levels.
🛢️ Crude oil and refined products keep fossil-fuel trade near $3 trillion through 2030 before a prolonged decline to 2050. Expanding natural-gas trade does not offset oil demand destruction in dollar terms.
Learn more: bloom.bg/4tIaYwe
2
11
1,514
Feb 6
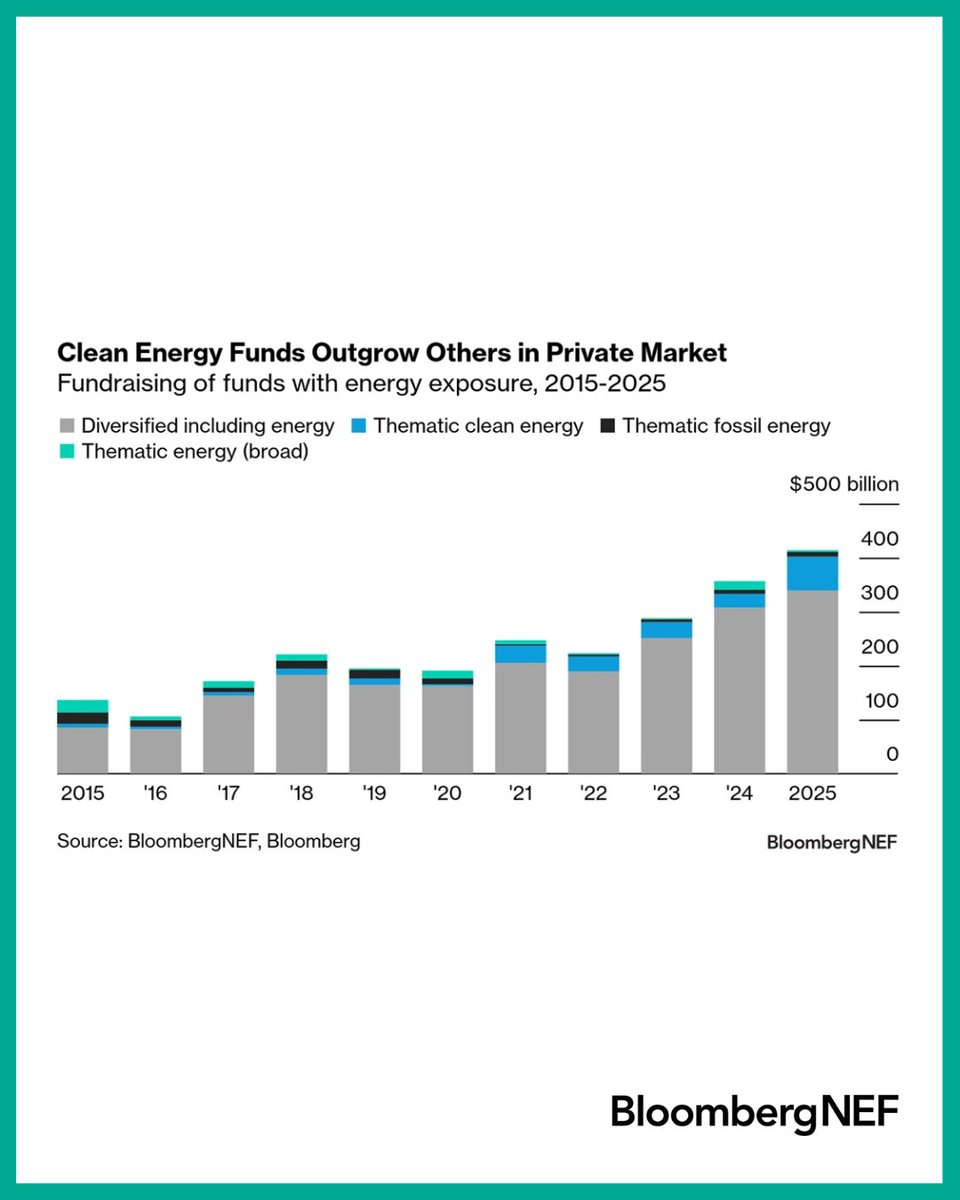
Transition funds dedicated to the move away from fossil fuels have taken off more recently, accelerating private-market energy capital.
💠Private markets have raised $2.7 trillion for funds investing in energy over the past decade.
💠Clean energy focused private market funds drew in about $178 billion since 2021 – triple the sum of thematic fossil and broad energy funds combined.
💠With aggressive fundraising, clean energy strategies now sit on about $92 billion of dry powder – the amount of capital committed to a fund but not yet called from investors.
💡Learn more about the drivers behind the shift: bloom.bg/3MaZe4s
1
3
4
1,236
Jan 29
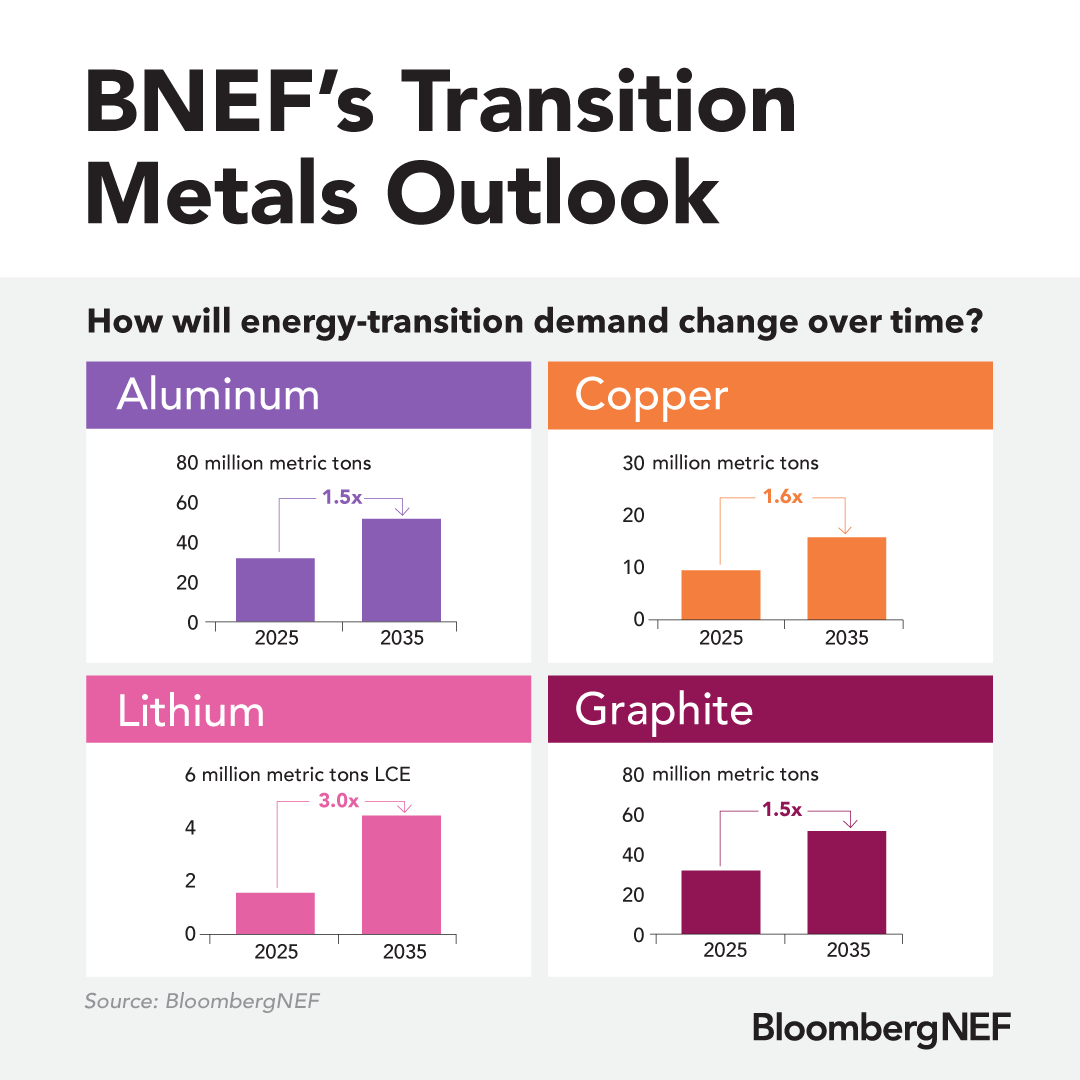
As transport electrifies, power grids expand, and renewables scale up, demand for metals critical to the energy transition continues to accelerate. But which markets are seeing energy-transition demand grow the fastest? 📈
Looking out to 2035, BNEF finds that energy transition demand for:
▪️lithium could triple
▪️aluminum and graphite could rise by around 1.5x
▪️copper could climb by 1.6x
💡Explore the full Transition Metals Outlook for deeper analysis: bloom.bg/3Z5h3Vl
1
3
8
1,162