Are more people moving into or out of your county? If you live in Clark County, NV, 100,000 people moved in between 2019-2020. In the same year, about 81,000 residents moved out resulting in net growth of over 19,000 residents! Explore your county here: cares.page.link/xsrE
New data alert! We’ve added Childcare Cost data to the CARES Map Room. Select your county to find out the total cost and percentage of median family income of #childcare in your community. cares.page.link/ES5z
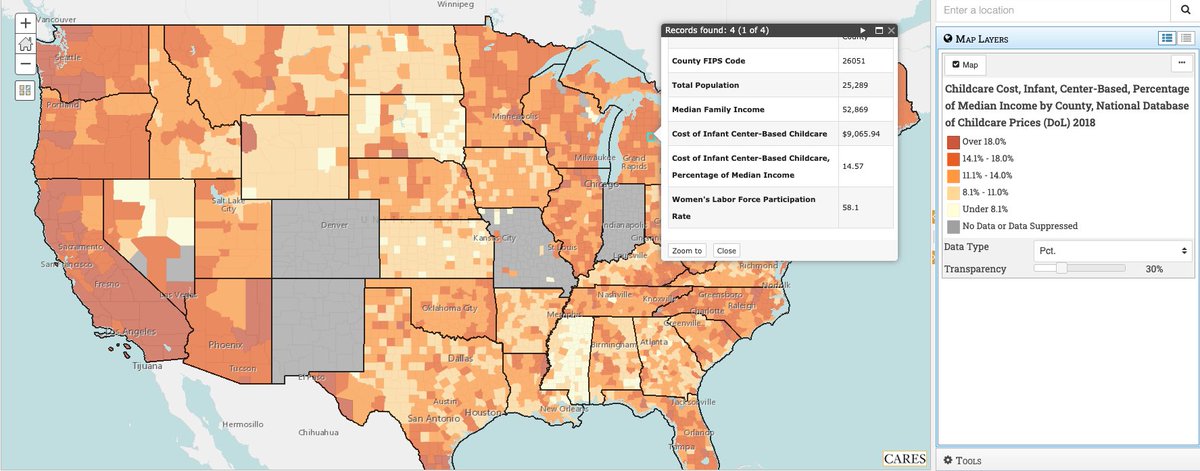
ALT Map showing Cost of infant center-based childcare in Gladwin County, MI is $9,065.94 and 14.57% of median income.
ACS 2018-2022 data has been updated in the CARES Map Room with over 350 new layers, just in time for International Love Data Week! Data is personal. Search “ACS 2022” in the Map Room to get the most up-to-date look at you community: careshq.org/map-room/#LoveDa…
It’s still peak flu season across the US. Check out the RocHealthData Influenza Surveillance Dashboard we created covering the city of Rochester, New York. Interested in a similar dashboard for your community? We’d love to work with you! rochealthdata.org/influenza-…
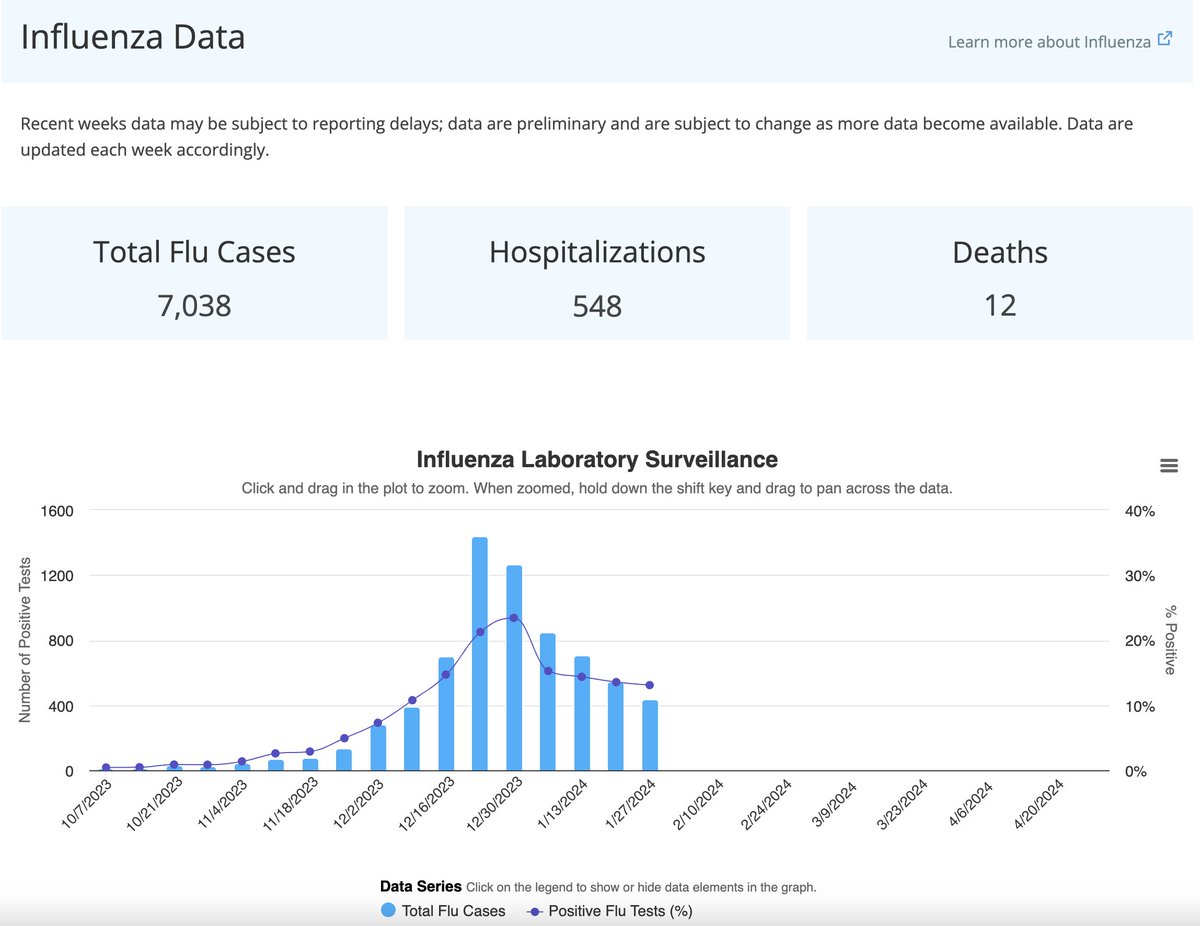
ALT Bar graph showing change in flu cases and positive tests for Rochester, NY between 10/7/23 and 1/21/24.
Today is Internet Safety Day. We’ve partnered with @umsystem to bring more reliable, safer internet to Missourians. Check out these resources about internet safety and cybersecurity on MOBroadband today! mobroadband.org/resources/in…
We've updated USDA Agricultural Foreign Investment Disclosure Act data in our CARES tools. These layers show full or partial foreign investment in agricultural pasture land, crop land, and forest land.
Explore the map to check out all four layers: cares.page.link/VuQx
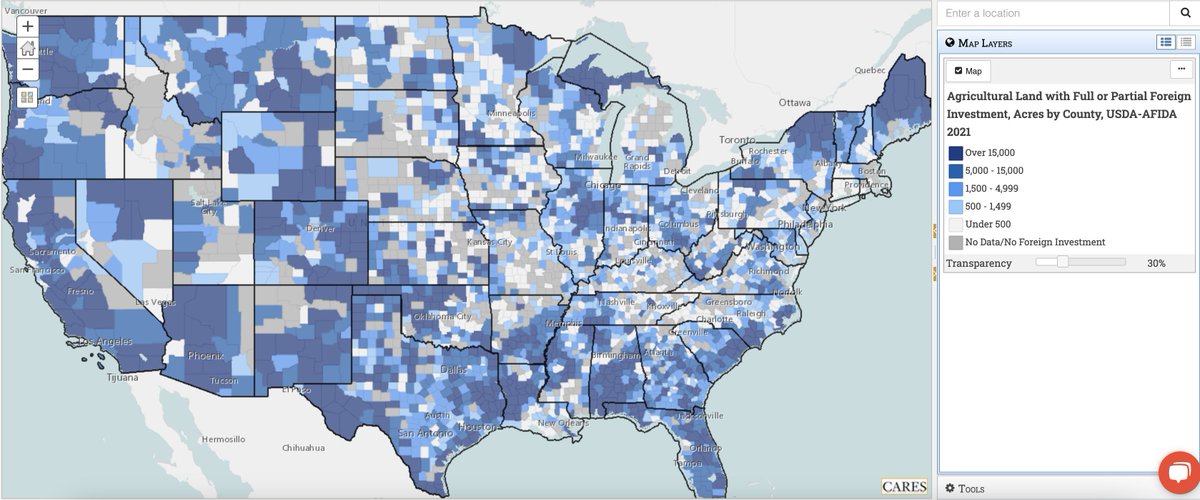
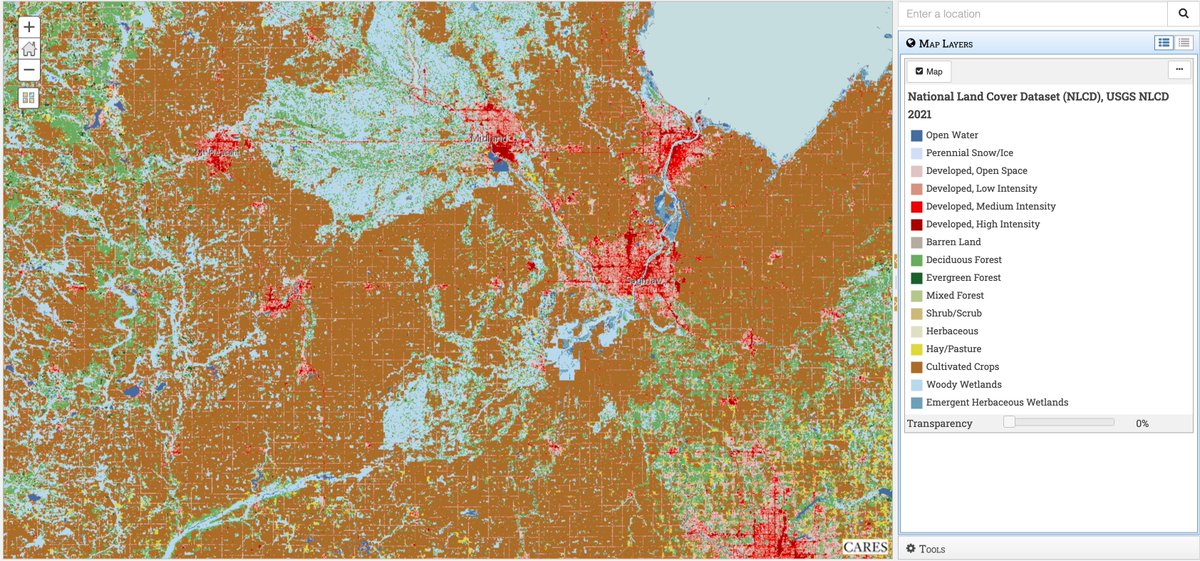
ALT Areas of map with darker shading indicate more acres with partial or full foreign investment, areas with lighter shading indicate fewer acres of full or partial foreign investment.
Are you a programmer interested in developing web-based tools, maintaining Web APIs and REST APIs, collaborating on data visualization, and working with collaborators to bring their vision to life? Explore our open #programmer position now: bit.ly/425fKq1
6
Center for Applied Research & Engagement Systems retweeted
Are you a programmer looking for your next opportunity with experience in Python, ESRI Products, C#, Javascript, PHP, or HTML? Check out the full job ad for an open Programmer Analyst position with our parent company, @CARESMUbit.ly/425fKq1
Winter weather has impacted all of us in Missouri already this year. It’s helpful to stay prepared by understanding the winter weather risk of your county, or those you’re traveling to, as determined by @fema . Explore our map to learn more: cares.page.link/ExSz
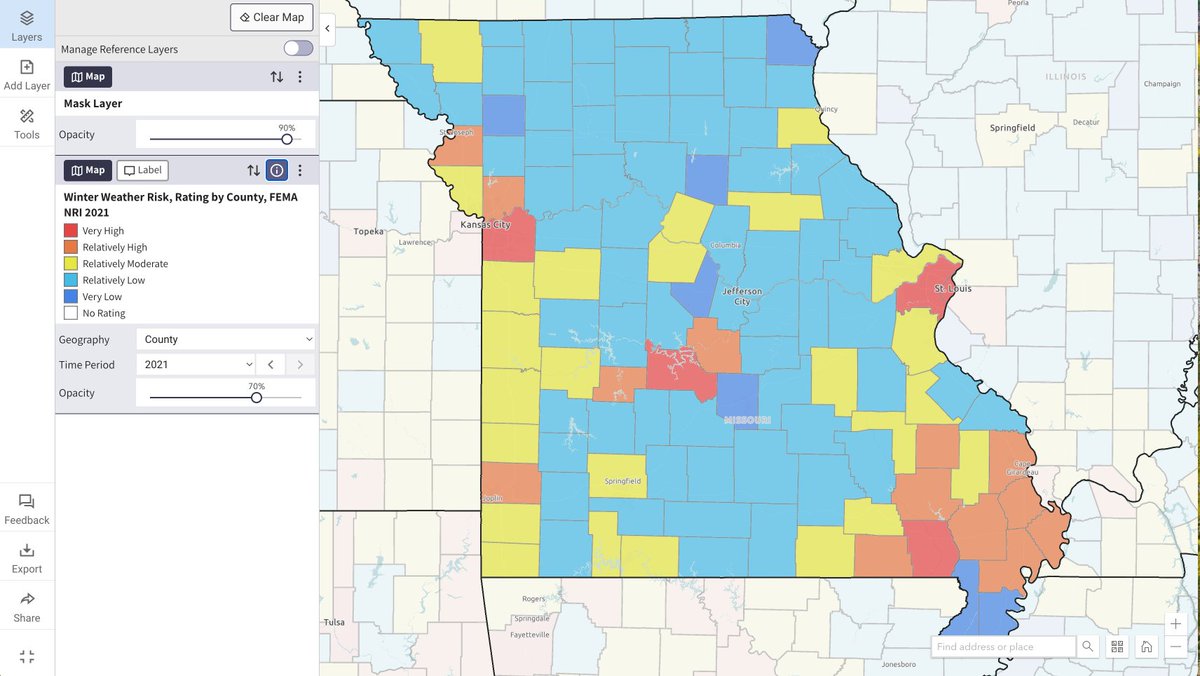
ALT Map showing different winter weather risk by county in Missouri; Very high-risk counties are in red, whereas very low risk counties are in dark blue.
Are you a skilled #programmer looking for your next opportunity? Check out our open Programmer Analyst position where you will work at the forefront of data visualization and analysis. Click the link to learn more about the position and the work of CARES. bit.ly/425fKq1
Are you looking to make public health data more accessible to community members? That's our specialty! Check out Roc Health Data to see what CARES can do. rochealthdata.org/
Interested in what we can do for you? Reach out today: careshq.org/contact/
Check out the first drought monitor report of 2024! We update the #drought monitor in our map room every week. Explore the January 2 map now: cares.page.link/HMYe
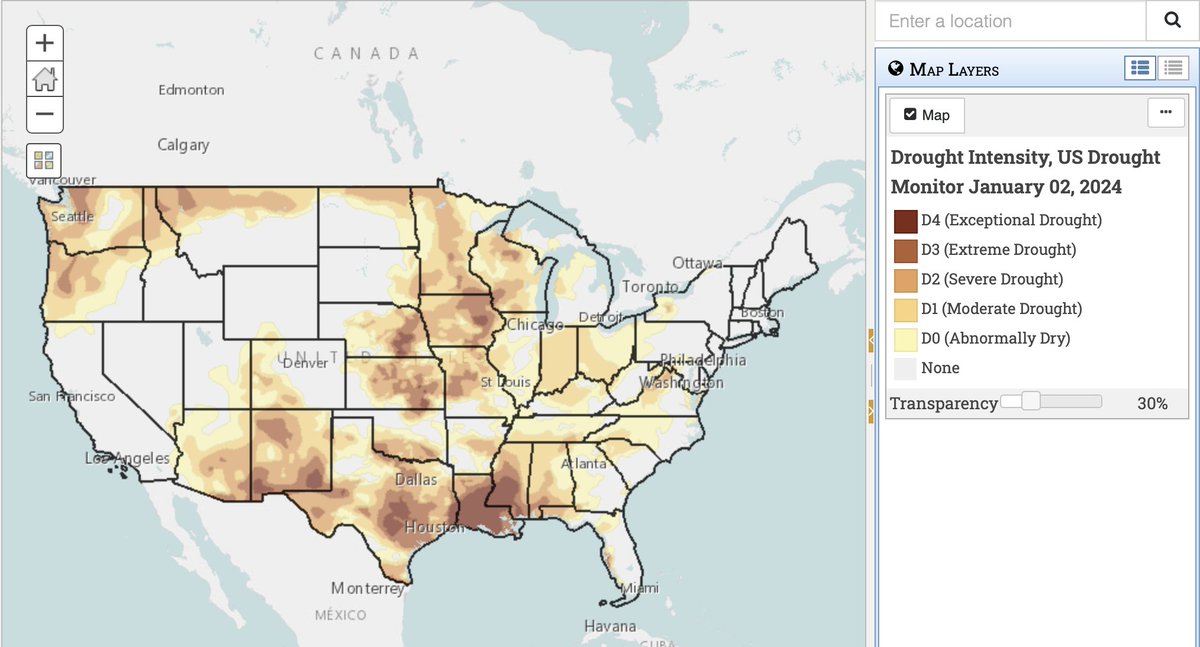
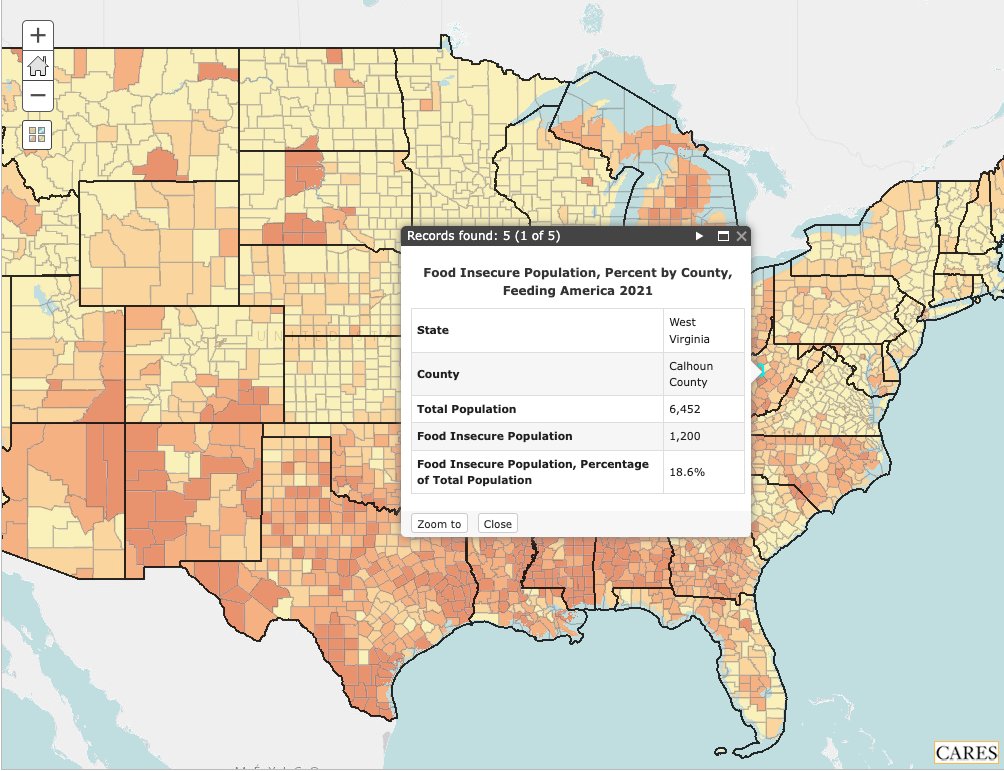
ALT Various levels of drought around the US. Dark red indicates more severe drought, light yellow indicates less severe drought.
Do you know how to assess the social vulnerability and opportunities within your community or service area?
Check out SparkMap’s webinar to learn more about the Social Vulnerability Index, Opportunity Index, and how to use them: youtube.com/watch?v=kKnBZyv1…
As we look back on 2023, we’re grateful for the 135,000 of you that visited CARES tools this year! You made 71,000 maps and 166,000 reports to do impactful work in your communities. We can’t wait to see what you do next year!
Data update! We’ve added new data showing diabetes prevalence for adults over 20 by county. This data comes from @CDC BRFSS data set. Explore the map for your county now: cares.page.link/jozR
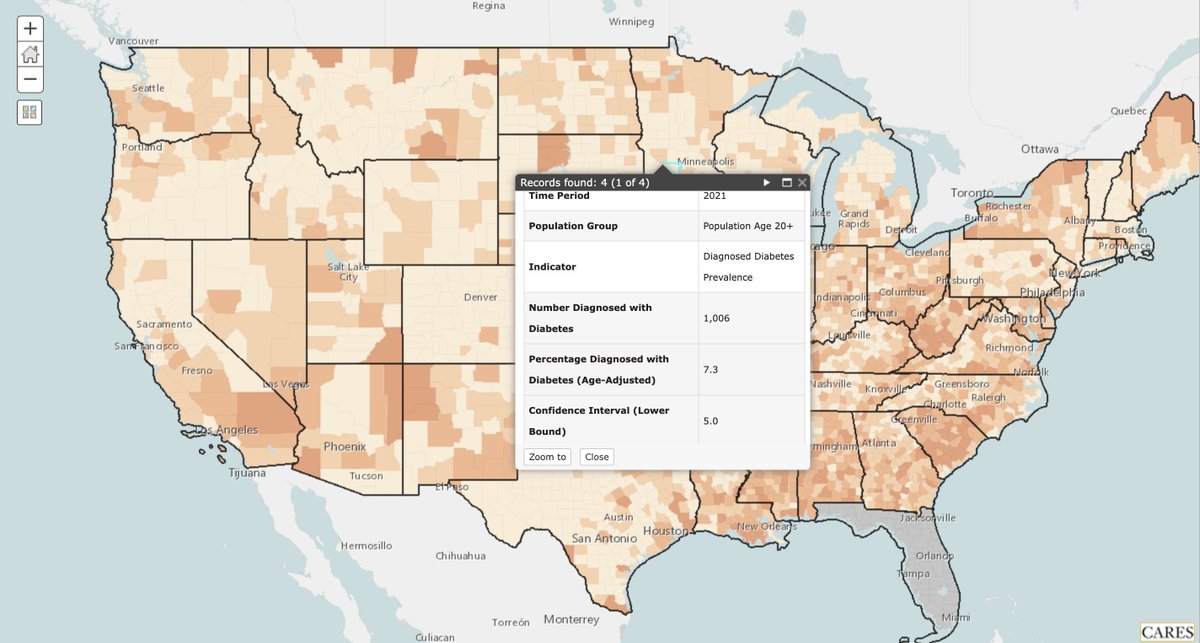
ALT Map showing areas of diabetes prevalence across the US, darker areas indicate higher prevalence.
The CARES team will be taking a break for the holiday season. We’re looking forward to working with you in 2024!
ALT Decorative image stating: The CARES Team will be taking a break from December 25 - January 1. We look forward to the exciting projects to come in the New Year!
Have you joined feedstufffinder.org yet?!
This new site allows you to find or list feedstuff in your area. Check it out today and save time searching for buyers and producers of feedstuff!
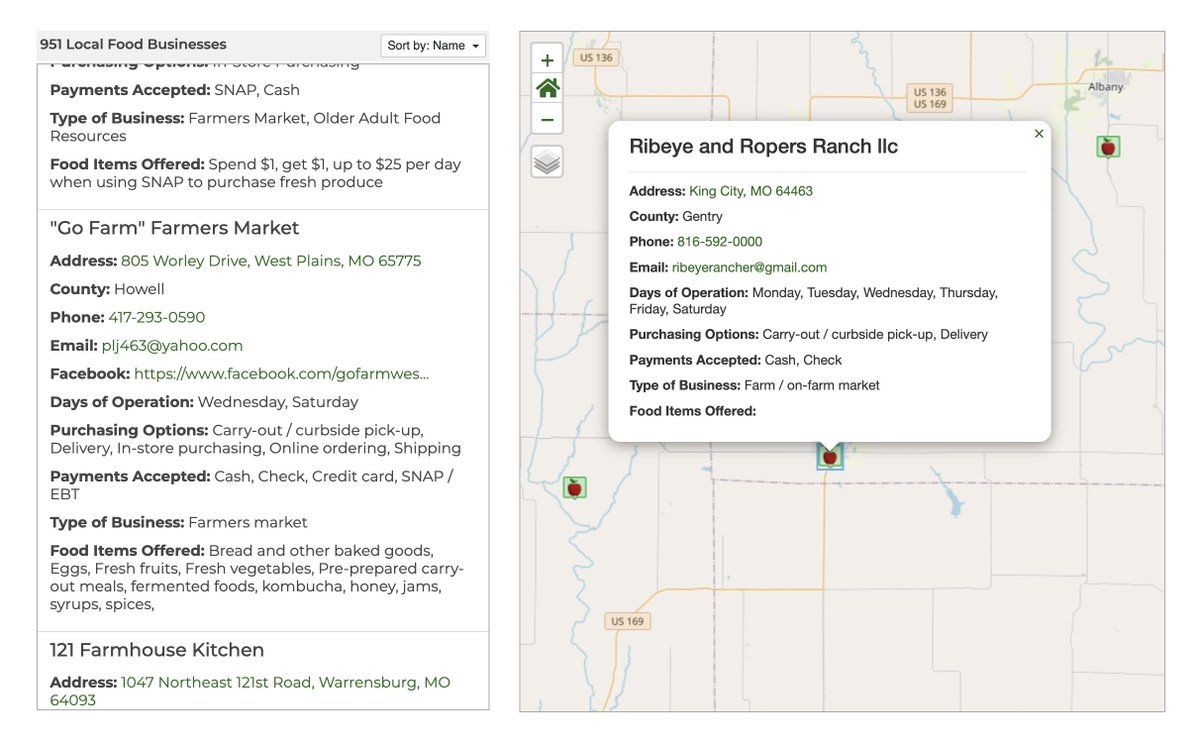
ALT Points on a map showing locations where Feedstuff is being sold, with descriptions of the type of feedstuff and price on the left.
The @MUExtension Grazing Wedge, powered by CARES, enables beef & dairy producers to make forage management decisions aligned with their production goals by calculating pasture growth rates and forage production. Explore the site today: grazingwedge.missouri.edu/#ag#farming
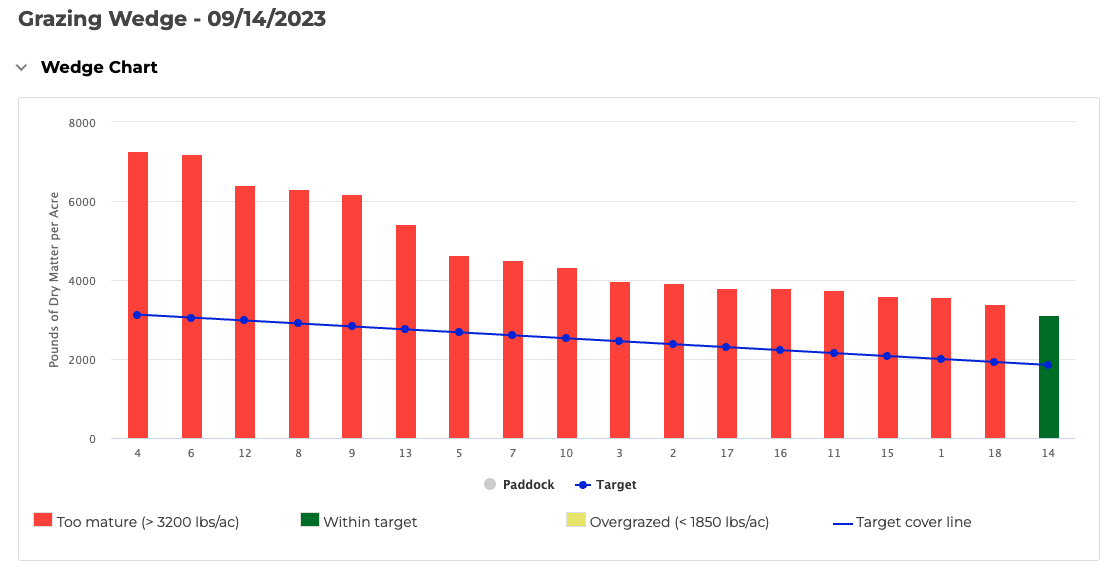
ALT Bar graph showing paddocks ranging from too mature to within target for grazing.
Check out the new Feedstuff Finder platform, powered by CARES! On this site, sellers of feedstuff can share prices, products, information, & locations. Buyers can find feedstuff by location, product type, & price.
Visit feedstufffinder.org now!
#feedstuff#AgTwitter