
Central Command Trading Terminal: giving retail traders professional tools to increase their edge in the markets and get better results! Get FREE Access below!
Joined March 2026
- Tweets 82
- Following 6
- Followers 358
- Likes 60
72 Photos and videos


Pinned Tweet
CC Terminal is 100% free to use. Just connect your @BloFin_Official account and you're good to go.
We're subsidising the costs for the real time liquidation data... AI trading agent credits and much more.
Learn how it works and make a free account:
centralcommand.io/
7
27
42
3,149

Jun 13
CC Cheat Code indicators suggest a bottom around 60k $BTC now. This is also reinforced by a 3d RSI bull div.
Potentially looking for another bear market rally as high as the 90k's before potentially the final bear market capitulation to 50k or below in Q4 20206. Let's see how this ages.
2
4
135
As crazy as it might sound, this is probably not the time to get really bearish on $BTC after a huge selloff to 60k.
Cheat code indicators showing blue and unless something dramatic happens like Strategy selling more BTC or someone big decides to market dump a few billion...
Decent chance we may be at/near a low here for a while again. Let's see how this ages
2
1
10
1,442
Based on this we don't really go much lower than 60k, maybe small sweep and then bounce
unless black swan and Saylor implodes over the weekend... that risk is there for a drop straight to 50k $BTC or below if that happens
otherwise... probably some sort of bounce is decent probability here based on the deviation bands
1
4
1,643
Are you using the Central Command cheat code overlays yet? It's 100% FREE!
1
5
1,300

well well... how good did this age?
1
1
94
Why the $BTC bottom at $60k is probably not in and how to use our cheat code overlays to know when it is.
5
12
796
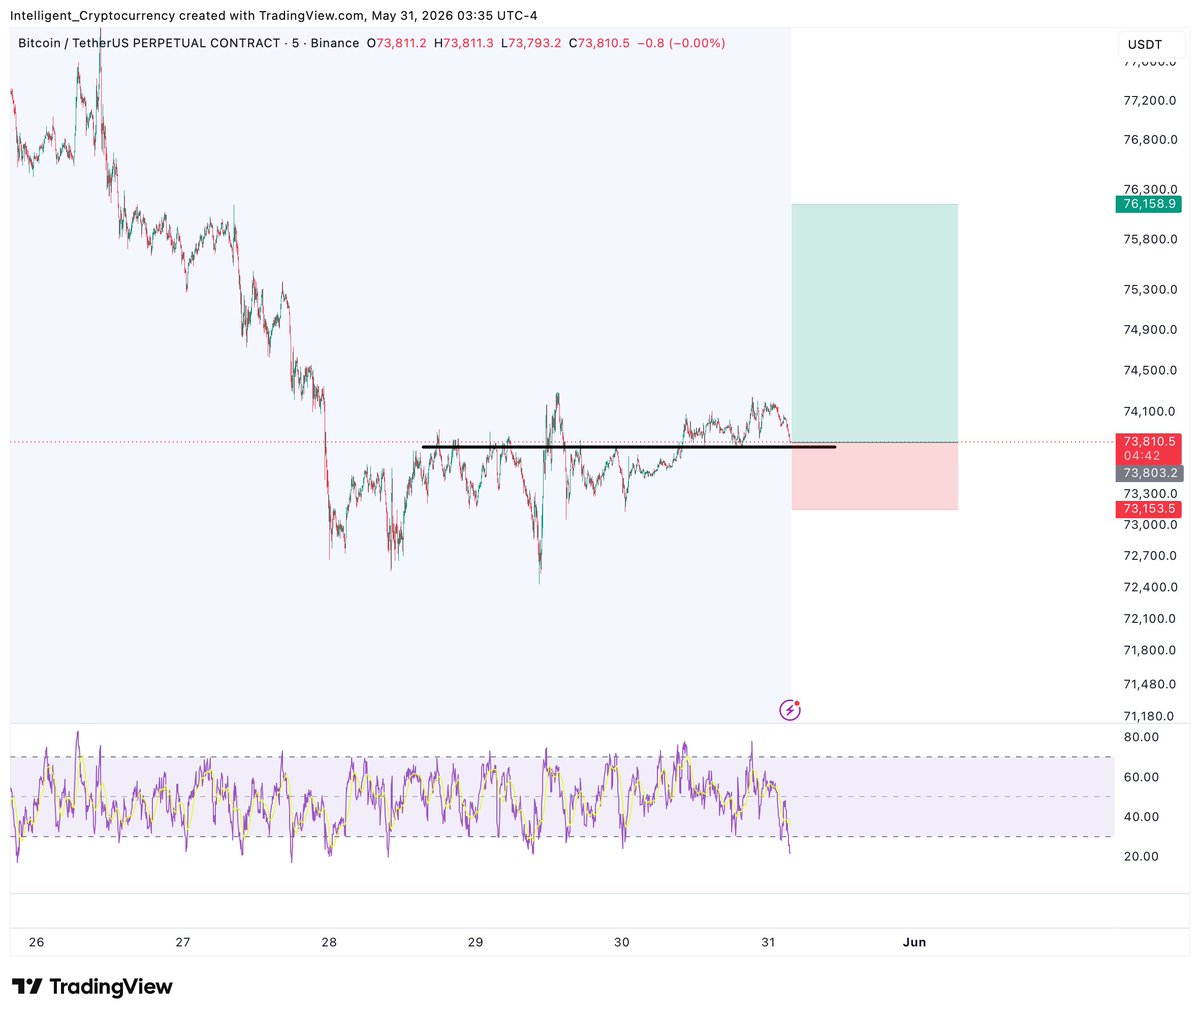
May 31
Using the CC overlays to scalp $BTC 1m charts, in combination with liquidation maps and even regular charts just gives you a much better edge for choosing your trade setups and entries

Bit of a punt long on $BTC scalp expecting the short squeeze and end of the month and bullish moon... let's see

3
143
May 23
there you have it... $78,151 and now we're at $75,500.
These overlays are a literal cheat code to trading.
And it's free!
3
547
May 23
the overlays don't lie. No emotion. No bias. Just pure visual warnings when price is overbought or oversold.
And we've kept it all 100% free to access
May 21
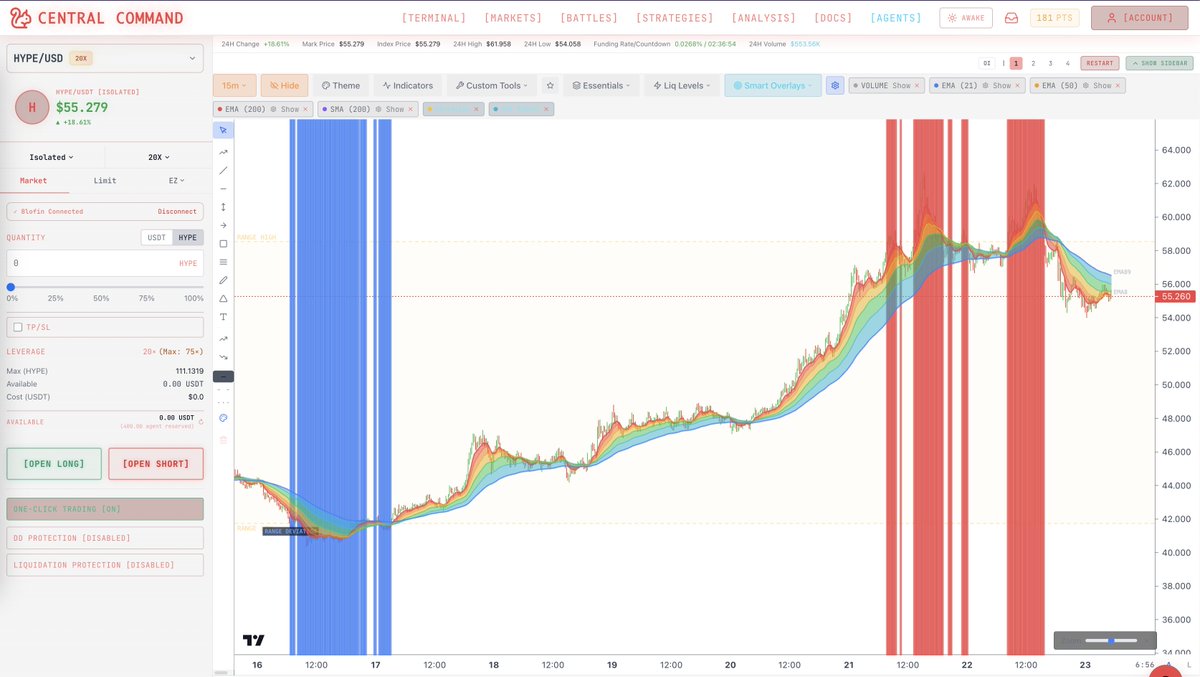
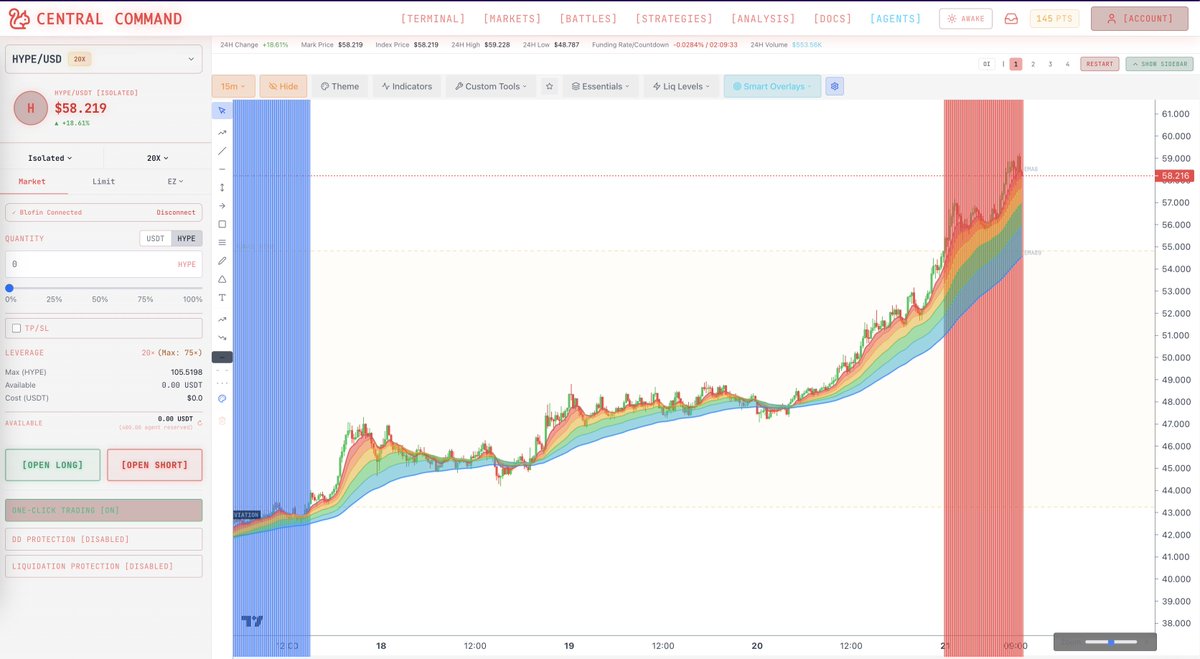
Careful with $HYPE 15m chart red=overheated. Not a place to long, consider closing/hedging open longs.
Pullback or reversal likely soon.
2
115
May 22
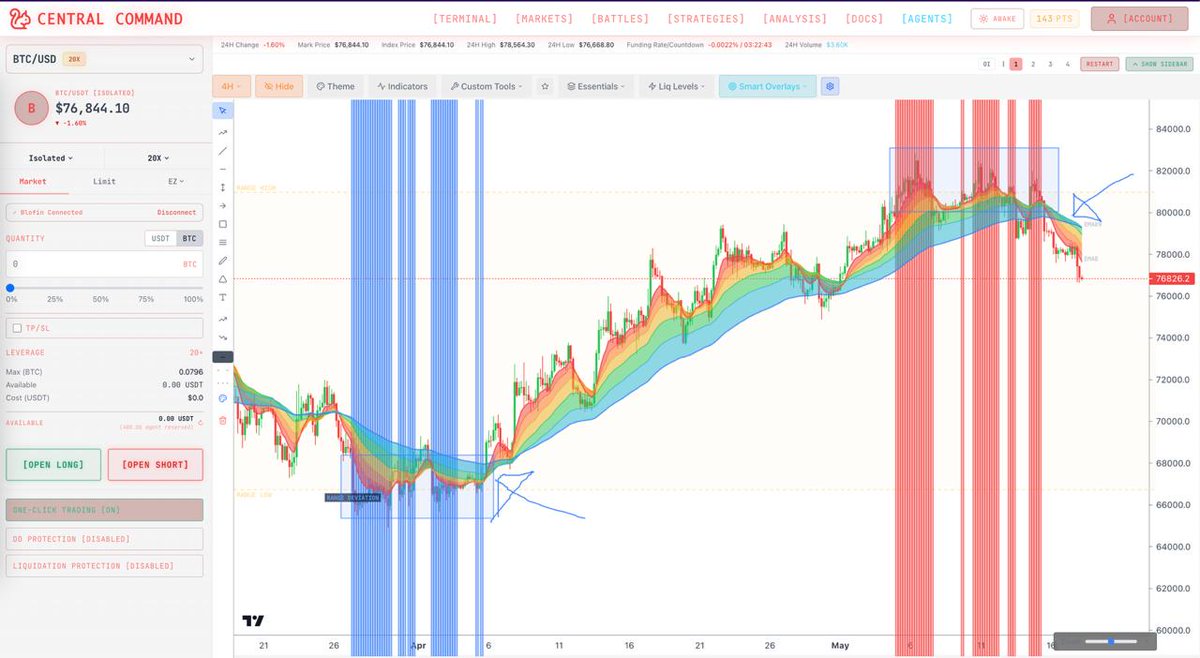
IF $BTC is bearish here and targetin 60k, it shouldnt get much above $78,500 ema ribbon top
1
8
1,201
May 21
Careful with $HYPE 15m chart red=overheated. Not a place to long, consider closing/hedging open longs.
Pullback or reversal likely soon.
1
7
692
May 21
$1000 move up since then... beautiful! These overlays are incredibly helpful for making better trading decisions whether it's ltf or htf, crypto or non-crypto charts.

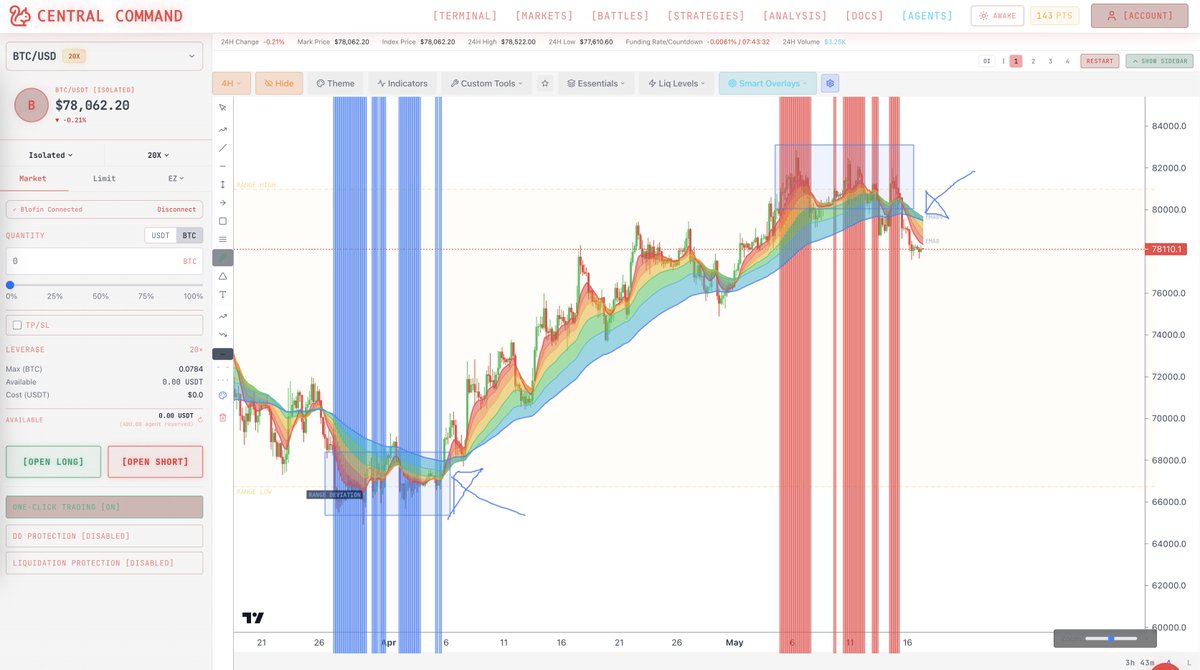
May 19
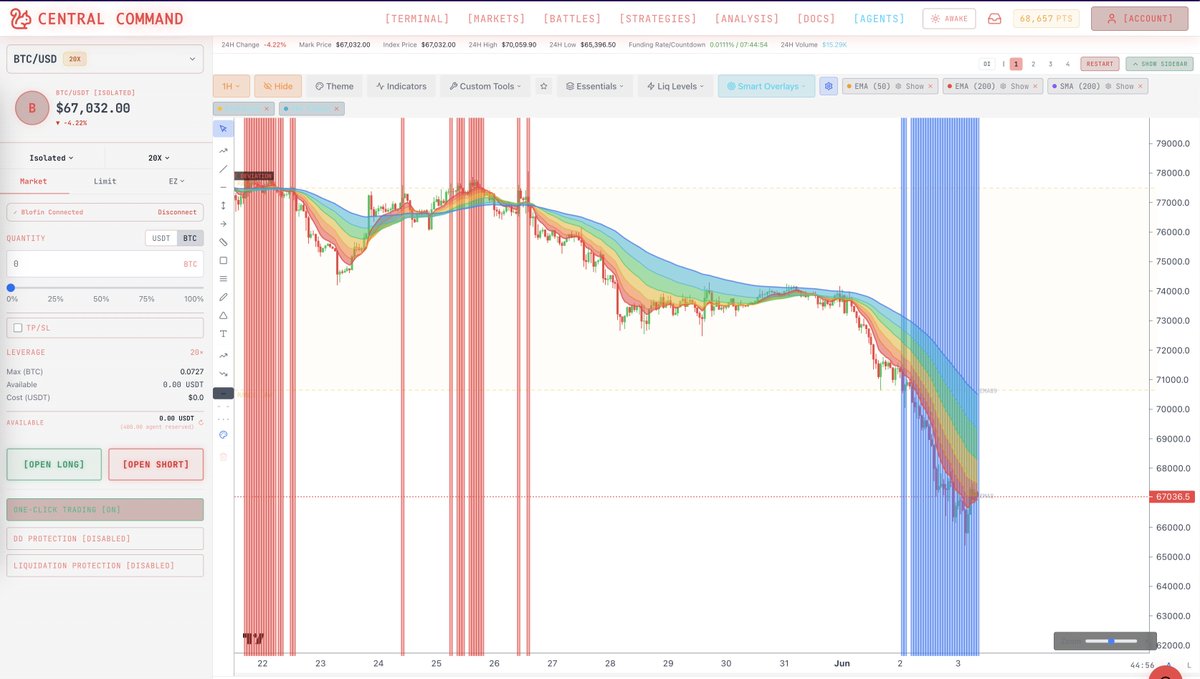
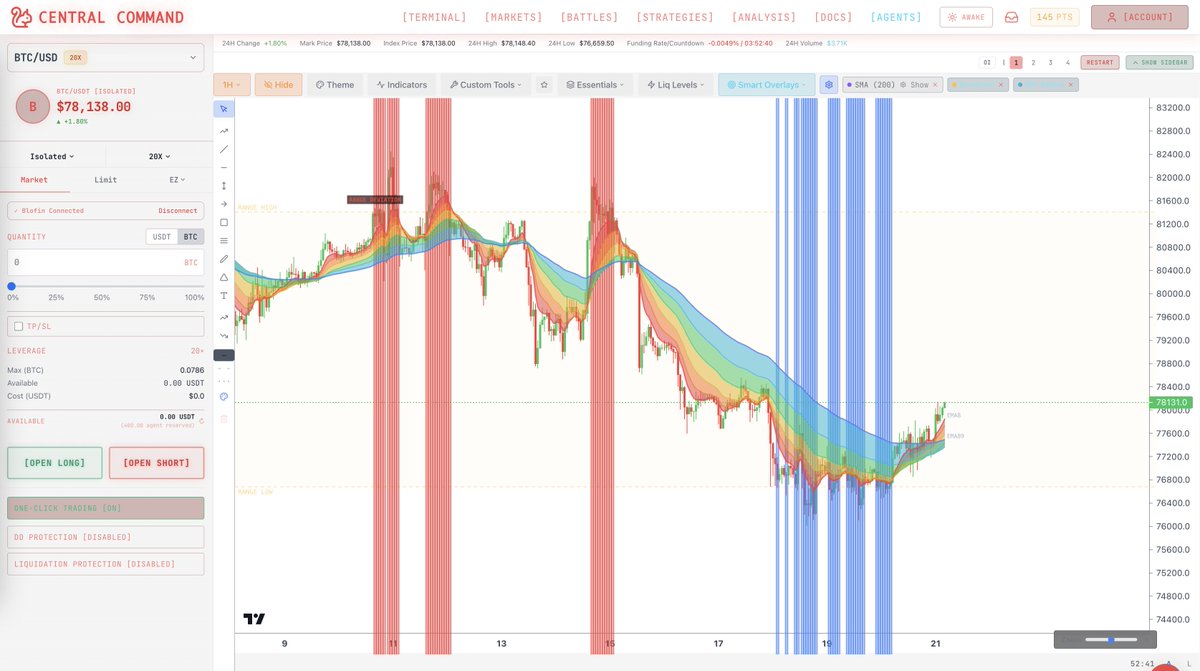
1h $BTC chart = blue... means no shorting into this, possibly close open longs and maybe even punt some longs.
Increased chance for some upside before more downside (HTF still shows more downside likely) but a squeeze to 79k or so completely possible.
We designed this to be a visual aid and easier to see when PA is becoming overbought/oversold for better entry/tp/sl decisions.

1
84
May 19
1h $BTC chart = blue... means no shorting into this, possibly close open longs and maybe even punt some longs.
Increased chance for some upside before more downside (HTF still shows more downside likely) but a squeeze to 79k or so completely possible.
We designed this to be a visual aid and easier to see when PA is becoming overbought/oversold for better entry/tp/sl decisions.
4
164
May 18
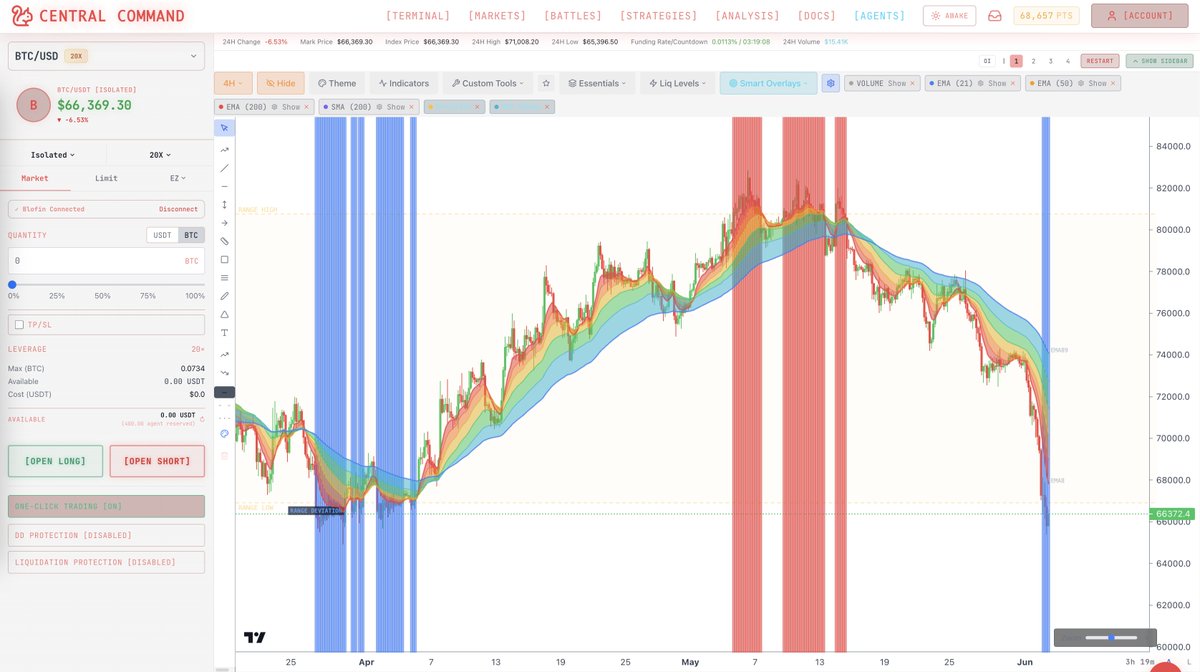
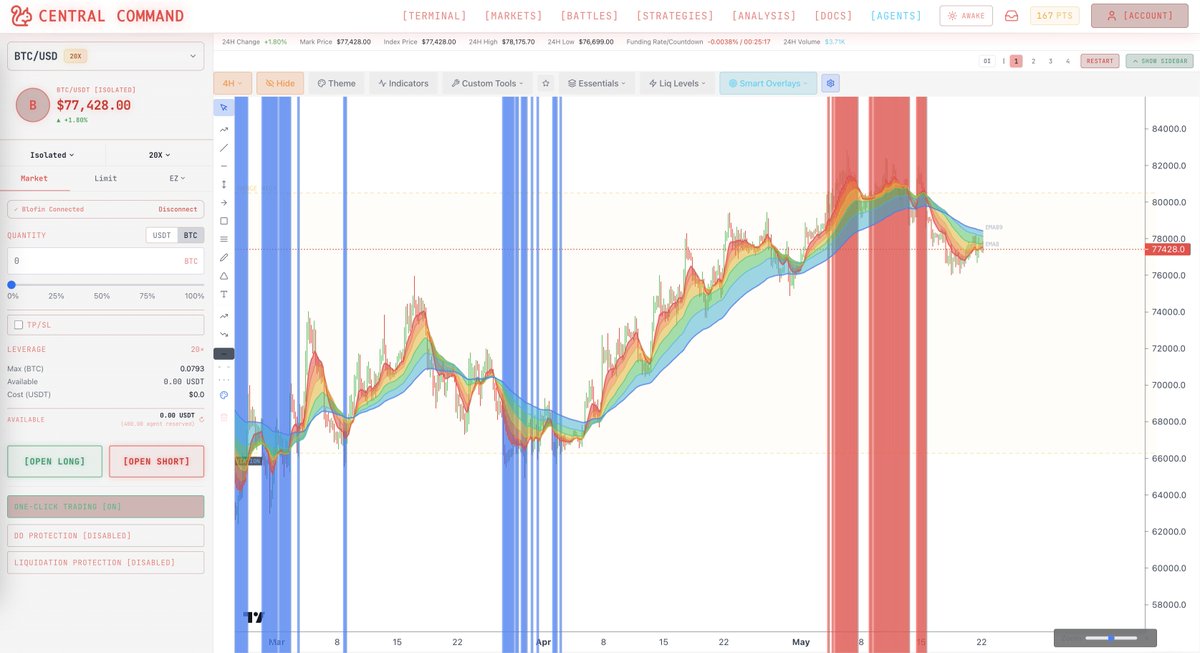
proper ema ribbon flip and price below ema ribbon now
this has a good chance to lead to a decent amount of downside (maybe $60k) just like last time 4h $BTC
1
3
456
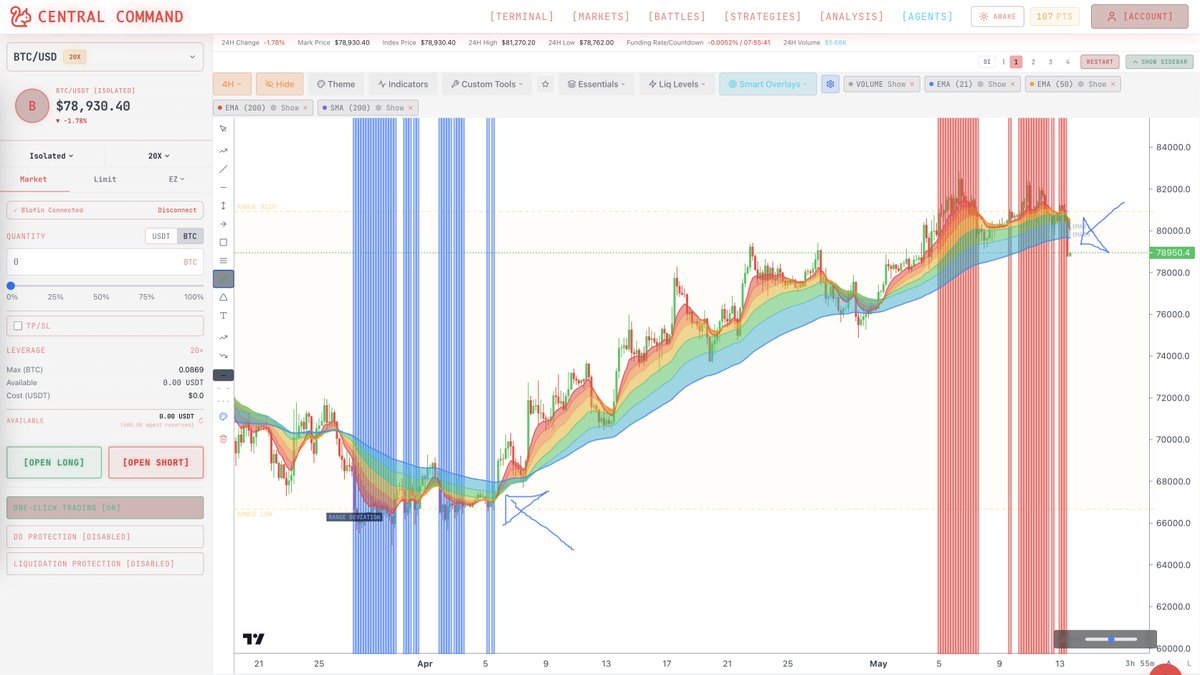
May 17
4h $BTC price is now below the ema ribbon and we have a confirmed ema ribbon flip AFTER the red overbought warnings.
When this happened after the blue we got a 15k move up.
Are we about to drop 15k back down towards $60k?
May 13
Price is now below the 4h ema ribbon... last time after the blue an ema ribbon flip led to a 20k move up. This time after the red... 20k move down for $BTC?
1
74
May 17
Our cheat code overlays help you do this visually and make it very easy to see when a coin is oversold vs overbought!

May 16

This is exactly why you should NEVER fomo after a 23% daily
No matter the coin, no matter the reason, NEVER.

4
74
May 17
UDPATE 🚨 We just added several new 1-click overlays that can be put on any chart/time-frame.
Very cool and visually helpful to spot deviations and extreme price moves (up or down) to help determine when to reduce exposure, TP or even look for reversals.
And can you believe this is all 100% FREE?

2
13
6,910