CDC's Environmental Public Health Tracking Network is a dynamic Web-based tool that provides health & environmental data/info in one easy to find location.
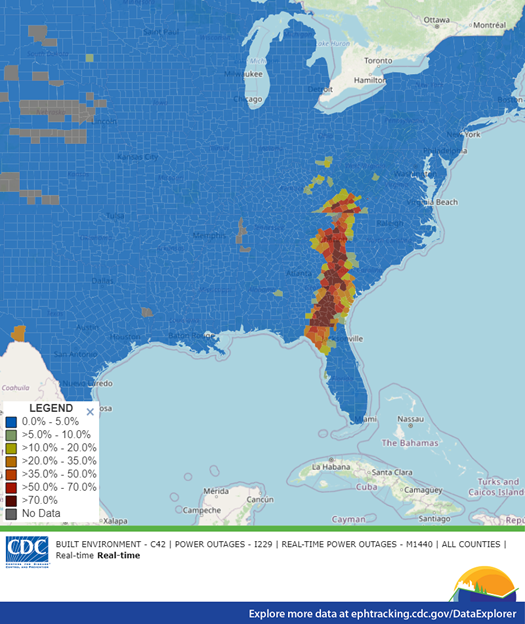
ALT Map of the Southeastern United States showing real-time power outages categorized by percentage, with a color-coded legend ranging from 0% to more than 70%.
People are exposed to low levels of #pesticides every day in a variety of places—at home, school, or work. Check out the exposure #data in your state: bit.ly/3LLb4iW
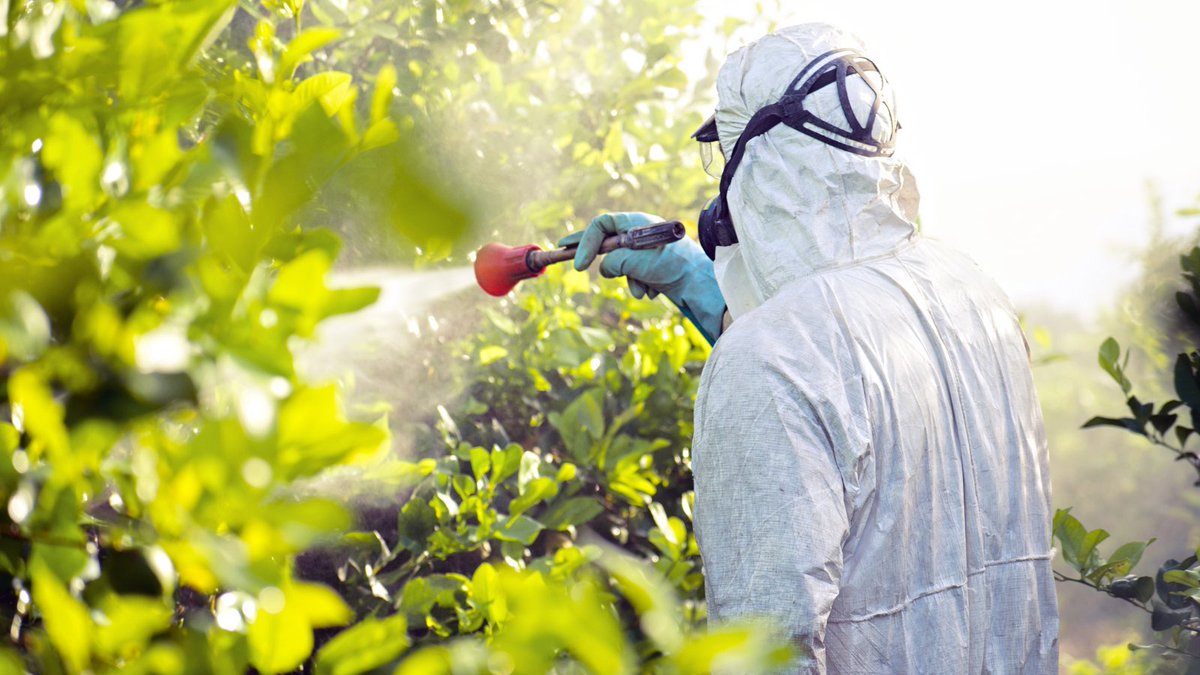
ALT Person in protective suit and mask spraying plants in a sunny orchard.
#DYK? Contaminants can get into #water supplies and become a #publichealth risk if they reach a certain level. Check data on your public water system from the CDC Tracking Network & learn why #WeTrackThat: bit.ly/TrackingWater
ALT A person filling a clear glass with water from a kitchen tap.
Save the date! Join us January 27th from 2–3:30 p.m. ET for our next EH Nexus webinar.
Experts will discuss radon’s impact on tribal communities, the importance of testing & mitigation, and initiatives to raise awareness & reduce exposure.
Register: bit.ly/RADON2025
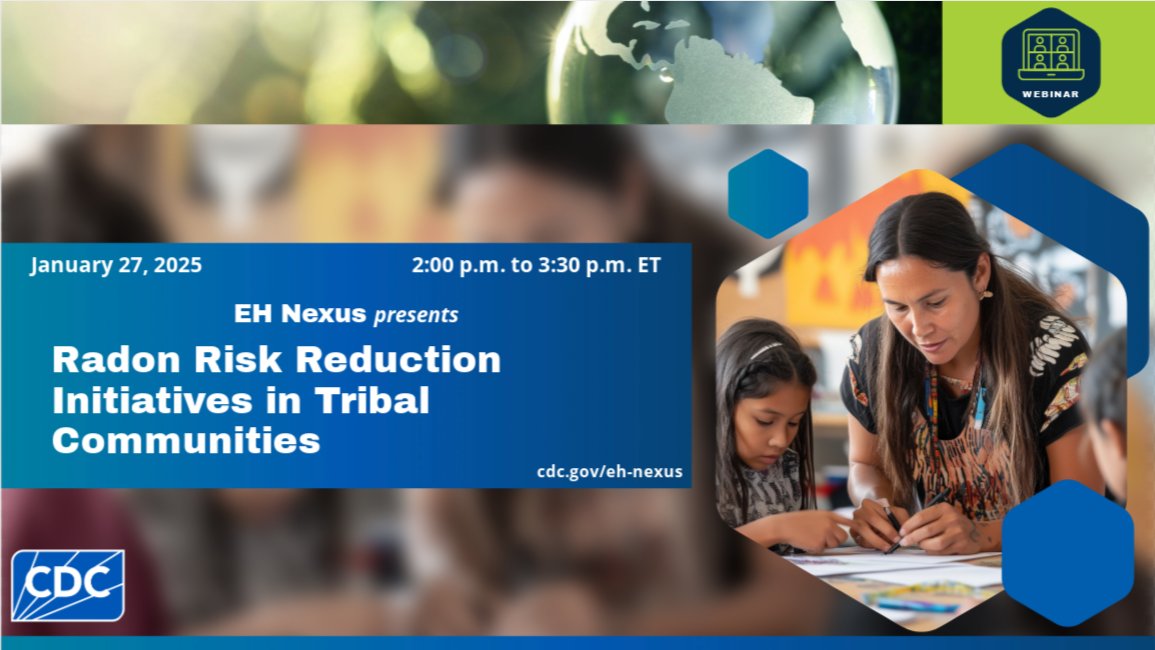
ALT An adult and a child, both focused on reading educational materials at a table. Text reads: "January 27, 2025, 2pm to 3:30pm ET, EH Nexus presents Radon Risk Reduction Initiatives in Tribal Communities."
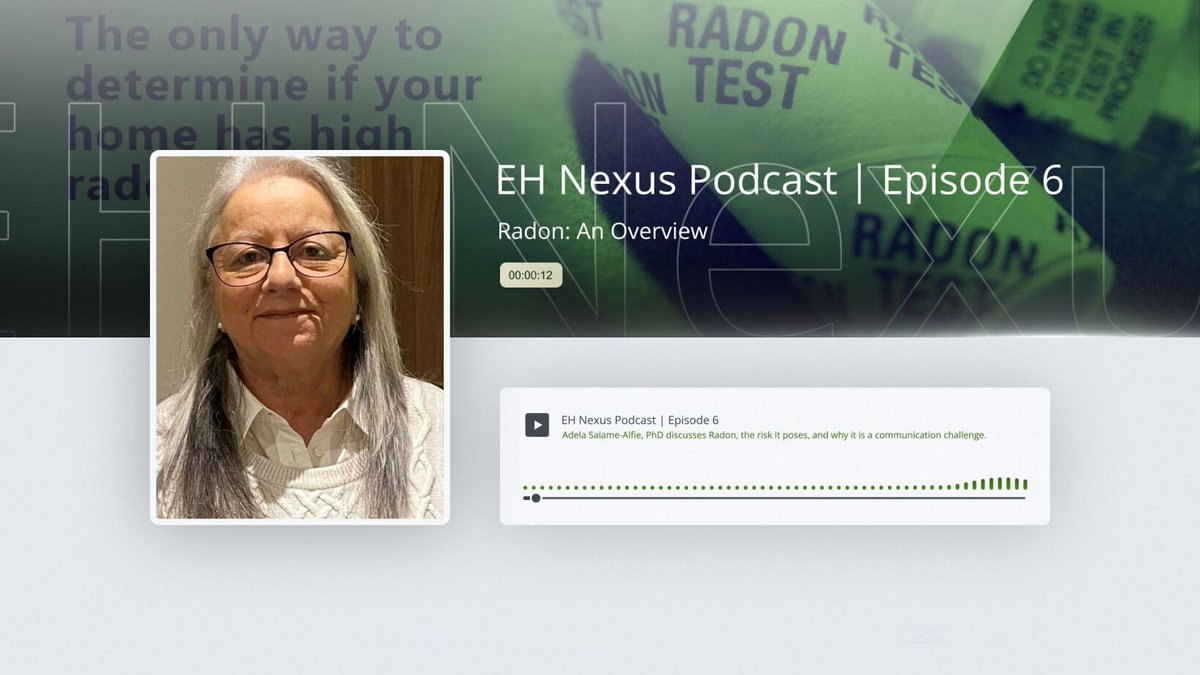
Air pollution refers to any biological, physical or chemical particle in the air that should not be there. To learn more about the sensitive populations air pollution affects, take a look at KY Tracking’s air quality page: healthtracking.ky.gov/Topics…
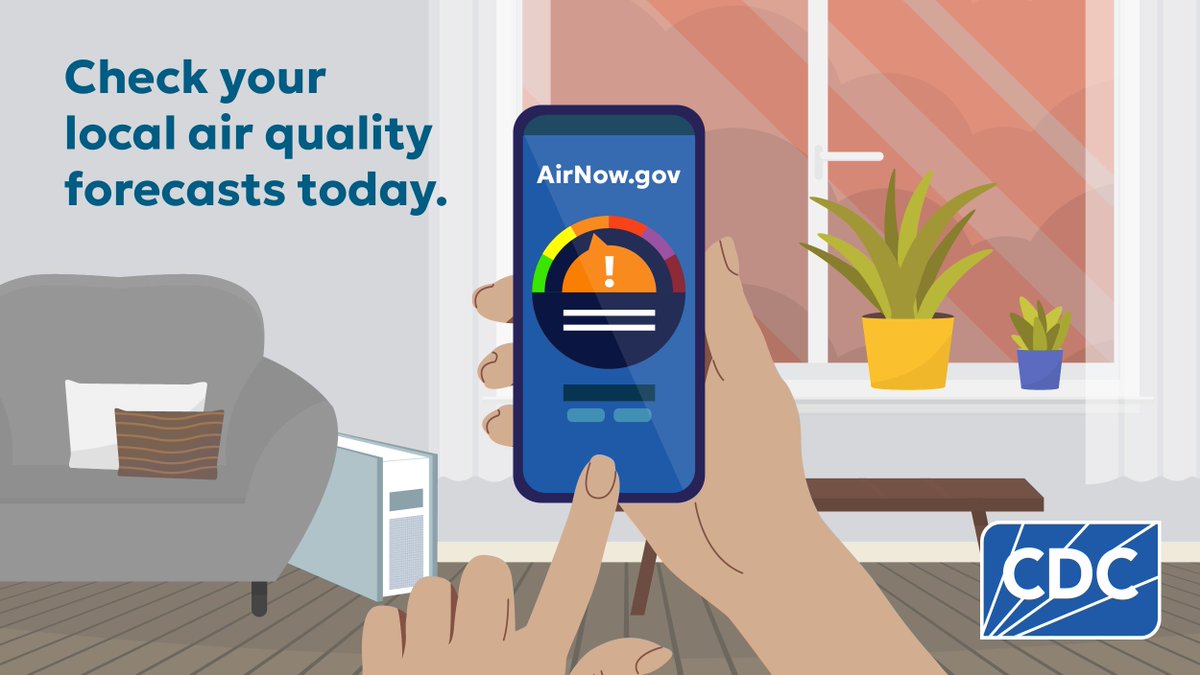
ALT A hand holding a smartphone with the AirNow.gov app open displaying the local air quality scale. Background shows a living room with a chair, window and house plants. Text reads: "Check your local air quality forecasts today."
Save the date! Join @CDCEnvironment on Jan. 27, 2–3:30 pm ET for the next #EHNexus webinar. Experts will discuss #radon’s impact on tribal communities, the importance of testing & mitigation, and initiatives to raise awareness & reduce exposure. Register: bit.ly/RADON2025
Wildfire smoke can lead to health risks such as trouble breathing, asthma attacks, headaches, and chest pain. Keep track of wildfires and air quality near you so you can stay safe.
More wildfire safety tips: bit.ly/3LxsA9n
If you’re in an area affected by wildfires, prepare an emergency supply kit so you’re ready to evacuate if needed. Take only essential items with you.
How to stay safe from wildfires: bit.ly/3LxsA9n
Birth defects affect 1 in every 33 babies born in the US each year. The Tracking Network hosts data on twelve birth defects potentially linked with environmental risk factors. Discover more during this #BirthDefectsAwarenessMonth: bit.ly/TrackingBD
Some communities aren’t built in ways that encourage healthy living. This includes issues like transportation challenges & lack of access to parks & schools.
Visit CDC’s Tracking Network for data & actions to improve #communitydesign:
bit.ly/3rrydPK
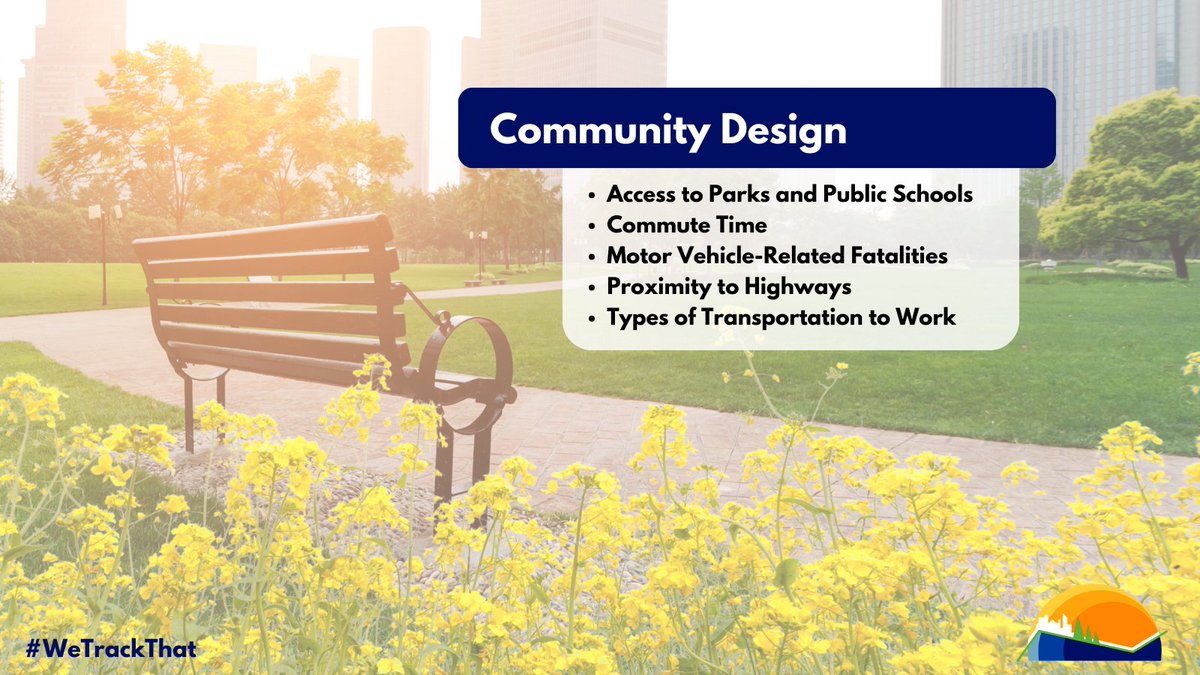
ALT Image of a park bench surrounded by vibrant yellow flowers on a sunny day. The background shows tall green trees and a faint city skyline. Title text on image reads "Community Design" with bullet points about parks, public schools, commute time, vehicle-related fatalities, highway proximity, and transportation types. The hashtag #WeTrackThat is visible at the top left.
High quality drinking water is important to #publichealth. Learn more about the types of drinking water contaminants CDC tracks and view community water system data with our Data Explorer tool. bit.ly/TrackingWater#WeTrackThat
ALT Hand filling a glass with drinking water from a kitchen faucet. Text reads, "DRINKING WATER" and "#WeTrackThat."
Happy New Year from the Tracking Network! 🎉
Visit our website to explore data and info on the environment, health effects, and population health here: bit.ly/49fXVrQ#NewYearNewData
ALT Happy New Year text with a background of sparkling and bursting fireworks in a night sky.
Knowledge is power, especially in emergencies. Tracking Network #data can be used to prepare for and respond to natural disasters or other #publichealth emergencies. Explore the types of data that support informed decision-making: bit.ly/48nu6FG
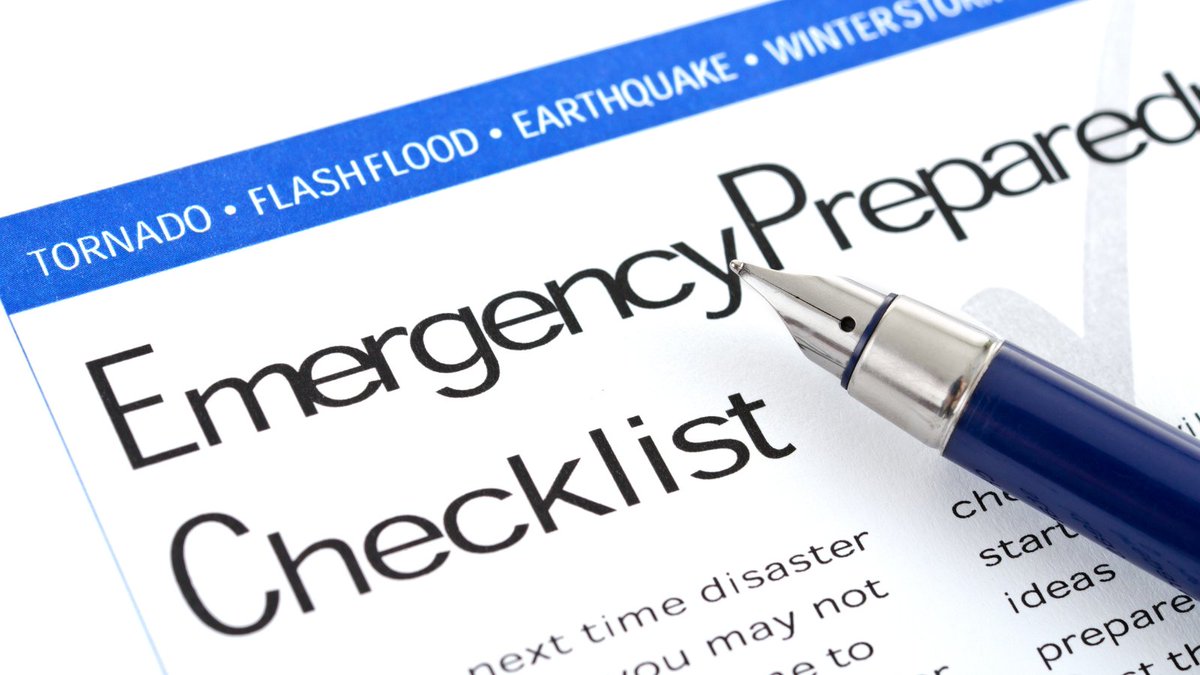
ALT A close-up of an emergency preparedness checklist with a pen resting on it.
Happy Holidays! ❄️✨
Dive into #EnvironmentalHealth data with the Tracking Network’s Data Explorer! Learn to navigate, map, and visualize data for a wide range of environmental health topics. 📊🌐
Check out our video tutorial to get started: youtube.com/watch?v=L6w5xRfa…
Santa is on his way! Before he arrives, discover how the places where you live, work, and play may affect your health. Use CDC’s Info by Location tool to get a snapshot of some of the #environmentalhealth issues for your area: bit.ly/InfoByLocation
Looking for a way to explore #environmentalhealth data this holiday season? Our Data Explorer can help! While we can't help you track Santa's route, we’ve got a sleigh full of other #data you can explore, map, and visualize. 🎅
Check it out: bit.ly/44frSEG
This holiday season, prioritize safety for your loved ones! Hundreds of people in the US are affected by unintentional exposure to carbon monoxide (CO). The good news is that it's completely preventable.
See the #data & learn how to protect your family: bit.ly/TrackingCO
ALT Close-up of a carbon monoxide alarm placed on architectural plans.
The environment around you has an impact on your health, from the air 💨 and water 💧 quality to community design. Learn how the environment affects your health on the Tracking Network & see data for your community: bit.ly/3OAo4Iv
This holiday season, unwrap the connection between your surroundings and your health! CDC's Tracking Network brings together data from national, state, and city sources. 📊🌐
Explore data on the environment, health effects, and population health here: bit.ly/49fXVrQ