
82 Photos and videos


Pinned Tweet

8 Aug 2024
Sometimes, it's essential to see data-driven analysis devoid of human emotions to see the big picture in the market. It's not just about how you use artificial intelligence, but how you train it, and this training should never end. I will be sharing my notes and conversations with the AI I've trained on this topic. It benefits me, and I hope it benefits you too.
#Bitcoin #Ethereum #WinC300
11
1,233
Burc Unalan retweeted

Apr 4
🇺🇸🇮🇷 Iran: “The entire region will turn into hell for the U.S and Israel if they escalate the war. 👀
6
1
27
5,300
Mar 9
Sam Altman says AGI is "a few years away."
Demis Hassabis says "within a decade."
We built a dashboard that tracks exactly how close we are — military AI, compute scaling, alignment failures, governance gaps.
The number might surprise you.
→ chronoslab.es/skynet (chronoslab.es/skynet)
#AGI #AI #AGIIndex #ArtificialIntelligence
1
5,721
Mar 2
RT @anlcnc1: Looking at the Bitcoin Coinbase Premium, there has been strong positive demand over the past hour. This indirectly suggests th…
4
Feb 16
Polymarket looks like pure gambling and once again, manipulators are part of the game.
I display what’s really happening, live.
Watch carefully and educate yourself before risking money.
🎥 Live stream:
youtube.com/live/SLb8Vov7V8g
#Polymarket #Crypto #Trading #MarketManipulation #TradingEducation #RiskManagement
45
Feb 16
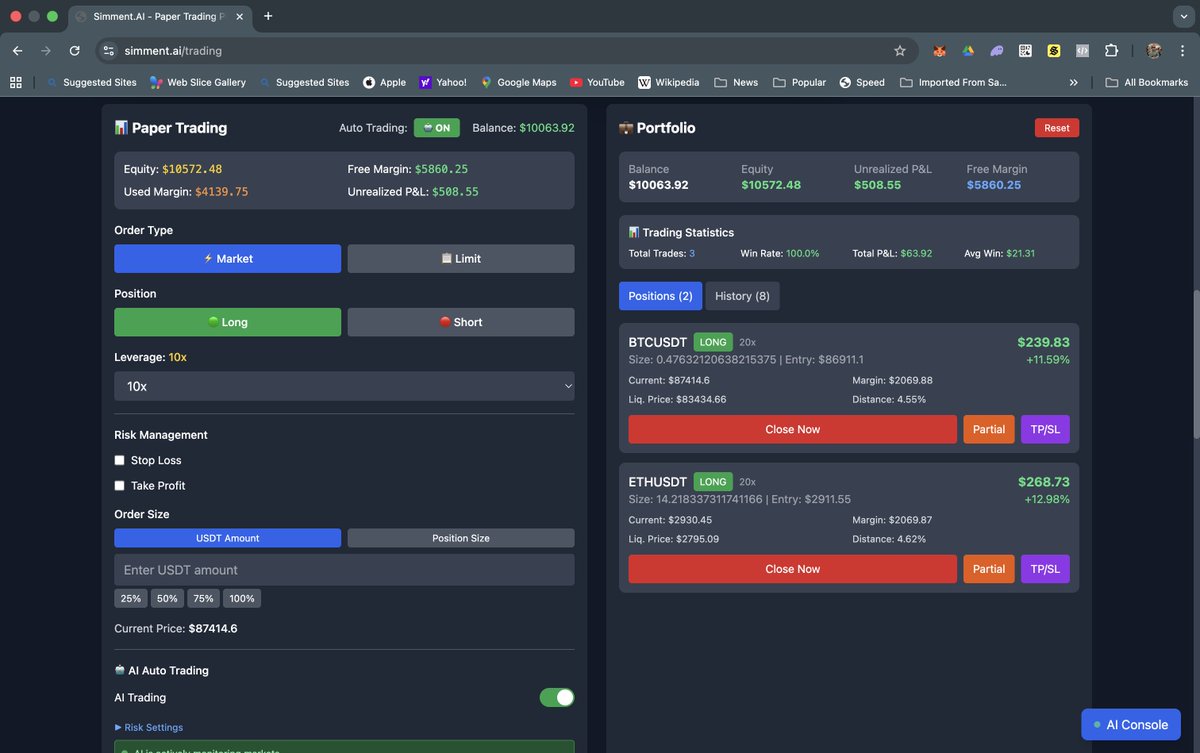
Don’t waste your money — use paper trading to test your knowledge risk-free!
You can also see how an AI decision system performs before you trade with real funds.
Try it here: simment.ai/trading
#PaperTrading #AITrading #Crypto #Bitcoin #FinTech
33
Feb 16
Barber & Odean's landmark study (Journal of Finance, 2000) analyzed 66,465 households and found that the most active traders underperformed the market by 6.5% annually driven by overconfidence and emotional bias. Automated signals help reduce that noise, but the final decision must always remain yours!
#Finance
14
Feb 14
🔴 LIVE NOW: BTC 5min Prediction Bot Watching Polymarket BTC Up/Down markets in real-time with;
RSI,
MACD,
VWAP,
Heiken Ashi & Order Flow analysis.
Now Polymarket Whale Tracker added.
youtube.com/channel/UCuJyNxl…
#Bitcoin #BTC #Polymarket #Trading #Crypto
1
2
217
Burc Unalan retweeted

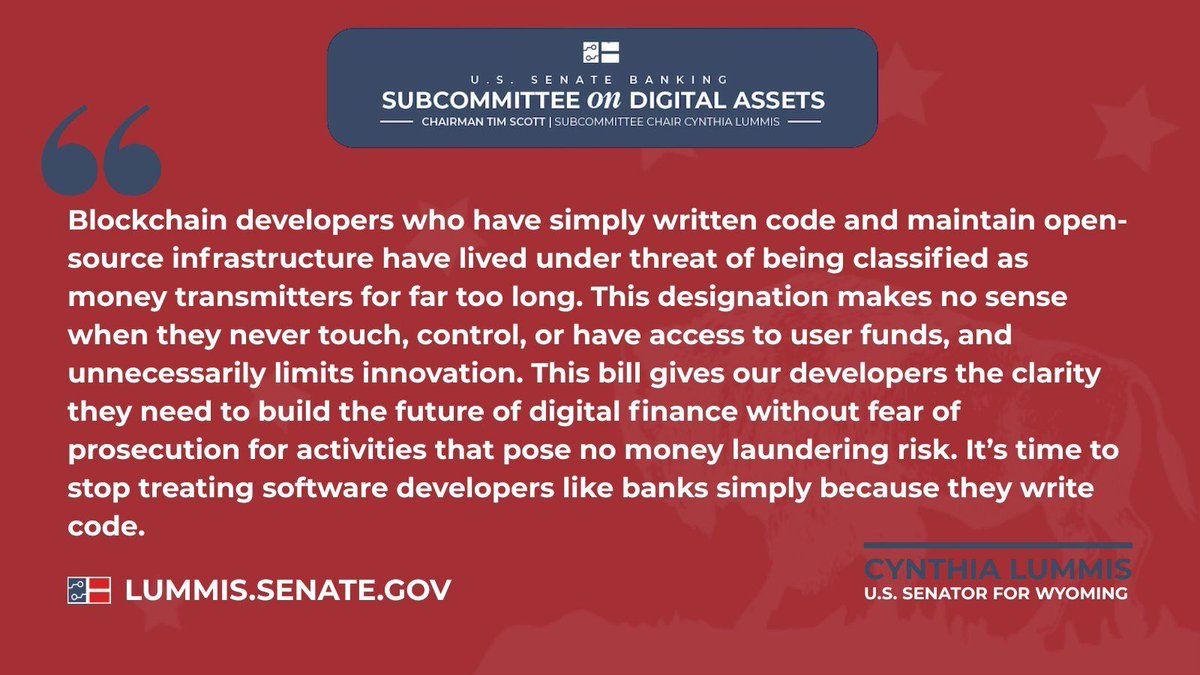
Jan 12
JUST IN: 🇺🇸 Senator Cynthia Lummis introduces a bill to protect blockchain developers from money transmitter requirements 🙌
41
99
1,042
36,025
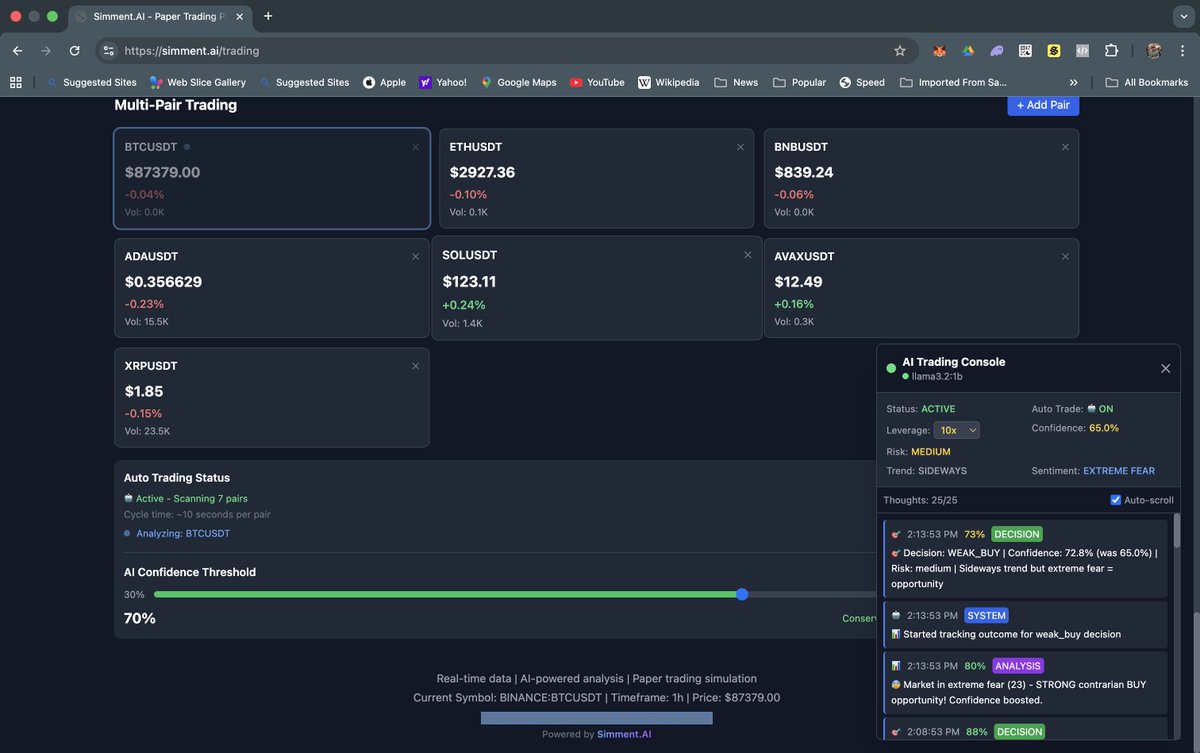
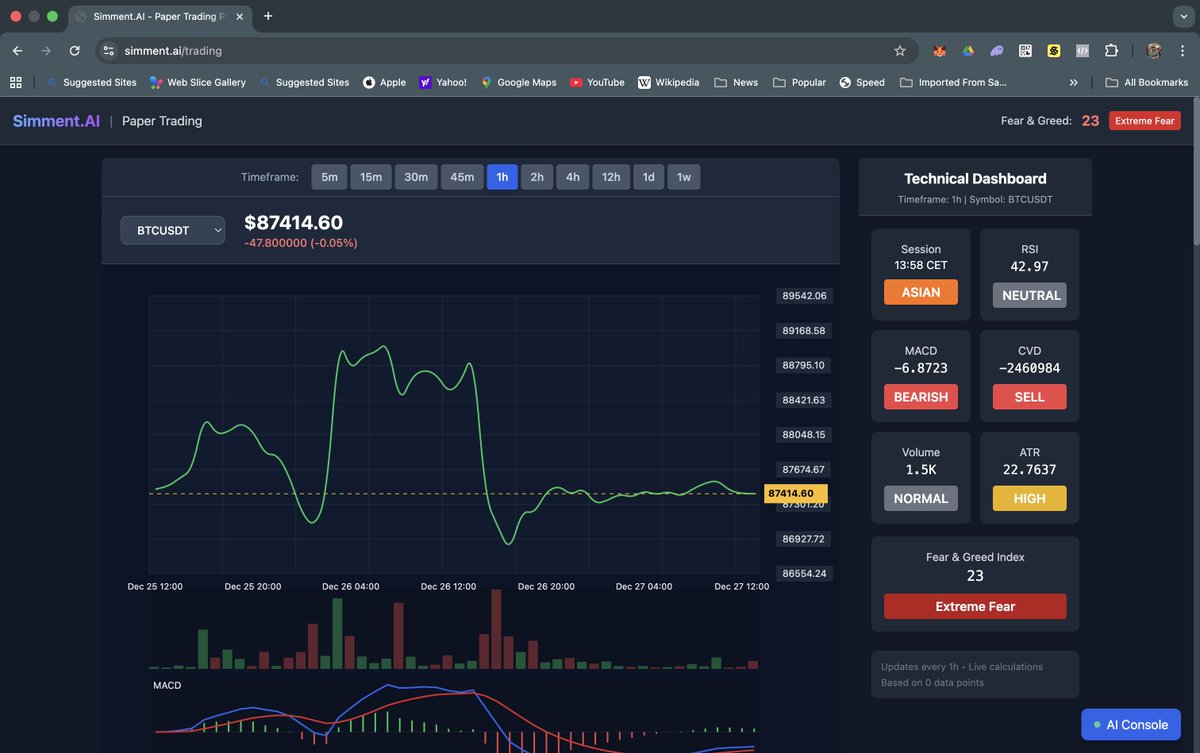
27 Dec 2025
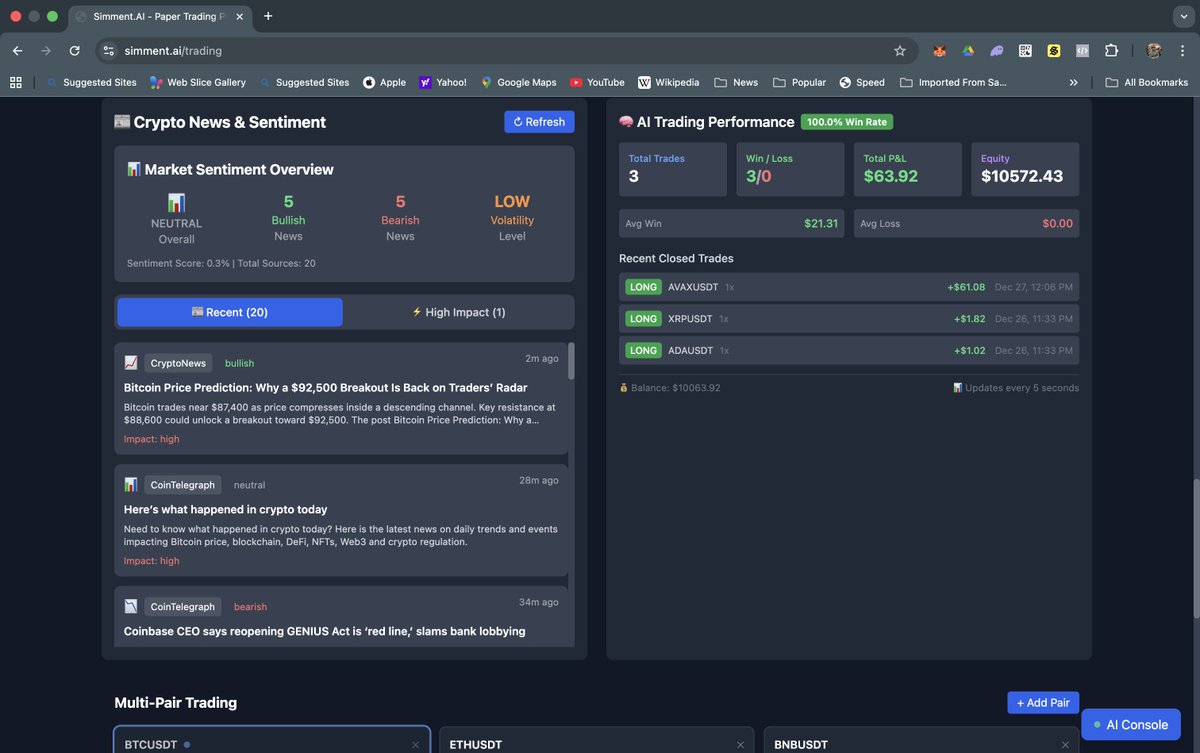
Inside the AI Trading Console
Sentiment: Extreme Fear (23)
Trend: Sideways
Risk: Medium
AI says:
“Fear doesn’t mean panic.
Sometimes, it means opportunity.”
Decision: WEAK BUY
Confidence rising.
Outcome tracking started.
This is how you learn trading psychology
without losing real money.
👉 simment.ai/trading
#AITrading #TradingPsychology #PaperTrading #Crypto
49
27 Dec 2025
The most advanced AI-powered paper trading platform.
Feel the joy of winning.
Learn the fear of losing.
Without losing real money.
That’s the most effective trading education.
👉 simment.ai
For educational purposes only. Not financial advice.
#AITrading #TradingPsychology #PaperTrading #Crypto
1
78
25 Dec 2025
Algorithmic Analysis of Bitcoin Price Action
Current Price: $87,870 (December 25, 2025)
1. Identified Algorithmic Models
Several mathematical and algorithmic frameworks explain Bitcoin’s price behavior:
A) 4-Year Halving Cycle
Bitcoin’s core algorithmic behavior stems from the halving (block reward reduction):
Halving Date | Price Before | Cycle Peak | Post-Peak Drawdown
---|---|---|---
Nov 2012 | ~$12 | $1,150 (2013) | -85%
Jul 2016 | ~$650 | $19,700 (2017) | -84%
May 2020 | ~$8,600 | $69,000 (2021) | -77%
Apr 2024 | ~$64,000 | $126,000 (Oct 2025) | Currently -30%
Pattern: After each halving, a new ATH forms within 12–18 months, followed by a 77–85% correction.
Source: ARK Invest
B) Power Law Model
Developed by Giovanni Santostasi, it shows strong fit (R² = 0.95):
Log(Price) = a × Log(Days) b
Projections:
- 2025 peak: ~$210,000–$218,000
- 2026 bottom: ~$60,000–$96,000
- 2033 target: $1,000,000
- 2045 target: $10,000,000
Source: CoinTelegraph
C) Stock-to-Flow (S2F) Model
Scarcity-based model by PlanB:
S2F Ratio = Existing Supply / Annual Production
- Gold S2F: ~65
- Bitcoin S2F (post-2024): ~120
Track record: Successful at ~$55K in 2020; missed $100K in 2022.
Source: Bitcoin Magazine Pro
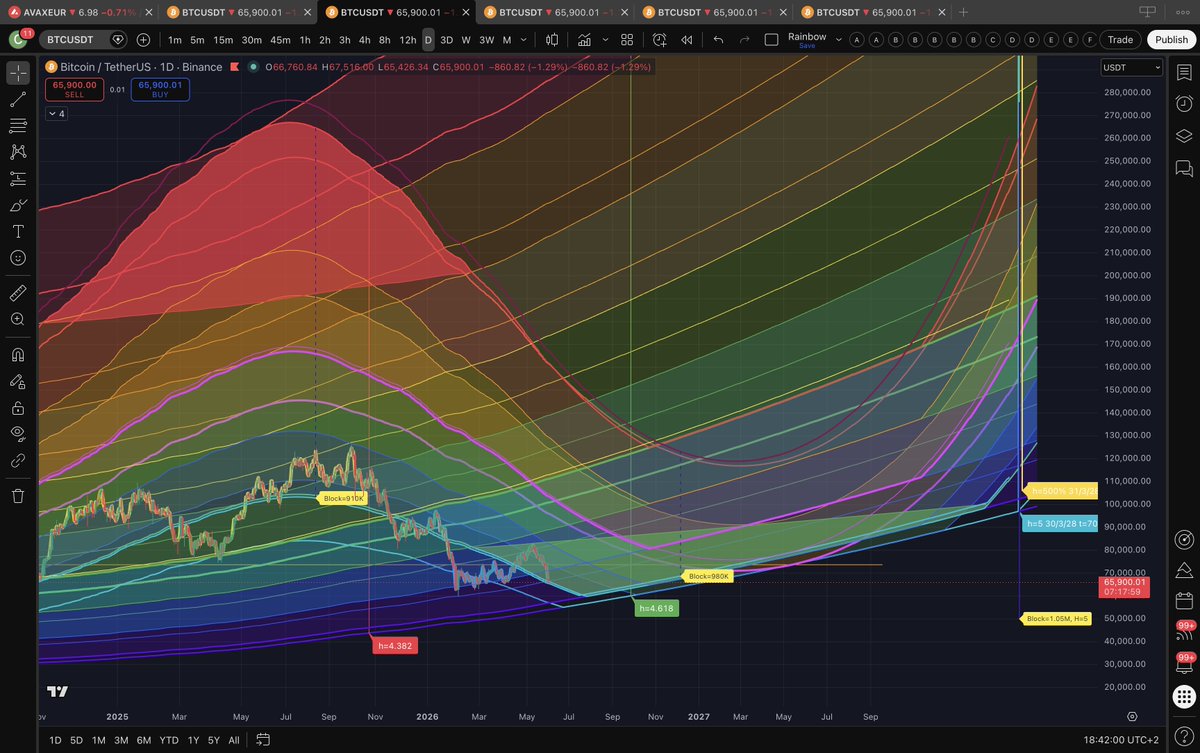
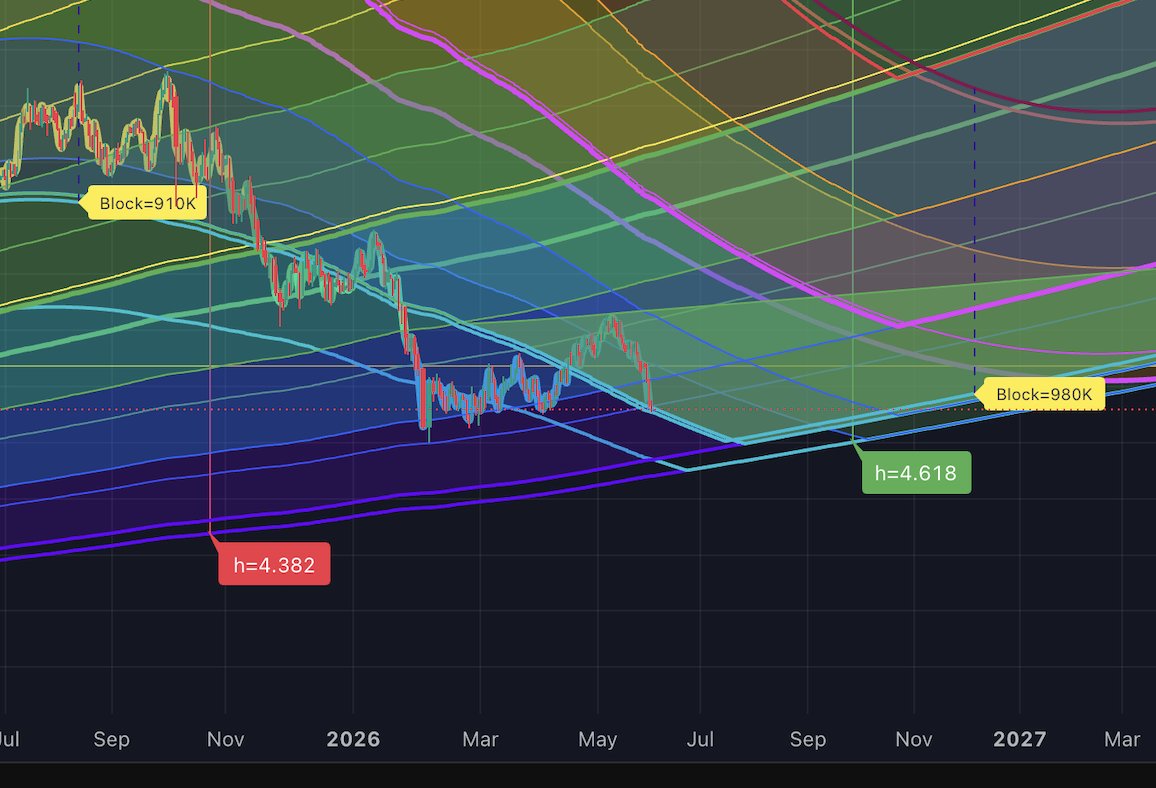
D) Rainbow Chart (Logarithmic Regression)
Valuation tool used since 2014:
Color | Interpretation | Current Position
---|---|---
Dark Blue | Extremely Cheap | –
Green | Fair Value | –
Orange | Bubble? | Current zone
Red | Maximum Bubble | –
Source: Bitbo
2. Current Timeframe Analysis (December 2025)
Cycle position:
- 20 months post-halving (April 2024)
- Cycle peak: October 2025 at $126,000
- Distribution phase likely started
Fidelity (Jurrien Timmer): 4-year cycle remains intact; 2026 may be stagnant.
Key support: $65,000–$75,000.
Market sentiment: Fear & Greed Index at 25 (extreme fear, strongly bearish).
3. Is Bitcoin Driven by Algorithmic Logic?
Yes, with limitations:
Model | Mathematical Basis | Reliability | Limitations
---|---|---|---
Halving Cycle | Bitcoin protocol (21M cap, 4-year halving) | High | ETFs may alter cycle
Power Law | Physical growth laws | Very high | ~15 years of data
S2F | Commodity scarcity theory | Medium | Ignores demand dynamics
Elliott Wave | Fractal wave theory | Low | Weak scientific foundation
4. 2025–2026 Outlook (Model-Based)
Power Law:
- Fair value: ~$86,000 (current area)
- Upper bound: ~$332,000
- Absolute floor: ~$30,000
- Cycle bottom (2026): $60,000–$96,000
4-Year Cycle:
- Peak formed October 2025 ($126K)
- Bear market likely in 2026
- Bottom expected Q4 2026–Q1 2027
- Next major peak ~2029 ($500K )
5. Conclusion
Bitcoin price action is strongly influenced by algorithmic and mathematical structures.
The halving forms the core of its cyclical behavior. The Power Law model is the most reliable, with over 95% statistical accuracy. Scarcity economics—fixed supply and long-term demand growth—remains the dominant driver.
Spot ETFs in 2024 drove an ATH before the halving for the first time, suggesting cycle evolution.
Current assessment: Power Law indicates near fair value; historical cycles suggest deeper 2026 correction, with downside risk to $60,000–$75,000.
Not financial advice. Data-driven analysis only.
1
2
8,070
Burc Unalan retweeted

18 Dec 2025
🚀 SpaceX launches by year:
2006: 1
2007: 1
2008: 2
2009: 1
2010: 2
2011: 0
2012: 2
2013: 3
2014: 6
2015: 7
2016: 9
2017: 18
2018: 21
2019: 13
2020: 27
2021: 33
2022: 61
2023: 98
2024: 133
2025: 167 as of December 18
Falcon Starship successful launches
416
483
4,818
635,208
Burc Unalan retweeted
24 Nov 2025
🇺🇸 POMPLIANO: The U.S. government will announce they are buying Bitcoin
130
252
2,603
126,467
24 Nov 2025
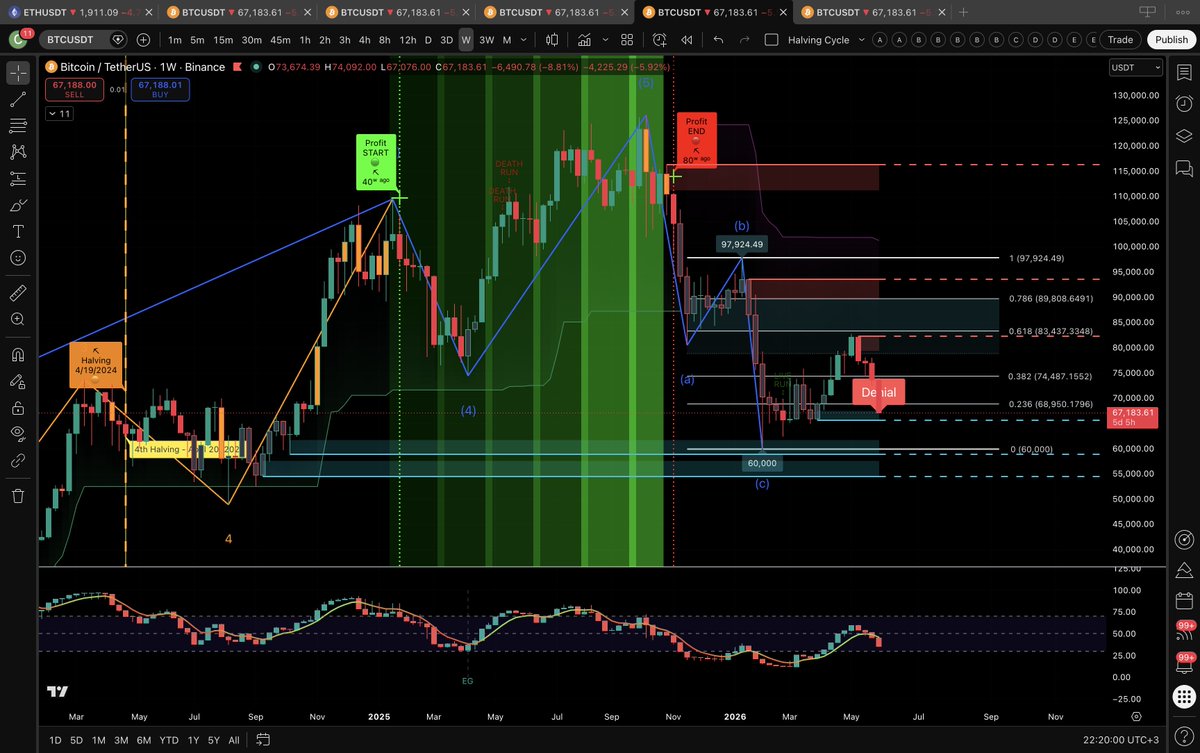
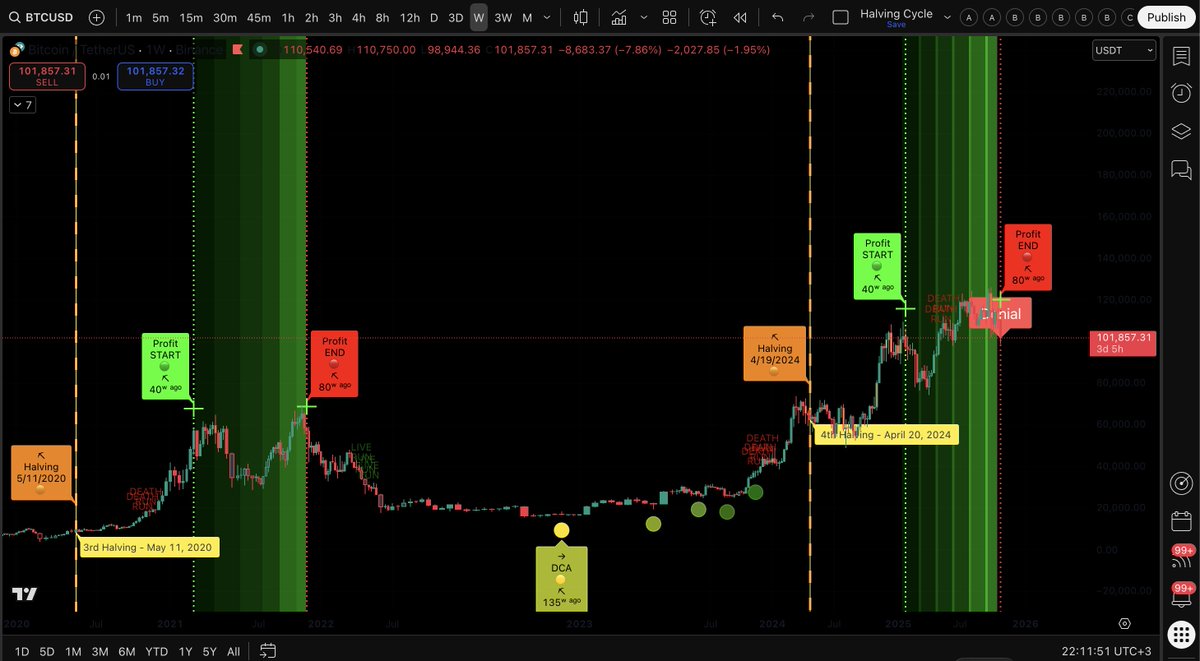
Bitcoin Cycle Roadmap Update
Capitulation confirmed at 80.6K
Relief Rally building: 86K → 92K → 98–102K
92–102K = Bull Trap / Decision Zone
C-wave liquidity flush remains possible: 74–70K
Parabolic expansion delayed to 2026
Final cycle target 180K–220K
Cycle is intact. Timing shifted.
Patience is the alpha.
1
15
29,957
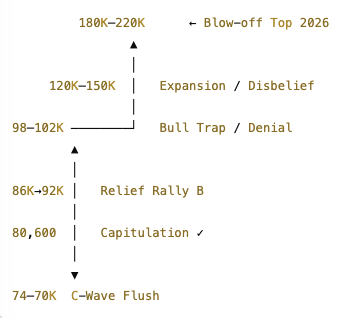
24 Nov 2025
Roadmap??
80.6K Capitulation ✓
Relief rally: 86K → 92K reject?
↓
74–70K C-wave flush (final sweep)
↑
98–102K Bull Trap / Denial
↑
120–150K Disbelief → Expansion
↑
180–220K Parabolic Top (2026)
o80.6K Capitulation ✓
44
16 Nov 2025
My indicator on Monthly chart doesn’t look great right now.
We’ve printed the first red signal on the monthly since entering 2023, the first time since the 2022 crash. Momentum has clearly cooled off.
If the bull market is real, this is the moment to reverse.
Perfect setup for a bear trap if buyers step in and continue the trend.
Let’s see if the market defends here or if deeper correction is coming.
Interesting weeks ahead.
Use my free TradingView indicators to track the trend and momentum in real-time.
Links below;
tradingview.com/script/iclDM…
tradingview.com/script/sQscQ…
#Bitcoin #BTC
1
25