
Unlocking Web3 Data Like an oil refinery for blockchain, we turn raw data into valuable, data-driven insights, helping users thrive in the Web3 economy
Joined August 2021
- Tweets 1,936
- Following 167
- Followers 5,424
- Likes 6,036
1,115 Photos and videos


Jun 8
We listened. We rebuilt.
A major ChainStats update is on the way.
Faster workflows. Cleaner data. Better insights.
This is only the beginning. 👀
#STATS #Crypto #OnChainAnalytics
4
1
10
193
May 26
Cloud costs are killing web3 projects.
We found a better way.
@ChainStatsPro x @RealityNetw0rk are going live.
We're breaking down how ChainStats optimized infrastructure, ditched heavy AWS bills, and integrated Chain-Guardians nodes for flawless data verification.
Want to know the blueprint. Set your reminder 🔔
6
8
16
967
Apr 22
From visualizing where the market is trending to crystallizing that vision… full video drops tomorrow.
Apr 22

$STATS @ChainStatsPro aims to be the accessible "Bloomberg Terminal for Web3," leveraging blockchain data for transaction analysis and providing real-time on-chain insights
Full video drops tomorrow
3
12
1,104
Apr 15
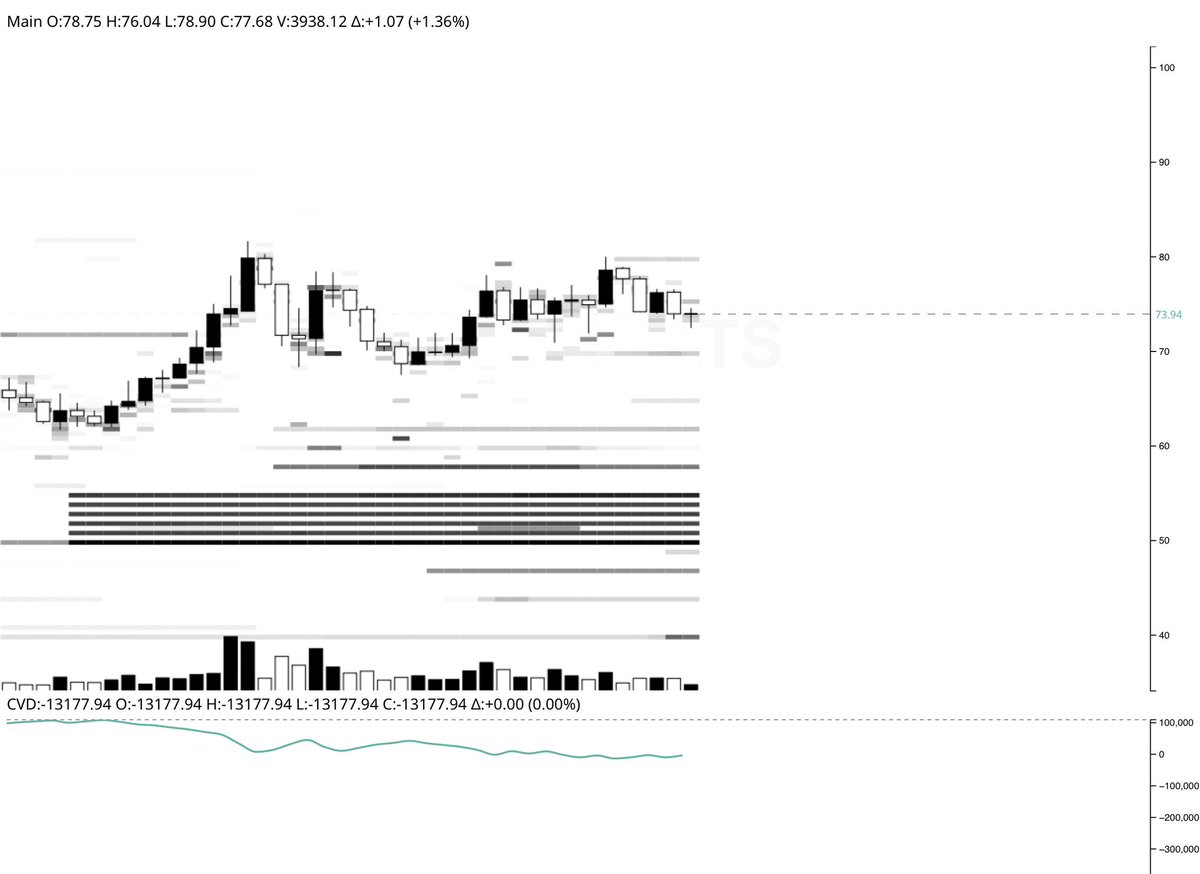
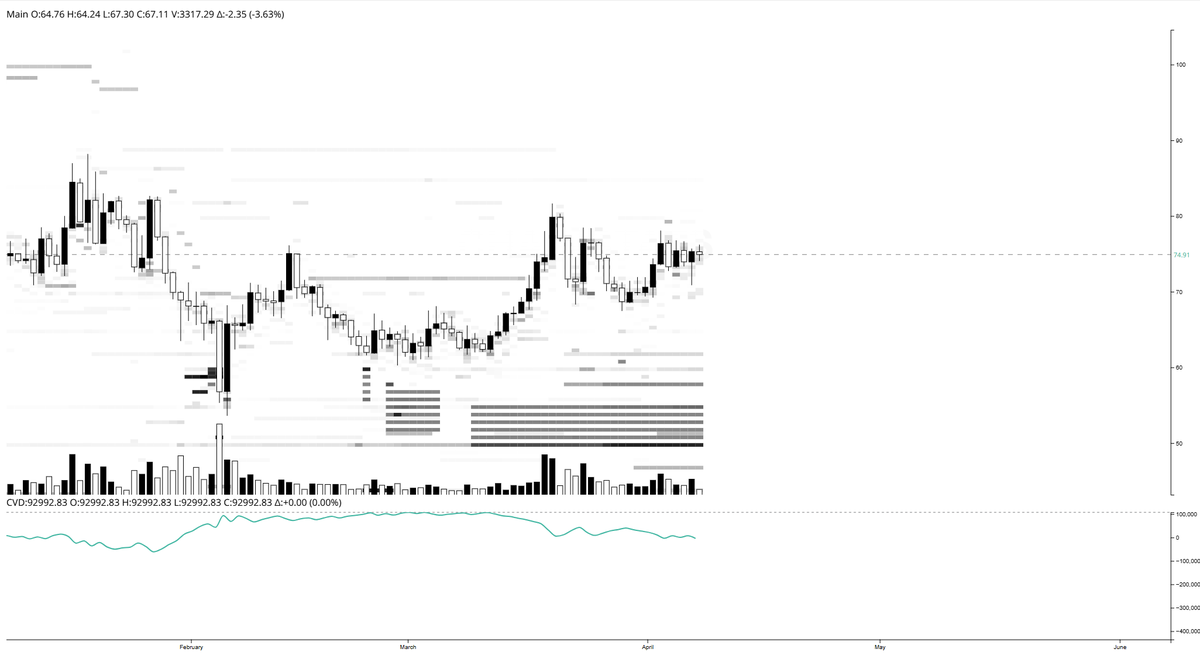
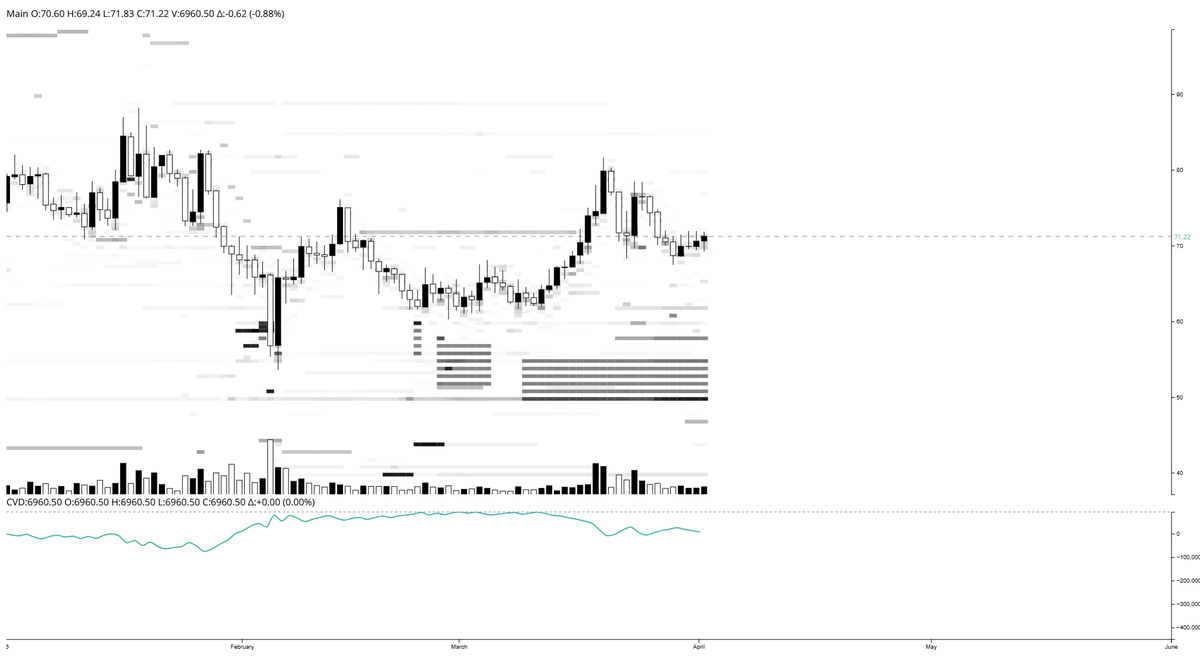
$QNT holding in a tight range this morning.
Looks like chop on the surface
but underneath it’s a clean liquidity battle.
Current Auctions
• Sellers defending 78–80
• Price struggling to accept above
• Bids present, not aggressive
CVD still flat to slightly down → buyers not stepping in with urgency
Liquidity tells the real story:
• Heavier demand sits lower, not directly under price
• Supply keeps refreshing on every push up
• Market hovering, not committing
This is compression.
Not trend. Not breakout. Just positioning.
Move comes when one side stops showing up.
Candles won’t tell you that
orderflow will
2
49
1,310
Apr 12
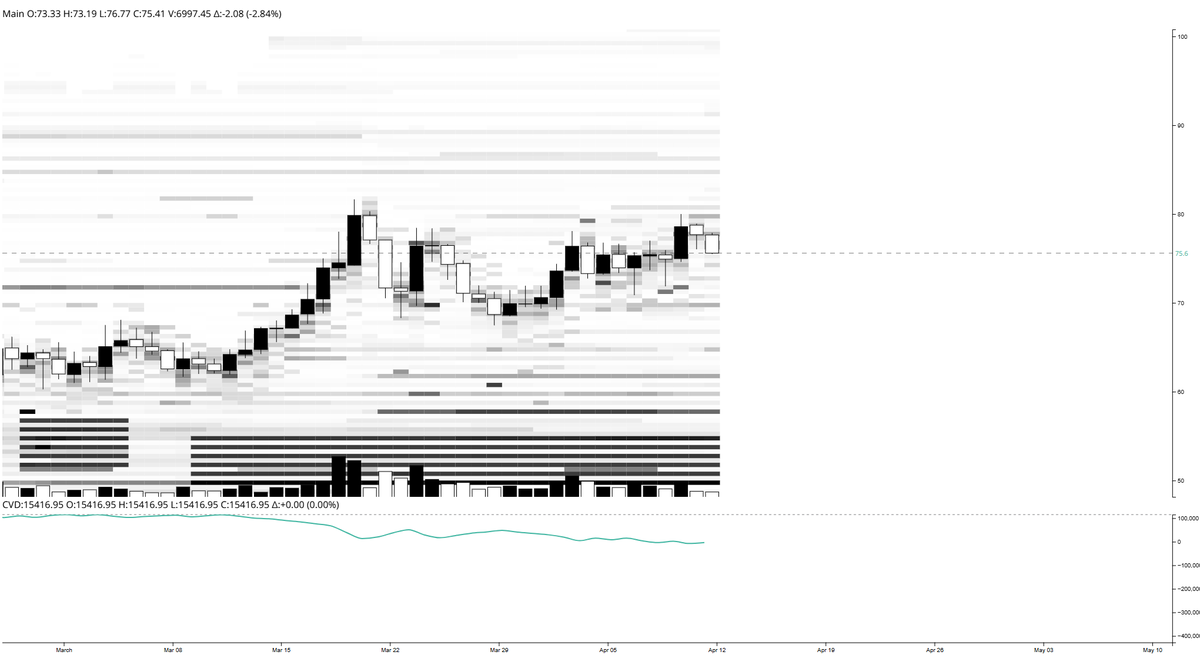
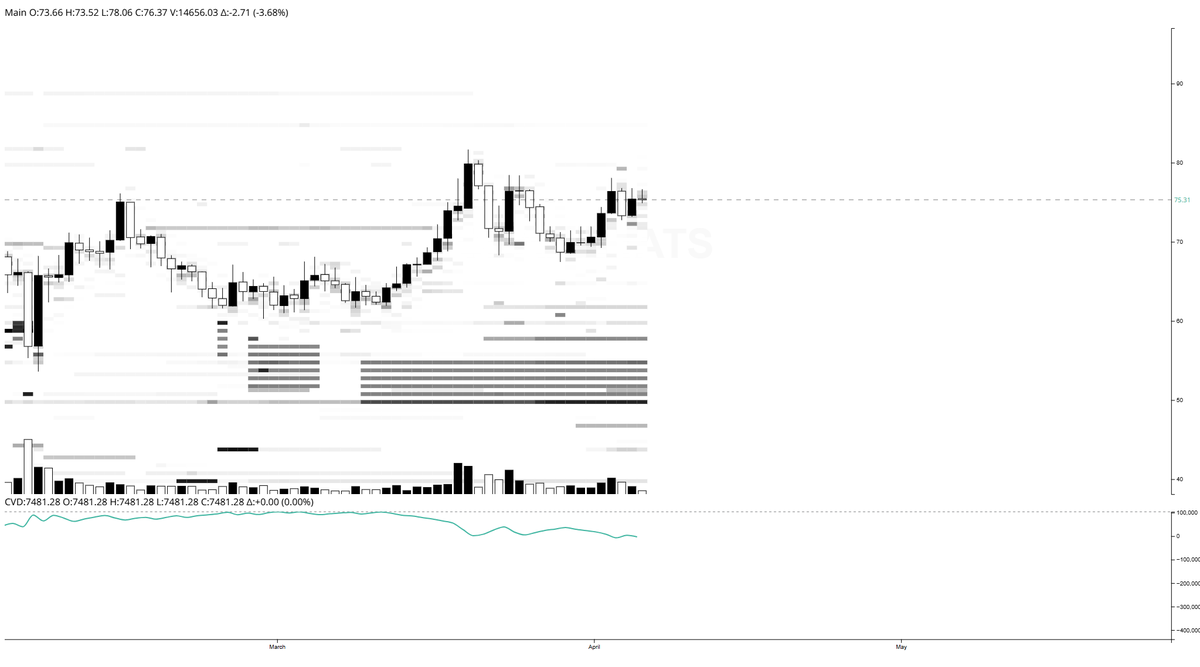
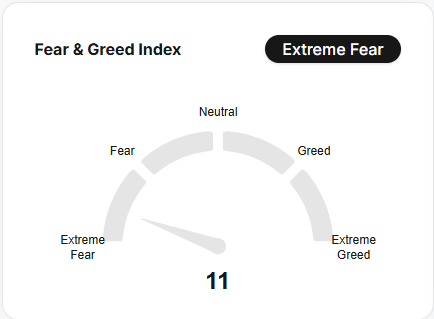
$QNT holding structure above prior expansion, but the story right now is positioning, not price.
We pushed into the mid-$70s and stalled right into visible sell-side liquidity. Since then, price is compressing while orderflow softens.
CVD trending down = passive sellers in control
Price holding steady = bids still absorbing
That’s the divergence to watch.
Current Auction
• Bids layered below in the high $60s to low $70s
• Overhead supply sitting around $76–$80
• Range tightening with lower participation
If buyers step back in and CVD flips, this range resolves higher quickly
If not, liquidity below gets tested
This is where legacy charts lag
Orderflow shows you intent before the move
Follow the liquidity, not the candles. stats.
61
1,405
Apr 9
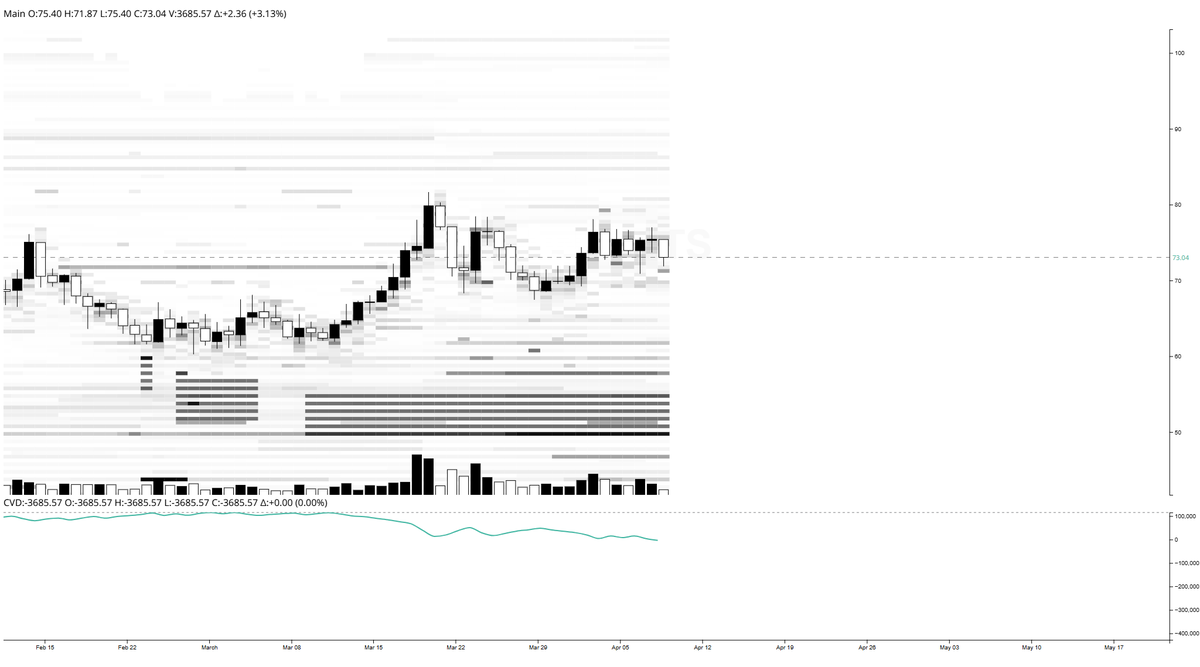
$QNT sitting right where it matters.
Price is compressing into a tight range around the low $70s while liquidity continues to stack both above and below.
What we’re seeing:
• Heavy bid support holding below price
• Clear sell side liquidity stacked overhead
• Range bound price action = market waiting for a decision
• CVD trending down → passive sellers still active
Current Auction:
Bids: $68–$70 (defensive positioning)
Asks: $75–$78 (primary resistance / liquidity target)
Right now this is a classic compression phase.
Price isn’t leading here… liquidity is.
The longer this range builds, the more fuel gets loaded for the next move. Break above that $78 supply and things can move fast. Lose the $68 bids and you’ll see where real demand actually sits.
Most people are staring at candles.
We’re watching where the market is positioned.
Signal > noise.
4
69
1,628
ChainStats retweeted
Apr 6
We’re excited to partner with @Conste11ation
A Layer 0 built for data
Not just transactions
Constellation is focused on validating and securing real world data at scale
Powering enterprise and government grade systems
We bring visibility to that data
Turning raw activity into actionable intelligence
Together, this is about one thing.
Making data usable
From infrastructure → to insight
From raw signals → to market understanding
Visibility before velocity isn’t just a tagline
It’s the direction we’re building toward
15
58
152
9,091
Apr 8
$QNT is pressing back into the mid $70s, but the bigger story is where liquidity is stacked.
We’re seeing heavier resting bids still sitting lower on the book, which suggests downside demand remains parked beneath price while upside liquidity looks thinner near current levels. That usually means this range is still searching for conviction, not resolution.
Spot CVD also isn’t screaming strength here. Price pushed, but participation looks more measured than aggressive.
Legacy charts show candles.
Orderbooks show intent.
Watch how liquidity gets repositioned around this zone. That’s where the real signal is.
1
1
62
1,781
ChainStats retweeted

Apr 6
Trendlines show cool patterns
Orderflow shows actual liquidity & depth of market
Only one is displaying where real market executions happen
And right now $QNT orderbooks show buys stacking below current prices.
This is perfectly confluent with Quant’s fundamental development.
From Dentsu Soken in Japan to GBTD & Sync Lab in UK.
And we can’t forget the advancement in ISO TC 307 standards.
Fundamentals are showing that Quant is continuing to become a preferred choice for Enterprise DLT integration.
Orderflows showing buys stacking below current prices & weak sellside liquidity.
Crypto across the market is also beginning to show some recovery.
Liking how confluences are stacking✅
Apr 6

$QNT is holding steady while liquidity builds underneath.
• Bids stacked below current price → support showing intent
• Sell side present near recent highs, but not expanding
• CVD flattening → activity cooling, not rolling over
Markets don’t move on candles
They move on positioning
Watch where liquidity sits. stats.
2
17
136
8,288
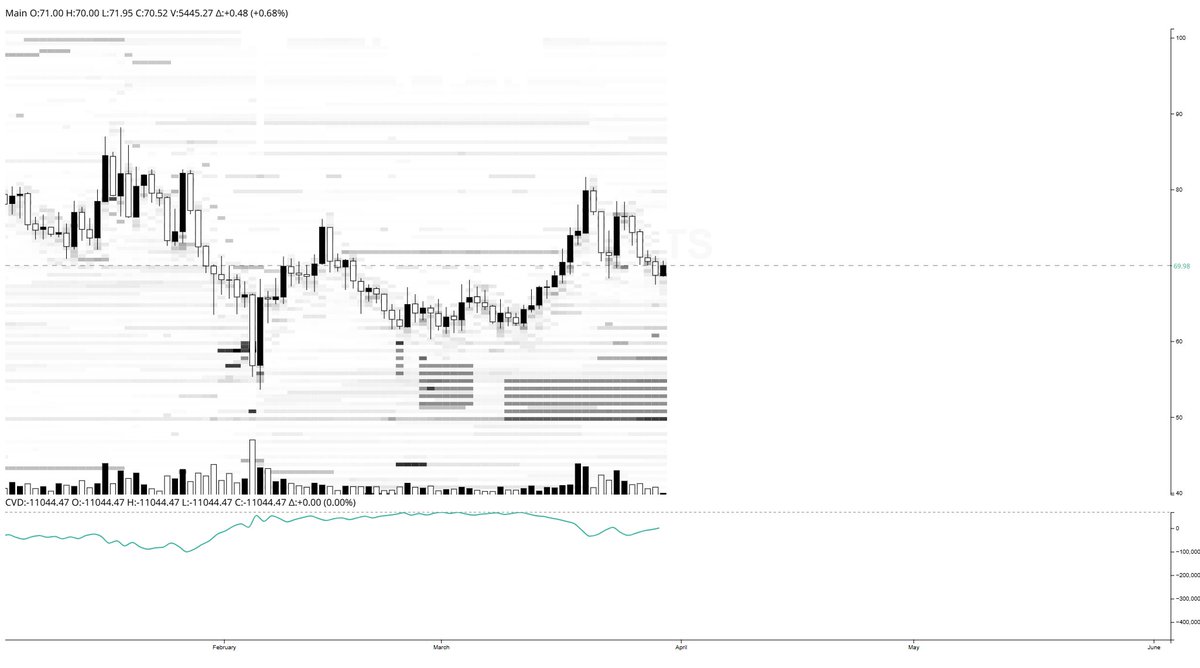
Apr 6
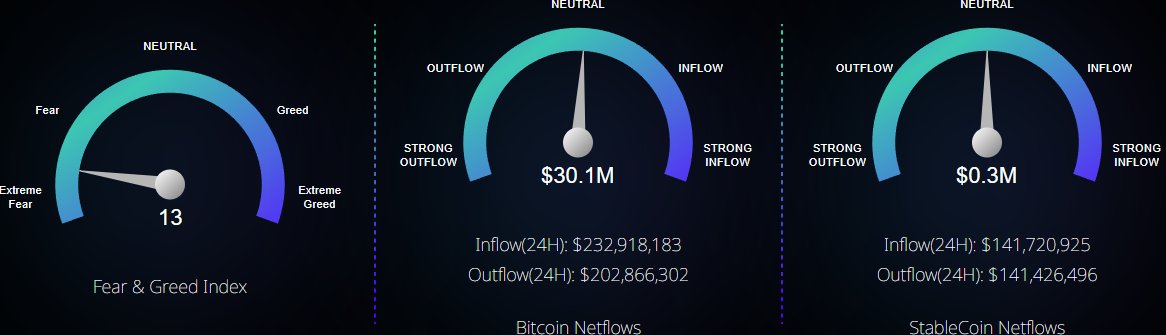
Fear & Greed Index at 13
Extreme fear is back in control
Macro uncertainty, tighter liquidity conditions, risk off sentiment
That’s the headline narrative
But headlines don’t show positioning
Data does
When fear spikes like this, participants pull back
Liquidity gets thinner, reactions get sharper
This is where orderbooks matter
Where resting bids and asks show real intent
Where liquidity maps highlight where markets are likely to move next
Add netflows into the picture
You start to see where capital is actually moving, not where sentiment says it should
Extreme fear doesn’t tell you what happens next
Positioning does
Follow the liquidity
Track the flows
That’s where the signal is
6
253
ChainStats retweeted
Mar 31
Actionable intelligence is the edge
Market intelligence means nothing until you can see how capital is actually positioning through orderflow
We turn raw data into real time insight
Where liquidity is building
Where it’s shifting
Where it’s getting taken
That’s the difference between watching price and understanding intent
Appreciate you 🤝

Data = Power
This is where actionable intelligence provides remarkable outcomes. @ChainStatsPro is proving it in real time. $STATS x $DAG
1
2
13
888
ChainStats retweeted
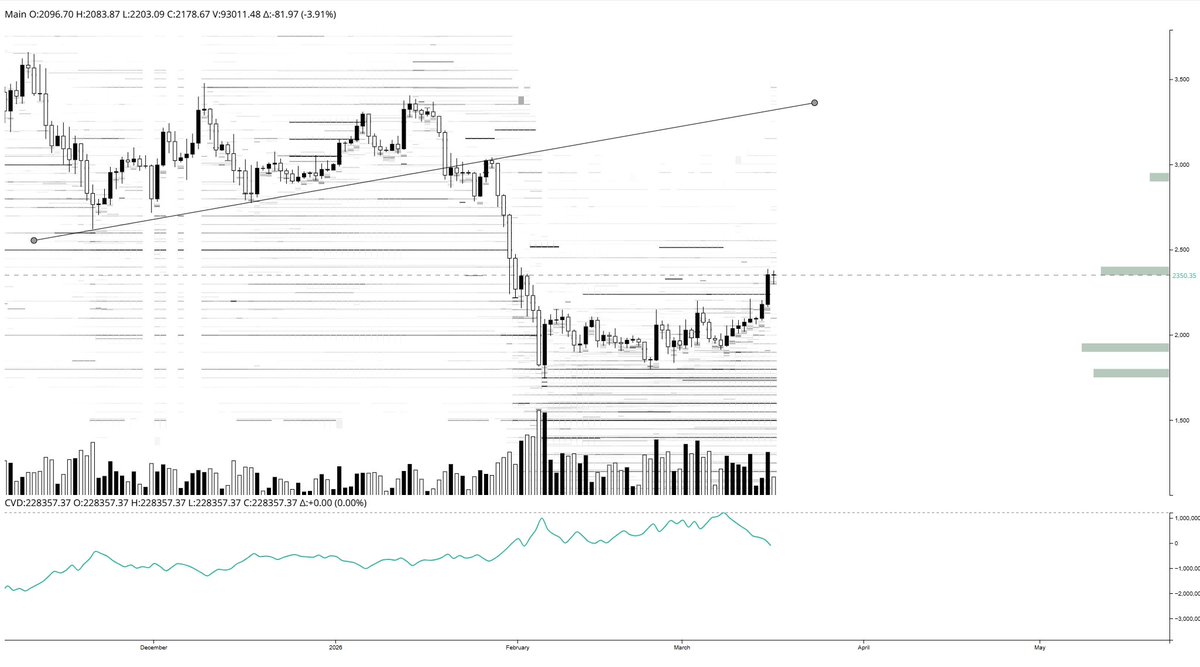
Apr 2
$QNT Market Update
Price is chopping around the low $70s, but the real story is under the surface.
Orderflow shows a clear build of resting bids below current price, with liquidity stacked in the high $60s. That’s your near-term demand zone where buyers have been willing to step in consistently.
On the flip side, sell side liquidity is still sitting overhead, capping expansion and keeping price in a range. Until that gets lifted or pulled, expect continued rotation rather than clean breakout behavior.
CVD has flattened after a recent push higher, signaling buy side momentum has cooled, not disappeared. This is typically where the market decides whether to reload or fade.
Current structure:
• Bids building below → passive demand intact
• Overhead asks → supply still present
• CVD leveling → momentum pause, not reversal
Right now this is a liquidity-driven range, not a trend.
The takeaway isn’t direction… it’s positioning.
Legacy charts show you where price has been.
Orderflow shows you where participants are positioned next.
That’s the edge.
6
61
3,032
Apr 6
$QNT is holding steady while liquidity builds underneath.
• Bids stacked below current price → support showing intent
• Sell side present near recent highs, but not expanding
• CVD flattening → activity cooling, not rolling over
Markets don’t move on candles
They move on positioning
Watch where liquidity sits. stats.
1
5
102
10,603
Apr 3
This is the direction we’re building toward.
Compute moves to the edge
closer to the people actually using the platform
We’re exploring a model where infrastructure isn’t confined to centralized servers, but can be supported by the community itself
The objective is alignment
between usage, participation, and how systems are powered at scale
ChainGuardians are expected to play a role in that evolution, with a focus on accessibility and thoughtful design
Appreciate the partnership and shared direction
more to come as we continue building
Apr 3

We’re excited to partner with @ChainStatsPro
They’re saving AWS spend by sourcing compute through their own userswith their rApp .
This is a fundamental shift in how crypto analytics infrastructure gets built.
🧵👇
ALT RealityNet and Chainstats Partnership announcement
3
6
24
2,638
ChainStats retweeted

Mar 30
People are finally waking up to what the best traders have known for years
Order books liquidation charts are far more powerful than candlesticks alone. @ChainStatsPro has been delivering these tools longer than almost anyone long before they became trendy on TikTok.
Now they’re taking it to the next level building a full @Conste11ation Metagraph that functions like a Bloomberg Terminal for crypto.
Real-time order book data, liquidation heatmaps, and on-chain metrics across multiple networks.
Want to know exactly how many active wallets are on $ICP, $QNT, $XRP, or $HBAR right now?
ChainStats can tell you in seconds.
This is what a purpose-built Metagraph looks like in action.
$STATS x $DAG
5
9
41
4,540
Mar 31
Extreme fear is back in the market.
When sentiment hits these levels, most participants are reacting… not positioning.
While headlines amplify uncertainty, liquidity quietly starts to build underneath price. Weak hands exit. Stronger players step in where conviction is highest.
This is where orderflow matters.
Not what people say
Not what price did yesterday
But where capital is actually sitting right now
Extreme fear doesn’t signal direction
It signals opportunity for those watching positioning, not emotion
We follow the liquidity
We track the intent
We stay grounded in data
Signal > noise
3
140