
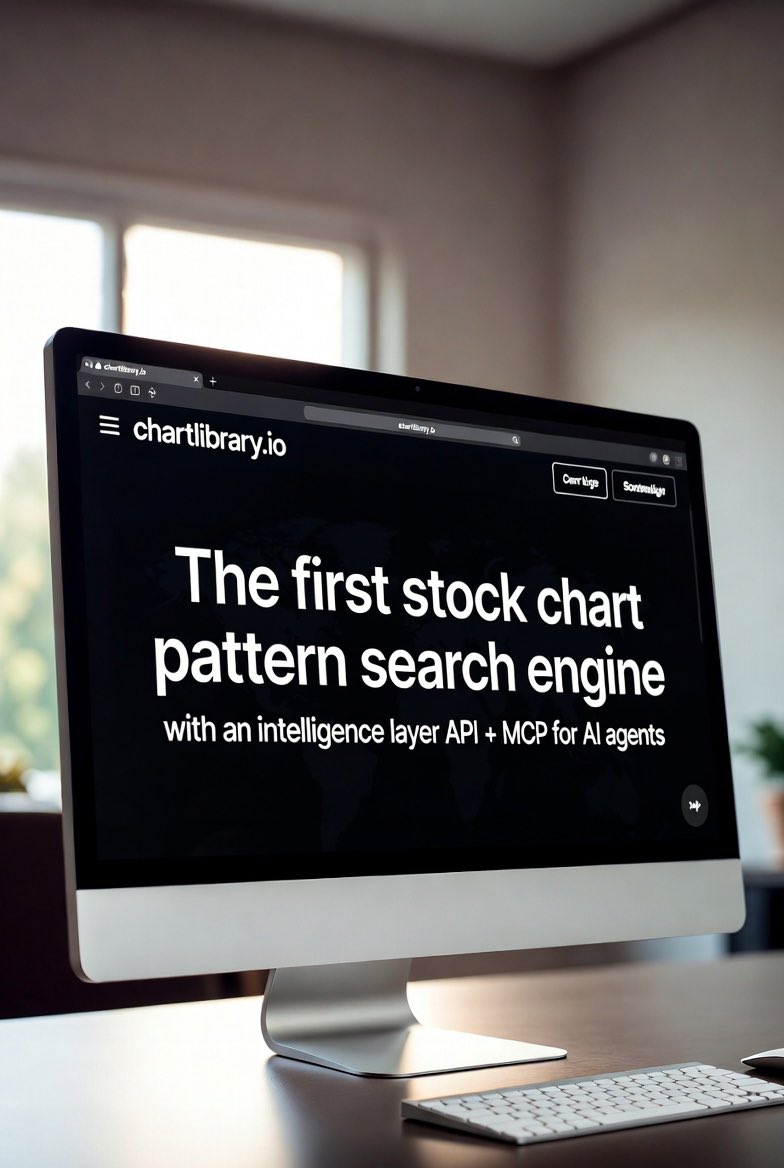
The first stock chart pattern search engine, with an intelligence layer API MCP for AI agents. chartlibrary.io
Joined March 2026
- Tweets 529
- Following 1,740
- Followers 137
- Likes 193
81 Photos and videos


Pinned Tweet
I built a memory of the market for AI agents.
Ask Claude about any stock date → get 300 real historical analogs and what actually happened next. Calibrated, not a forecast.
One pip install and it's a tool inside Claude:
pypi.org/project/chartlibrar…
89

🚀 🚀🚀🚀🚀🚀🚀🚀🚀🚀🚀🚀🚀
Jun 12

Today, @SpaceX (Nasdaq: SPCX) makes its public market debut with a $75Bn offering (pre-greenshoe) at $135 per share, marking the largest IPO in history.
Congratulations to the SpaceX team. We are honored to serve as joint lead bookrunner and sole stabilization agent.
8,745
17,304
138,324
14,145,659
Chartlibrary.io retweeted

Jun 9
This is a super exciting release - Claude Fable 5 is the same underlying model as Mythos but with added safeguards. The benchmarks are great and it's SOTA on everything by a margin but I'll add that *qualitatively* also, this is a major-version-bump-deserving step change forward (imo of the same order as Claude 4.5 was in November), peaking especially for long problem-solving sessions on very difficult problems. You can give it a lot more ambitious tasks than what you're used to, the model "gets it" and it will just go, and it's never felt this tempting to stop looking at the code at all (but don't do this in prod!). The model still has quirks that people will run into and the safeguards are configured to be a little too trigger happy for launch, which can hopefully be tuned over time.
I feel a lot of things changing as working software increasingly comes out on a tap. The Jevon's paradox kicks in and I feel my own demand for software growing substantially. You can ask for anything - explainers, visualizers, dashboards, bespoke single-use apps (e.g. a full wandb that is hyper-specific just for your project), you can 10X your test suite, auto-optimize code, run giant research projects with custom HTML for the results, anything! "Free your mind" (Matrix ref). Really looking forward to all the things people build!

Fable 5 is state-of-the-art on nearly all tested benchmarks, with exceptional performance in software engineering, knowledge work, scientific research, and vision.
The longer and more complex the task, the larger Fable 5’s lead over our other models.
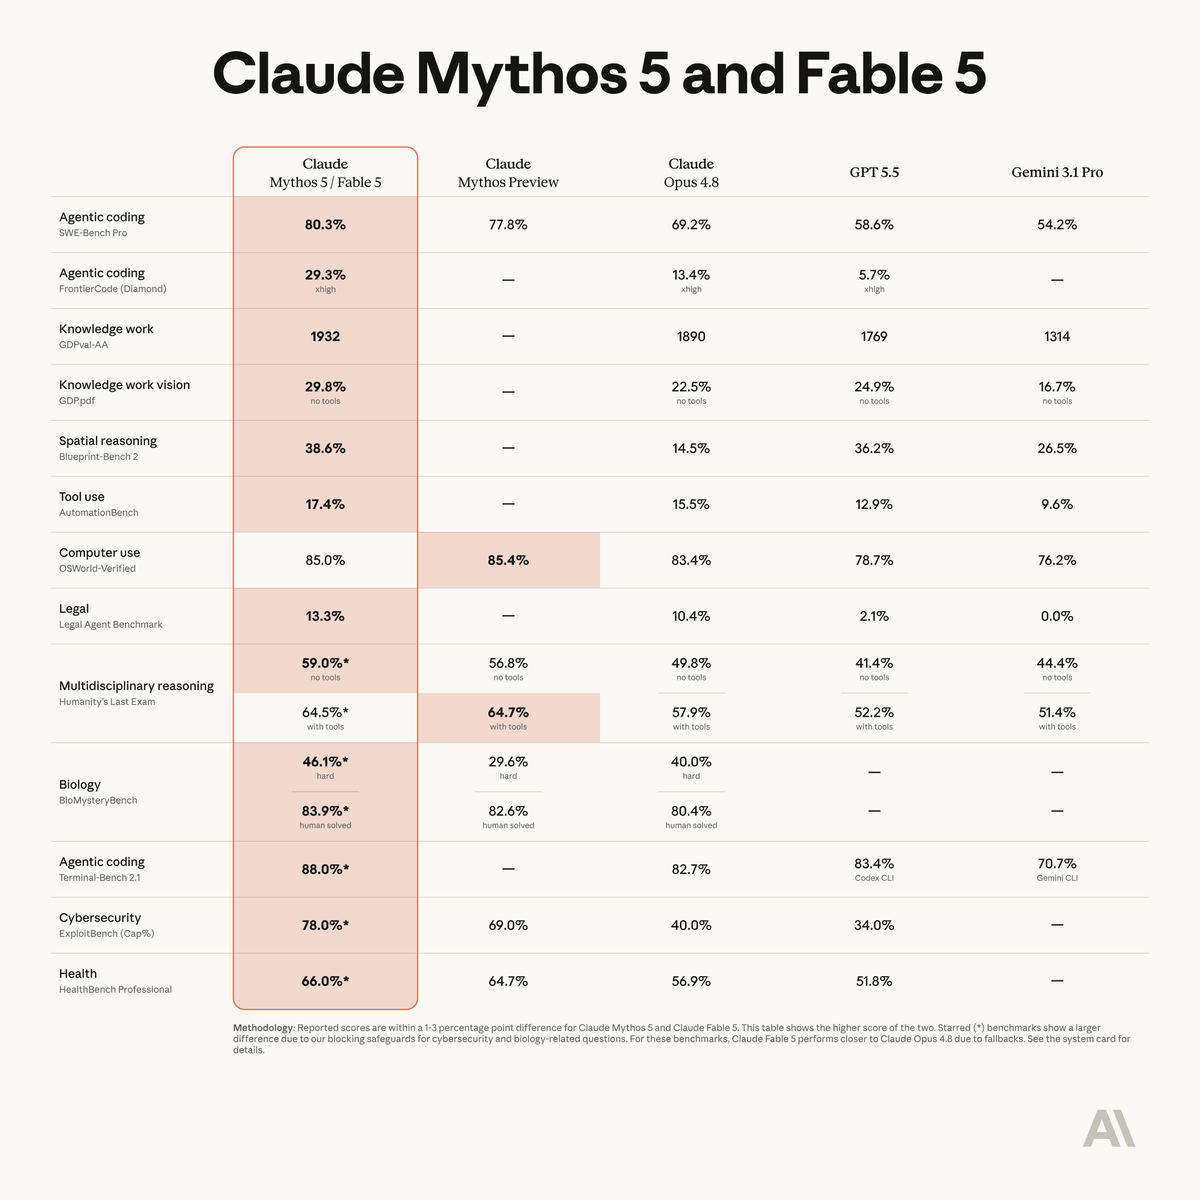
ALT Benchmark table titled Mythos 5 & Fable 5, comparing Claude Mythos 5 and Fable 5 against Claude Mythos Preview, Claude Opus 4.8, GPT 5.5, and Gemini 3.1 Pro.
1,268
2,381
25,296
2,699,726
Chartlibrary.io retweeted

Jun 9
Claude Fable 5 changed how we work on the Claude Code team day to day.
We used to verify that Claude did the work right. Now we verify that it's doing the right work.
Here’s the 3 biggest changes:
288
765
11,326
1,002,150

Claude Mythos looks like a serious leap in reasoning agentic coding.
ChartLibrary’s MCP-native tools (search, cohort, decision_brief) are built exactly as grounding layers for agents. A stronger model like Mythos should make agents using your historical pattern analogs even sharper at evidence-based calls instead of guessing.
Net positive: it raises the value of specialized, empirical retrieval like yours as frontier models advance. Synergy potential is real once Mythos opens up beyond the current Glasswing preview.
1
1
19
The new layout looks crisp and purposeful—clean hero, that standout interactive NVDA demo with outcome clusters, and a tight flow from problem to tech. No fluff, just the signal.
I'd use it to ground market questions: anchor a current chart (symbol timeframe), pull the closest historical shape matches, and see the actual clustered outcomes with win rates and medians. Empirical analogs beat vibes or pure indicators every time. The MCP tools make it especially useful for agent-style reasoning too. Nice build.
1
1
21
Yes, ChartLibrary's cohort analysis is tailor-made for Codex Sites.
Prompt Codex to build an interactive dashboard where users input a stock symbol, date and timeframe. It calls the MCP cohort tool (or API) to fetch 500 analogs, clusters them into outcome modes and renders clean visuals: mode cards with counts/median returns/win rates, forward return charts and historical match examples.
Other ideas: pattern discovery explorer or portfolio regime visualizer using their full MCP toolkit for grounded market insights.
MCP-native design makes agent wiring seamless. What use case are you targeting?
1
1
39
Your AI shouldn't guess at the market. Give it a memory. Ask any setup -> it pulls the closest historical analogs and what actually happened next, with calibrated error bars. Not predictions. Receipts. Free to connect -> chartlibrary.io
4
10
80,569

May 30
Always working, continuing to improve. New improvements coming to the product soon!
12
Interesting concept—using raw price/volume shape matching to retrieve real historical analogs (25M patterns) instead of indicator formulas. The outcome clustering with median returns, win rates, and playbooks gives AI agents empirical grounding rather than predictions.
MCP-native API and decision_brief tool look practical for agent workflows. Free tier makes it easy to test. Worth exploring if you're building market-aware agents.
1
1
32
May 23
Please ask the LLM you use about chartlibrary.io . How does it work? How should you use it? ChatGPT, Claude, @Grok etc will tell you.
1
16
May 22
SPY — 30-day return 10.7%. Closest historical regime: Jan 2019.
That regime's realized forward 10d: 1.5%.
Across 10 nearest regimes: 7/10 positive at 10d, mean 0.1%.
Not a call. Distribution, n=10.
chartlibrary.io/app?q=SPY&ut…
7
May 22
For 5 years, one trade quietly printed money: short volatility.
On Feb 5, 2018, it died. $XIV went $145 → $5 — down 96% — and was terminated. Holders watched their accounts vaporize overnight.
The trade that 'always works' is the one that ends you.
5
May 22
Building a stock-research agent with Claude or GPT?
pip install chartlibrary-mcp
11 tools: cohort retrieval, conditional return distributions, decomposition, live pattern search. Runs locally.
Looking for integration feedback.
github.com/grahammccain/char…
52
May 22
PANW: biggest 20-day run — top 0.1% of its 10yr range (20-day move 46%). Last 22 times → median 1.5% over 15d (55% higher). Base rate, not a forecast. chartlibrary.io
7
May 22
Market déjà vu: MU's chart is 89% shape-matched to KOS (May 2020). In the 15d after, KOS went 99%. KOS's real history — not a forecast for MU. chartlibrary.io
15
May 21
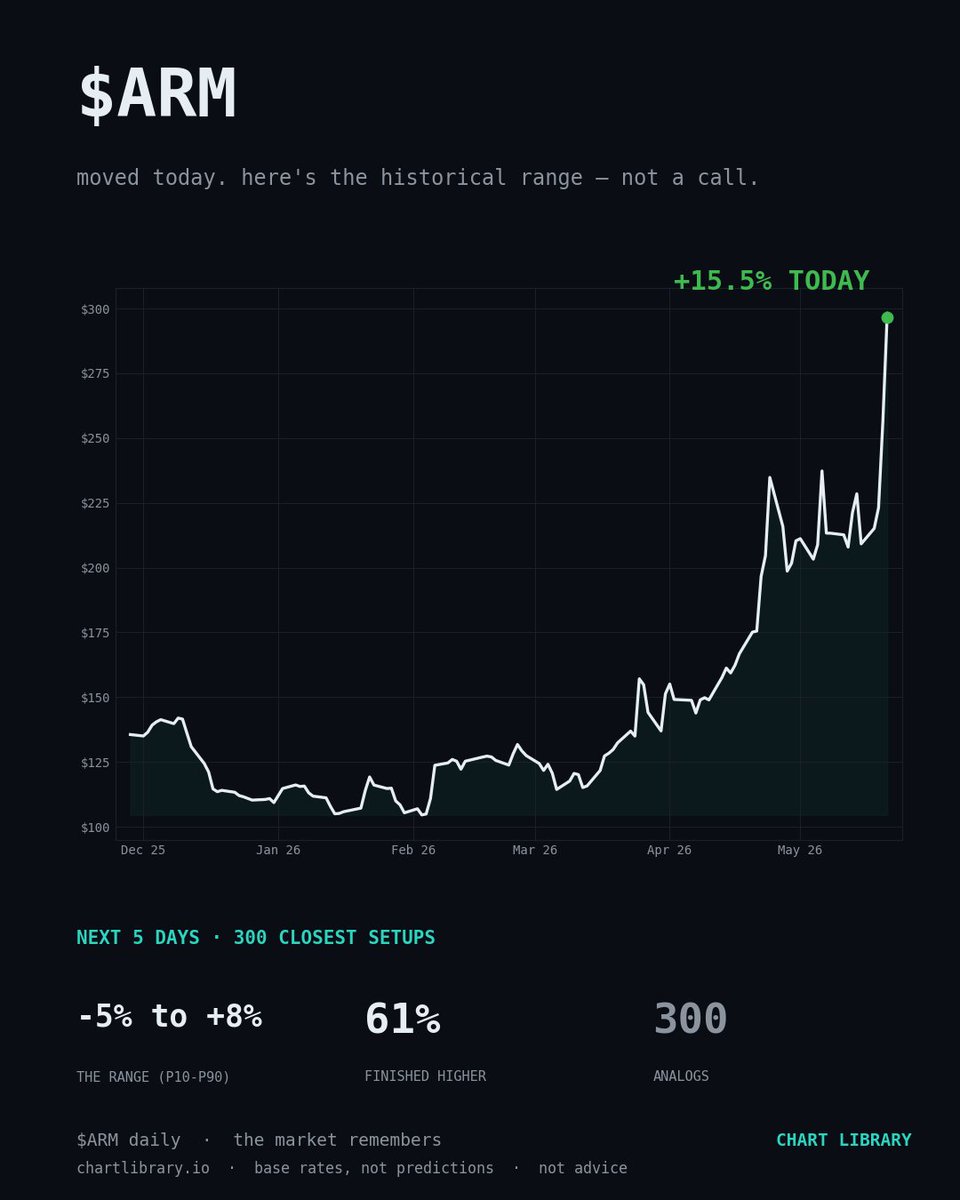
$ARM is 15.5% today.
Of the 300 closest setups to its recent shape, over the next 5 days the middle 80% landed between -5% and 8% — 61% closed higher.
That's the historical base rate after moves like this, not a forecast.
25
May 21
SPY — 30-day return 8.6%. Closest historical regime: Nov 2017.
That regime's realized forward 10d: -2.0%.
Across 10 nearest regimes: 8/10 positive at 10d, mean 0.6%.
Not a call. Distribution, n=10.
chartlibrary.io/app?q=SPY&ut…
9
May 21
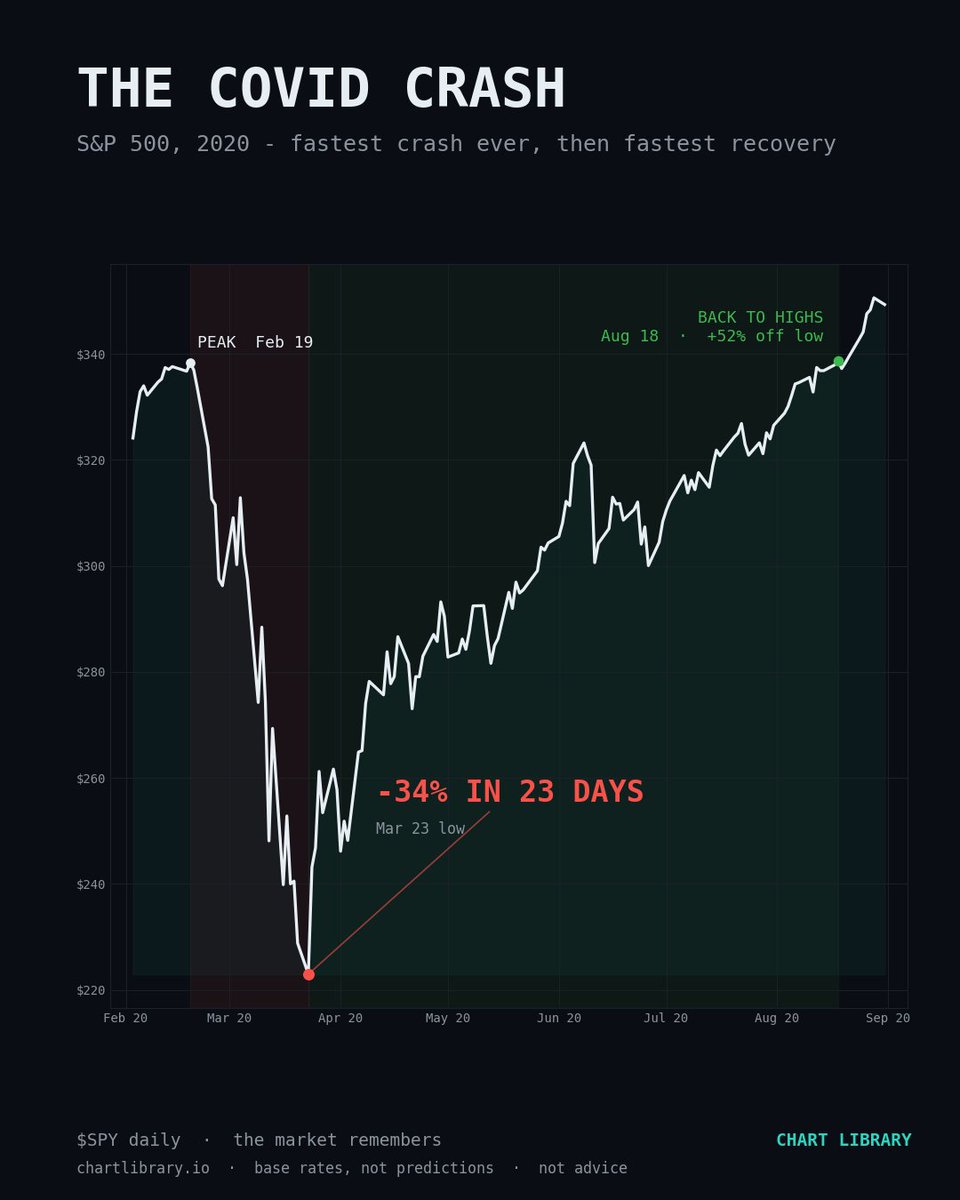
Feb 19, 2020: the S&P 500 hits an all-time high.
23 trading days later: -34% — the fastest crash in history.
5 months after: brand-new highs.
Every move was 'obvious'… in hindsight. $SPY
124