
Chartink provides India's Most Advanced Technical Scanner/Screener along with the finest Technical Charts with more than 100 technical indicators & combinations
Joined March 2017
- Tweets 674
- Following 133
- Followers 17,822
- Likes 51
90 Photos and videos


Apr 25
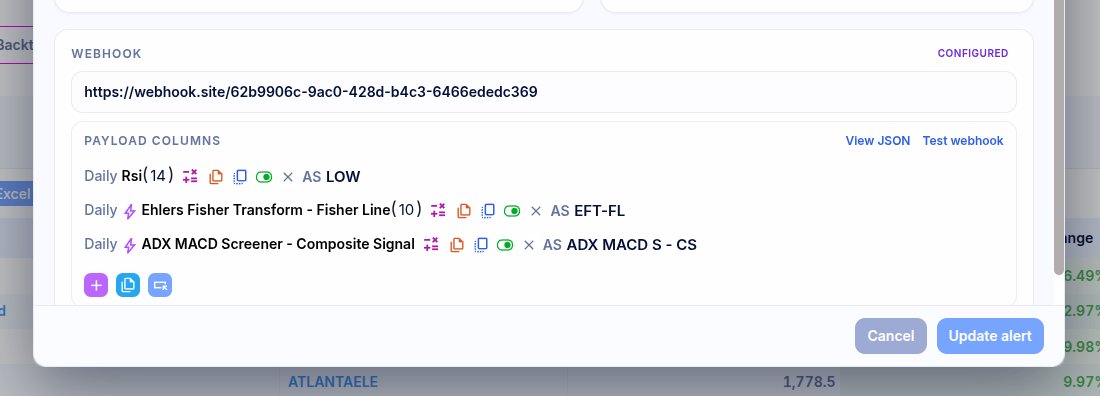
Custom columns now supported for alert webhooks. No limits.
You can now shape webhook payloads per alert, preview the exact JSON, and test the webhook before saving, without changing the scan itself.
11
16
1,986
Apr 19
New in backtesting: Stock Timeline.
See every stock’s scan history across time, spot recent triggers faster, and understand recurring setups without endless scrolling.
Watch the quick tutorial 👇
youtube.com/watch?v=8o_F9Fmn…
1
10
1,665
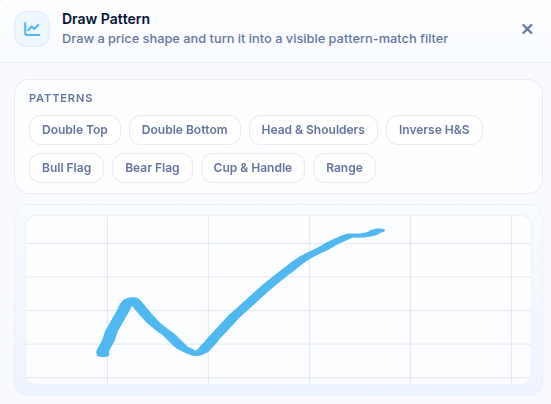
Draw it. Scan it. Reuse it. ✍️
You can now draw a pattern on the scan page and save it as a visible, editable filter — not hidden logic. It works on price, RSI, custom indicators, and more.
Your chart pattern, now instantly scannable.
chartink.com/screener/bounce…
9
8
72
22,917
Mar 18
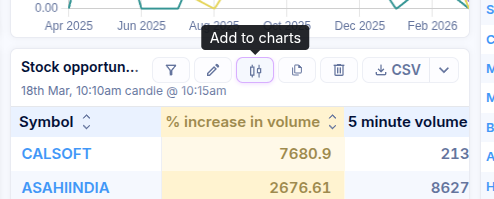
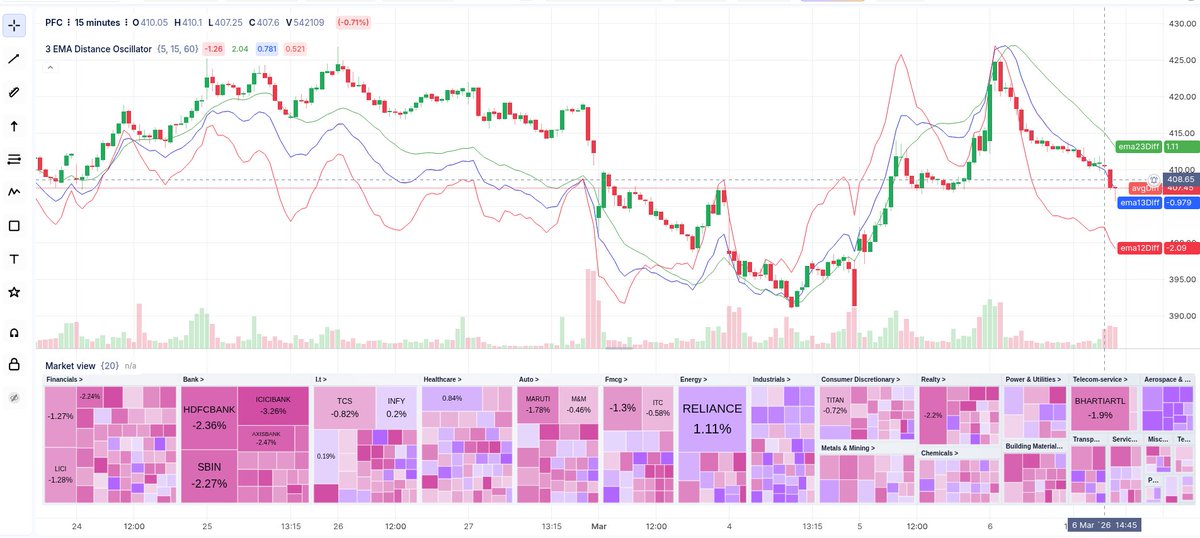
Bring your favourite widgets straight onto your charts with the new “Add to Charts” button on every widget.
Analyse, compare, and act faster by keeping all your key insights in one view.
chartink.com/dashboard/11543
3
2
40
4,116
Mar 15
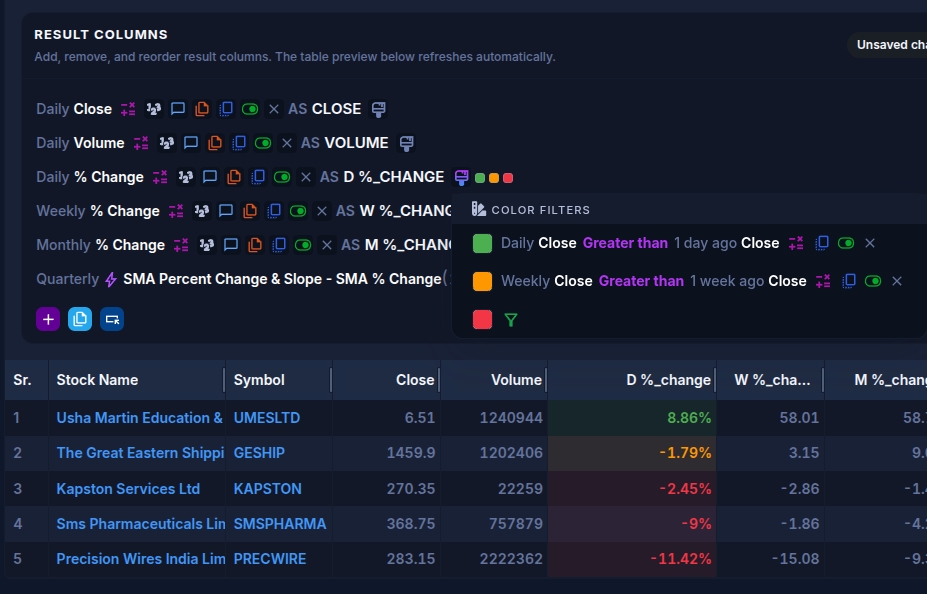
Your scan results, your way.
Customise the Columns section and its colors to highlight exactly what matters. Reorder metrics and build a results view tailored to your analysis style.
chartink.com/screener/short-…
10
8
93
7,144
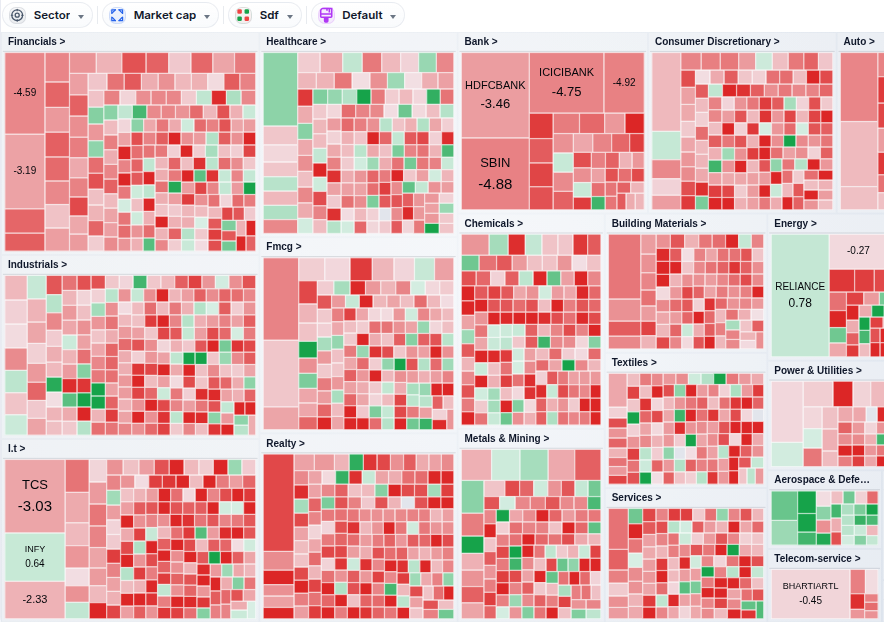
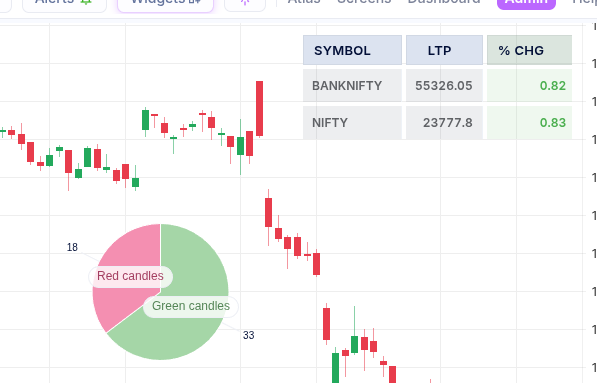
Introducing Heatmaps in atlas widgets, a powerful visual tool that displays real-time market data using color-coded tiles to represent performance. Customise tile size, color, group using metrics like market cap, % change, or any indicator!
chartink.com/dashboard/43008…
3
14
93
7,910
Feb 22
Use − × ÷ to calculate custom values, and > < ≥ ≤ to turn them into scan/widget/chart rules. Combine with AND/OR and group using ( ).
Examples: close>open, (close-open)*100/open>2 🚀🚀
youtube.com/watch?v=Tq0tCh8g…
1
5
2,707
Jan 24
Chart improvements with🔥 Laser cursor (with trails) cursor presets saved across sessions &🧩 Multi‑chart layouts drag‑to‑resize panels, chartink.com/stocks-new
3
2
33
4,310
29 Dec 2025
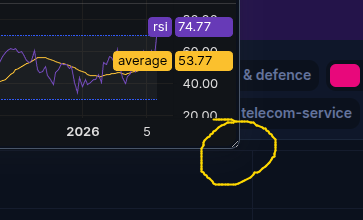
Relative strength on steroids 💪 across scans, widgets & charts 📊
Why look at a stock in isolation?
🔹 Show me stocks outperforming NIFTY's RSI
🔹 Only when NIFTY is up 1%
🔹 Nifty in uptrend for last 5 days
🔹 Banknifty MACD bullish
chartink.com/screener/rs-nif…
9
37
143
10,960
20 Dec 2025
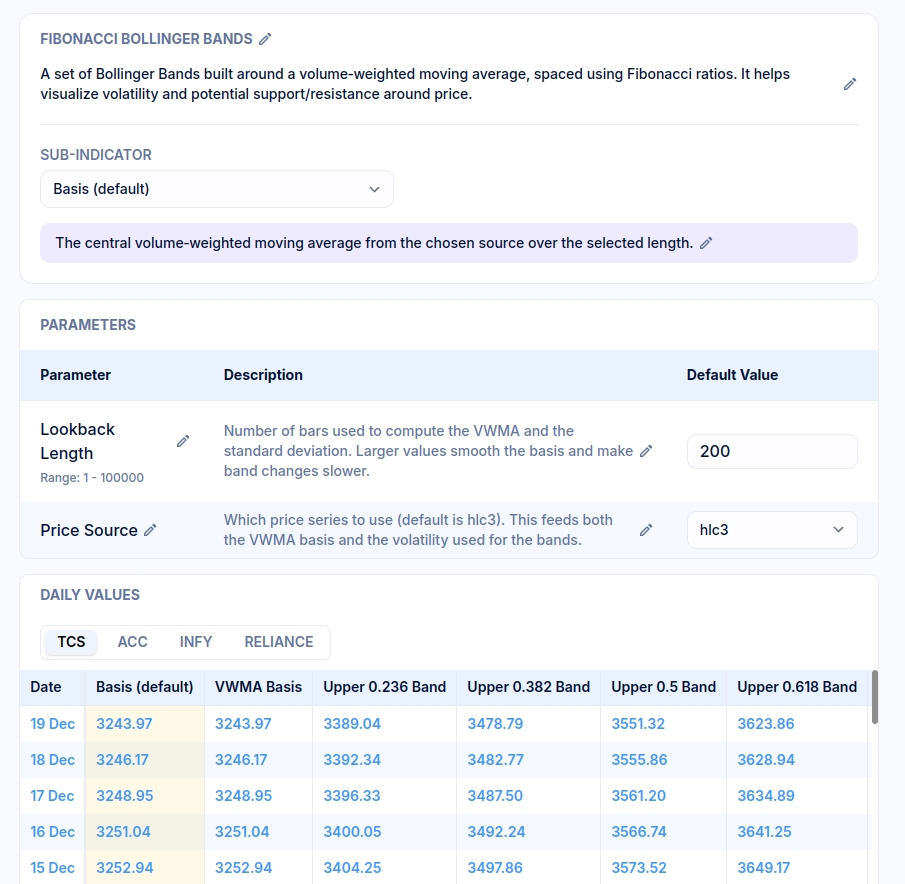
Xpress Indicators ⚡️ are here — quick demo 👇🎥
🎯 Focus on the logic, not syntax. Write rules, paste code, or upload your script to build custom indicators in minutes. Use instantly across Scans, Charts, and Widgets. 🚀
chartink.com/xpress_indicato…
3
11
2,219
20 Dec 2025
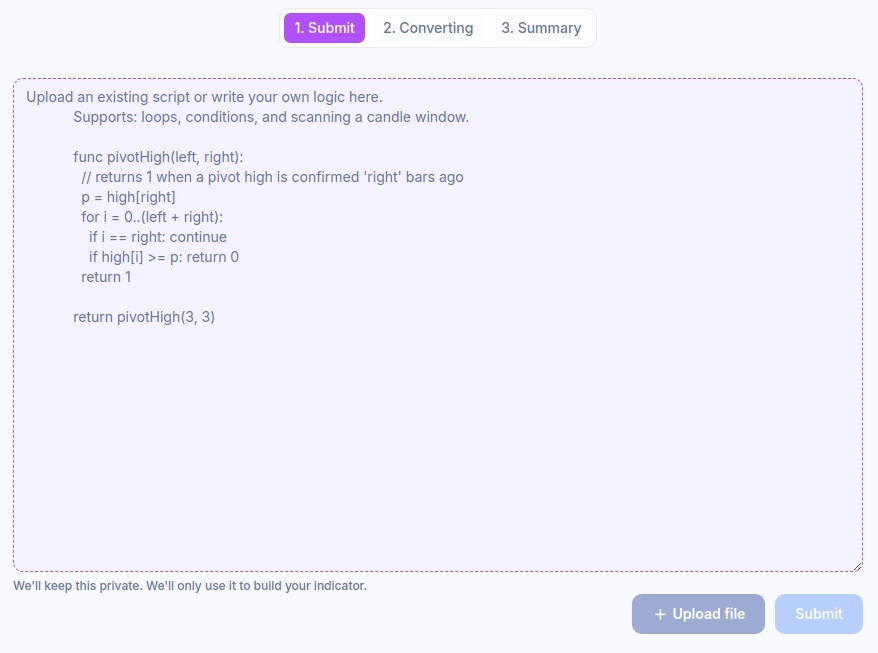
Xpress Indicators ⚡️ are here.
🎯 Focus on the logic — not syntax. Write rules, paste code, or upload your script and build custom indicators in minutes.
Use them across Scans, Charts, and Widgets. 🚀
chartink.com/xpress_indicato…
6
9
74
7,966
6 Dec 2024
Imagine the power of auto-generating scan filters through simple, natural language: “show stocks up by 2%, stocks closing in green for the last 10 days.” Embrace the ability to refine and customize these filters effortlessly, turning data into opportunity.
Magic filters are live
55
52
511
51,031
21 Nov 2024
We have introduced the ability to explain the filters used in the scan, empowering you to master the art of decoding complex scan filters as you navigate thru any scan.
28
24
225
30,773
10 Oct 2024
We're thrilled to announce that bar and line charts are now fully supported for chart previews across scans, widgets, and backtests
15
2
62
12,169
9 Oct 2024
Get ready to take your analysis to the next level with chart previews now accessible in both backtest and atlas widgets!
14
3
98
11,699
21 Sep 2024
Tackling complex scan filters? Adding comments can be a game-changer! By annotating each condition, you'll have a clear guide to how your scan operates.

17
5
97
18,648
4 Sep 2024
Now you can instantly view chart previews and efficiently debug scan filters directly within the scan results.
61
33
339
42,910
31 Aug 2024
Now save your custom chart indicators across multiple chart templates and effortlessly apply them across all your devices.
1
4
25
7,581
20 Nov 2023
We are facing a connectivity issue from the NSE, the exchange is working on it
9
33
17,615
20 Nov 2023
The exchange has resolved the issue since 9:55am
2
1
14
14,819