
Joined November 2016
- Tweets 1,225
- Following 566
- Followers 12,193
- Likes 2,251
196 Photos and videos


Vishwas retweeted

Jun 12
Two things I love about agent-native analytics, and I think they get right way more than Grafana ever has:
1: The first is that it ships with an actual super-rich dashboard that doesn't require any configuration on the user's side. You get basically a full Prometheus node exporter dashboard AND application analytics right out of the box.
In fact, it's the first thing that opens when you first open the application, and that's just fantastic.
2: The second thing that I really love, and this is the more important one, is that agent-native analytics is exactly what it says. On an architectural and fundamental level, it integrates AI into the software in a way the Grafana assistant never could. So you can do things with it, like not only introspect into dashboards and help it analyze situations like, "Why is this P95 like this?"
But you can also just prompt it to add new dashboards or modify any panels or dashboards in any way you want, just by writing a prompt in the sidebar. That's huge.
I made a video walking through it all here:
1
5
7
2,310
Vishwas retweeted
Jun 9
Grafana bolted AI on and raised prices.
I built an agent-native analytics tool that skips the middleman entirely.
Here's what that actually looks like 👇
2
5
7
3,396
Vishwas retweeted

If we want agents to actually be useful, we can't just throw prompts at them.
We spent a decade perfecting Developer Experience (DX) for humans.
Now we need Agent Experience (AX) for AI.
Here's my thoughts on what good AX looks like.
builder.io/blog/agent-experi…
2
3
4
1,596
Vishwas retweeted

Jun 2
Commentary is one of the most important pillars of X. And sometimes the best way to share your thoughts is with video.
Today we're launching a whole new way to make them:
React with Video
Tap the repost button and start recording with green screen, split screen, or picture-in-picture.
Now available on iOS
3,608
1,600
13,756
8,032,987
Vishwas retweeted
AI code assistants were supposed to save time.
But I'm spending most of my day babysitting AI slop, either from the tools I'm using or the PRs from teammates.
I'm not really able to use my good taste as a developer and architect things. I'm stuck reviewing PRs.
And AI PRs suck. They're monster, multi-file diffs that miss internal design tokens, duplicate existing utils, and ignore repo patterns. And, increasingly, they're coming to me with basically zero context.
The bottleneck, daily, is how fast we can safely review and merge code. Not how fast we can write it.
I wrote about why our dev pipelines suck right now, and how we can actually fix it.
builder.io/blog/developers-d…
1
6
17
2,637
Vishwas retweeted
6
16
3,902
Vishwas retweeted
6
27
6,378
Vishwas retweeted

May 17
why agents need UIs (and how to give it to them)
9
12
172
19,233

May 8
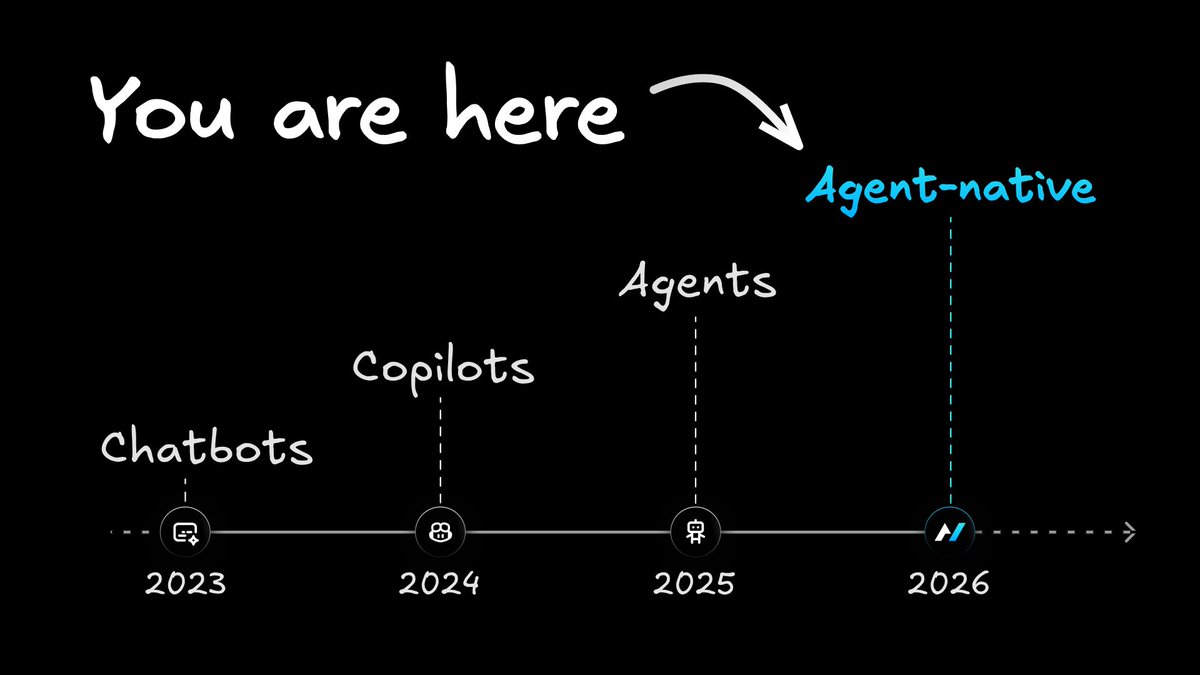
What comes after SaaS with AI bolted on?
Agent-native software.
builder.io/blog/agent-native…
3
5
56
7,707
Vishwas retweeted
5
12
3,166
Vishwas retweeted
Apr 30
Announcing the Builder Review Agent: in-browser testing of every PR
Stop shipping broken code. Let agents verify every change actually works.
• Clicks, types, and navigates
• Covers critical flows, edge cases, regressions
• Hands you findings, repros, & one-click fixes
70
253
3,743
22,030,390
Vishwas retweeted
3
15
5,671
Vishwas retweeted
Apr 27
4
10
133
13,585
Vishwas retweeted
Apr 24
Windsurf timeline:
April 2025: Rebrand from Codeium
Mid-2025: OpenAI offers $3B. Microsoft kills it.
July 2025: Google takes the founders for $2.4B
Late 2025: Cognition buys the leftovers for $250M
March 2026: Price up, quotas down
The founders are gone. The product changed hands. The price went up.
Here's what to use instead ↓

10
7
53
21,772
Vishwas retweeted
2
4
12
3,389
Vishwas retweeted
Designers keep getting told to just use Claude Code for everything, but where do you even start?
Dealing with local setup, approvals, previews, and Git is all pretty daunting. Plus, it's tough to know whether all that learning is actually going to be worth the investment once you have it working.
Here's where I think Claude Code actually helps designers, where it gets annoying, and how to get it up and running.
builder.io/blog/claude-code-…
2
7
3,424
Vishwas retweeted
Apr 20
how to build agent-native apps (and what to avoid)
8
25
515
29,035