
Proud European. 🇪🇺 Interested in politics & finances. I share information, that may be valuable to you, or just piss you off. Welcome to my profile 🤗
Joined December 2020
- Tweets 10,329
- Following 448
- Followers 414
- Likes 30,874
60 Photos and videos


Pinned Tweet

29 Oct 2025
$SPX – Divergence playbook repeating?
Each time the MACD hits its trend top, the index keeps pushing another 14–17% higher before divergence plays out.
We’re here again.
If history rhymes → $SPX ≈ 7900 before momentum fades? tradingview.com/x/20vGRp1E/
4
11
937
Freeman retweeted
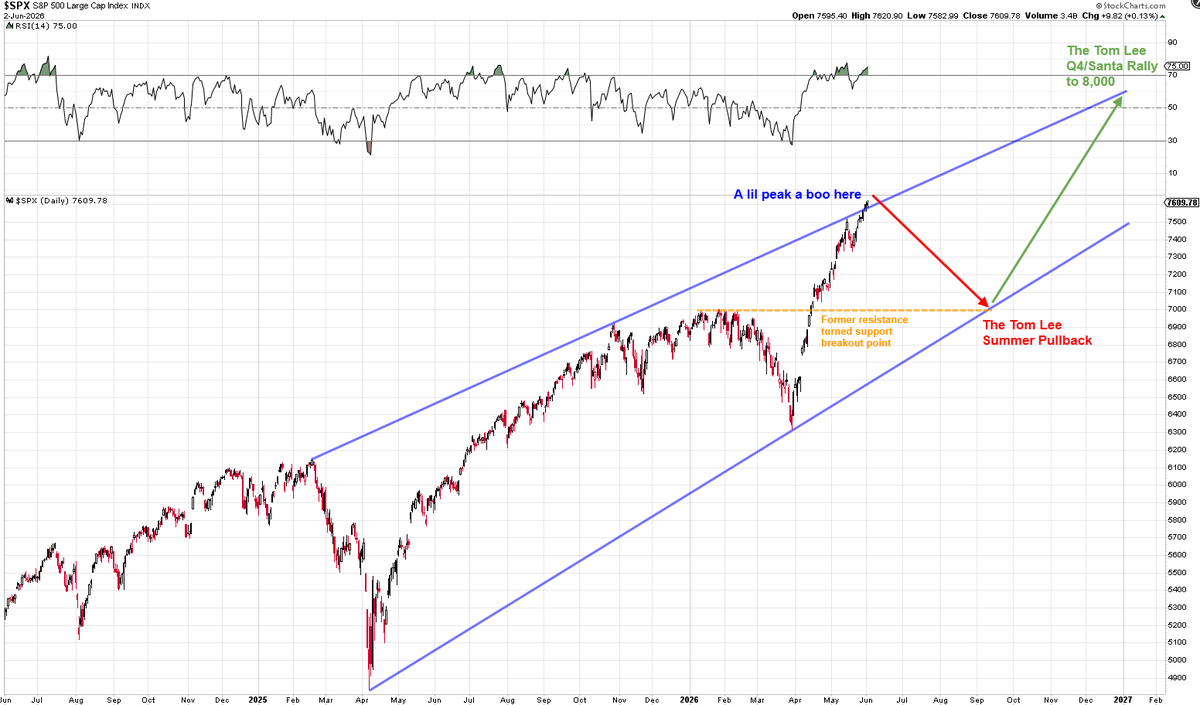
Yes, I can see the SPX even slightly undercutting 7k this summer before a run up towards new ATH takes part. Imo, 8k around end of November.
1
1
1
43
Jun 11
Anthropic planning to go public on October 23rd 2026, OpenAI one month later on November 27th 2026. No way the SPX isn't at new ATH around 8k and beyond inQ4? It has to be!
1
1
33
Freeman retweeted

Jun 10
I'll buy Space X after 12 months.

456
1,008
12,344
1,738,789
Jun 4
I'd lean towards BTC & Crypto may catch a bid. As long as there is sideways action or only a mild correction (~5%) is taking place in equities. Liquidity carousel...
Jun 2

Imo is the weakness of BTC directly correlated to the strength of TradFi. Meaning, liquidity is sucked out of it. The main question remains imo, what if TradFi corrects? Liquidity back into a high risk asset? Or the rather expectable further decline? A little bit tricky 🧐
1
1
60
Jun 10
Playing out at the moment. But let's not forget, Crypto already shat the bed.
10
Jun 10
Looking at the sentiment around the SpaceX IPO, I doubt that it will be a success. I doubt, that it will be easy to digest for the markets short term. Maybe it's a bad precursor for the upcoming IPOs of Open AI and Anthropic? Interesting week ahead.
1
1
34
Freeman retweeted

Jun 8
Clean the double low out on ES and then long at market for all time highs.

21
9
249
34,861
Freeman retweeted

Jun 9
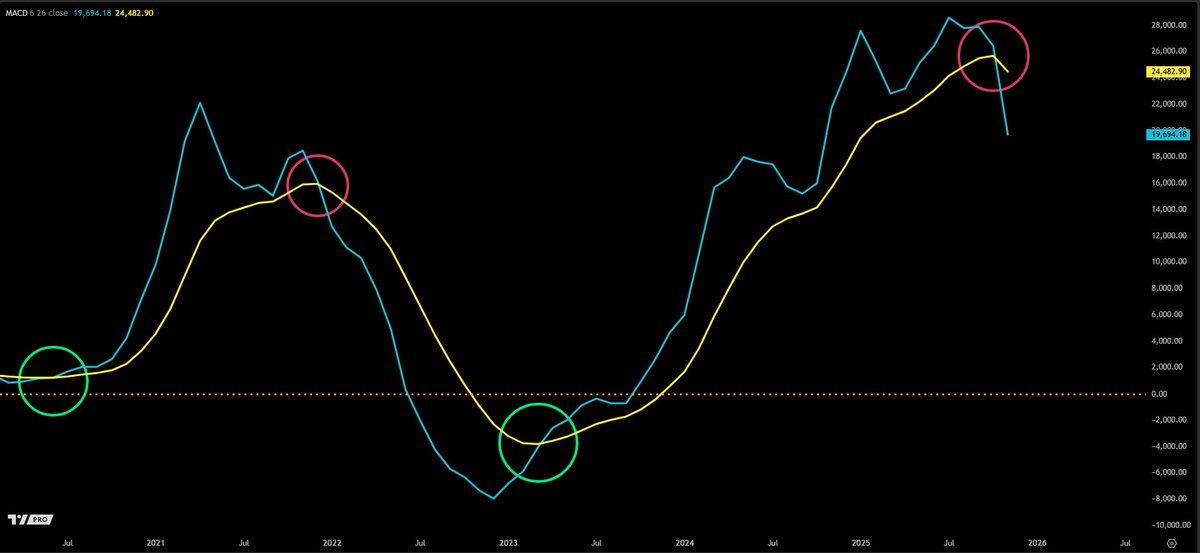
$BTC bearish crossover on the MACD (blue line) monthly chart has now crossed below the zero line.
In 2022, once the MACD crossed below the zero line, price found bottom 3 months later.
History rhymes, we would find bottom in September.

21 Nov 2025

This simple monthly #Bitcoin MACD bearish crossover doesn't care about predictions by talking heads, whales buying, on-chain data, or influencer bros buying the dip all the way down.
This free lagging indicator would outperform most "experts/analysts."
Expect bounces, but buy the right dip. 🤝
46
101
463
31,811
Jun 8
Since I reduced staring on charts, trying to predict the next moves, I'm much more in sync with underlying sentiment, sacrifying a fraction of my time. Reduce the noise 🧘🏼
1
38

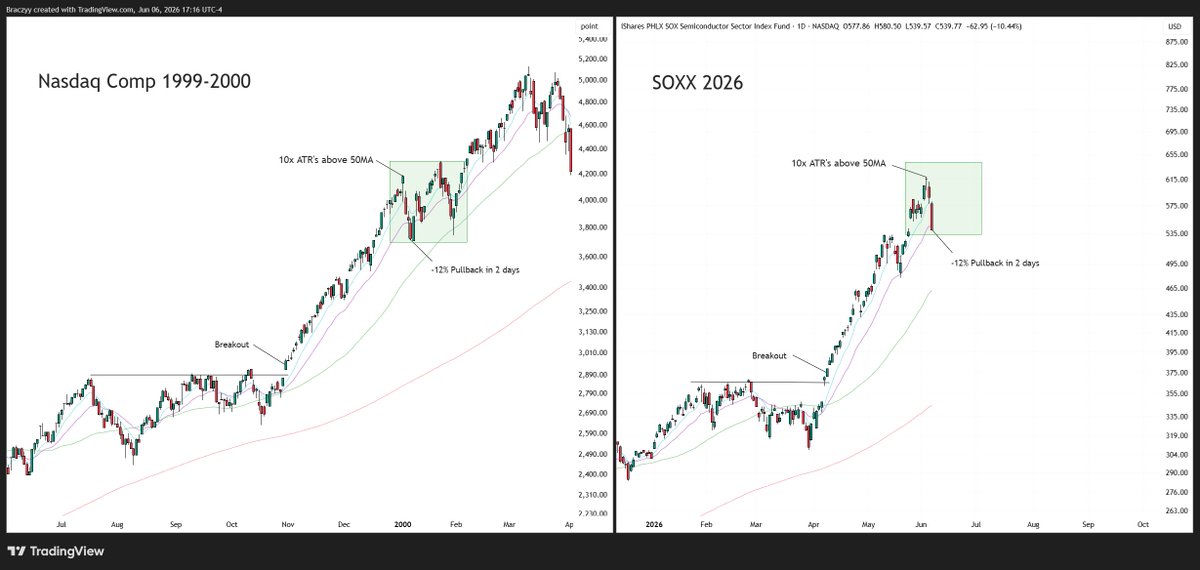
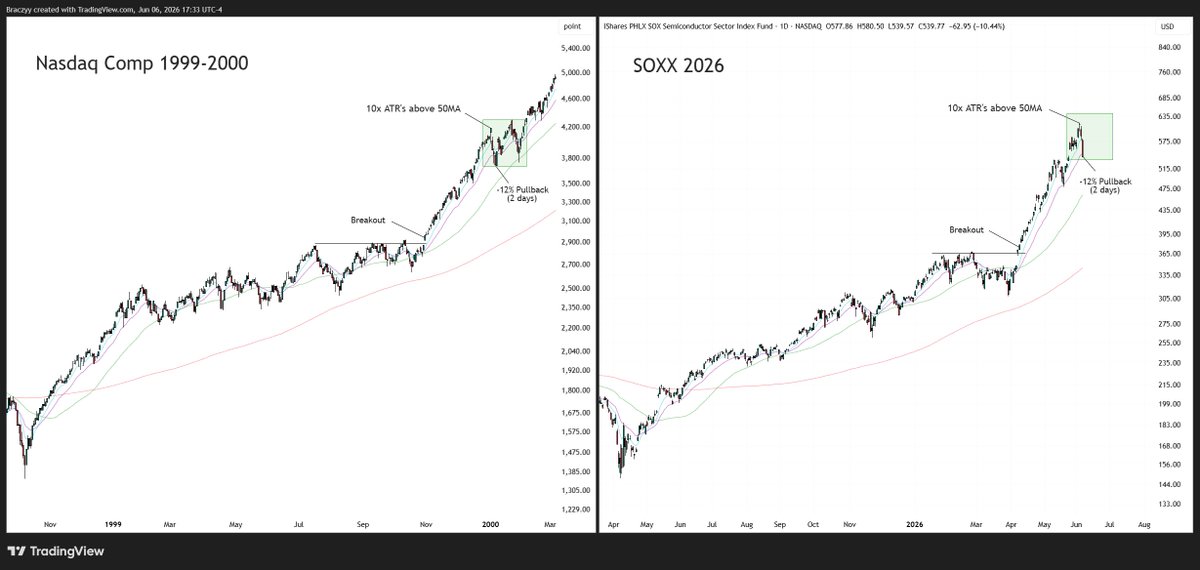
Went back and studied the Nasdaq parabolic advance following the November 1999 breakout. Wanted to see what the first real pullback looked like after the big down move in markets on Friday.
Nasdaq went vertical for 10 weeks, reaching nearly 10x ATR's above the 50SMA before its first close below the 20EMA, which came after a sharp 12% pullback in two sessions.
$SOXX just fell -12% in two days after hitting just over 10x ATR multiples above the 50SMA on Wednesday... First close below the 20EMA on Friday.
Wanted to compare the two as $SOXX $SMH and semiconductor stocks share many striking similarities with the Nasdaq and internet leaders of the 90's.
Also worth noting that many of the leaders during the first parabolic advance on the Nasdaq in 1999 did NOT make new highs again, even though the index grinded another 30% higher.
If using as precedent it's likely we saw some capitulation on Friday and could find a low next week. Would expect wide ranges, volatility, and tougher trading conditions. Just for studying and entertainment purposes.
50
86
818
152,302
Jun 5
😬 saying what?
Jun 5

We ARE in a BTC Bear Market.
Not in a Crypto Bear
27
Jun 4
The question about Saylor and strategy is, how likely a prolonged bear market will make this company force to liquidate BTC (and how much). Also, how likey a complete failure of strategy is. Imo, forget about the four year cycle theory, it's a different environment now.
1
22
Jun 4
In the end it's about liquidity and the upcoming IPOs need all of the risk capital available. I'd expect a market correction after that. So what's BTC going to do? That's still the main question.
11
Freeman retweeted

Jun 3
🚨 SOMETHING MIGHT HAVE BROKEN INSIDE MICHAEL SAYLOR’S BITCOIN MACHINE.
$STRC was designed to stay near $100 forever. Strategy launched it in July 2025, raised $2.5 BILLION from investors, and used that money to buy more Bitcoin.
In return, investors got an 11.5% yearly yield paid monthly in cash.
The entire structure depended on one thing: keep the price near $100.
If STRC dropped below $100, Strategy could raise the dividend to attract buyers back. That is why STRC stayed stable for months.
Now the system is cracking and STRC just dropped to $94.84.
But Why?
Three things hit at the same time
• Bitcoin dumped toward $67K
• Strategy sold Bitcoin for the first time in 4 years
• Investors are now questioning how sustainable the dividends really are
The company sold 32 BTC worth $2.5 MILLION specifically to help fund STRC dividend payments.
That may sound small. But it completely breaks the never sell Bitcoin narrative Saylor built for years.
Markets are now pricing in the possibility that Strategy may eventually need to sell more BTC to support nearly $1.7 BILLION in yearly preferred dividend obligations.
At the same time, Strategy refused to raise the STRC dividend above 11.5% for the fourth straight month even as competitors started offering higher yields.
Strive is now offering 13% on a competing product. The entire trade now depends on one thing:
Bitcoin going higher.
Because if BTC keeps falling, pressure on the entire Strategy structure starts rising very fast.

184
244
1,535
331,103
Jun 4
Most likely path.
Jun 4

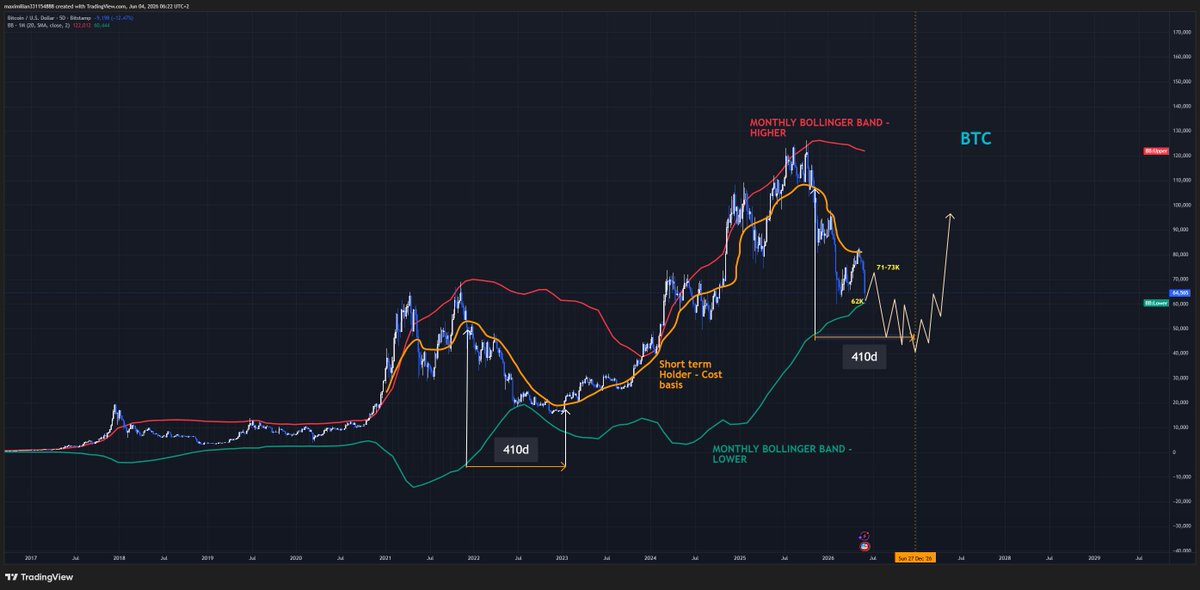
BTC - UPDATE ‼️‼️‼️‼️
After dropping to the 62k region as expected - BTC has tagged the monthly lower Bollinger band - an area that it has never dropped below! Therefore expect a retracement to form a lower high
Targeting 71-73k initially
From around that region I expect btc to display weakness and then begin its drop to 47k region / monthly 200 ema - where we will range for many months and form an accumulation schemetic
10
Jun 3
Probable outcome of a theory I have myself.
Jun 3

In a few months profits will temporarily flow out of TradFi (cool off phase after IPOs).
People will want to know where to put their money because everything already went up so much.
And there Bitcoin will be, ready to begin the next four year cycle.
19
Jun 3
I like that!
Jun 2

$SPX Potential roadmap for the rest of the year:
7,600-7,700 ish
-->
7,000 ish (buy this dip!)
-->
8,000 ish
Would fit nicely with the squiggly lines that kinda looks pretty and makes sense...
@fundstrat
1
133