
Chief DCF manipulator, market investigator and fundamental chartist. ACCA, CISI. Dynamic asset allocation. Not financial advice.
Joined January 2016
- Tweets 6,001
- Following 349
- Followers 1,894
- Likes 4,184
1,285 Photos and videos


Pinned Tweet

Jun 13
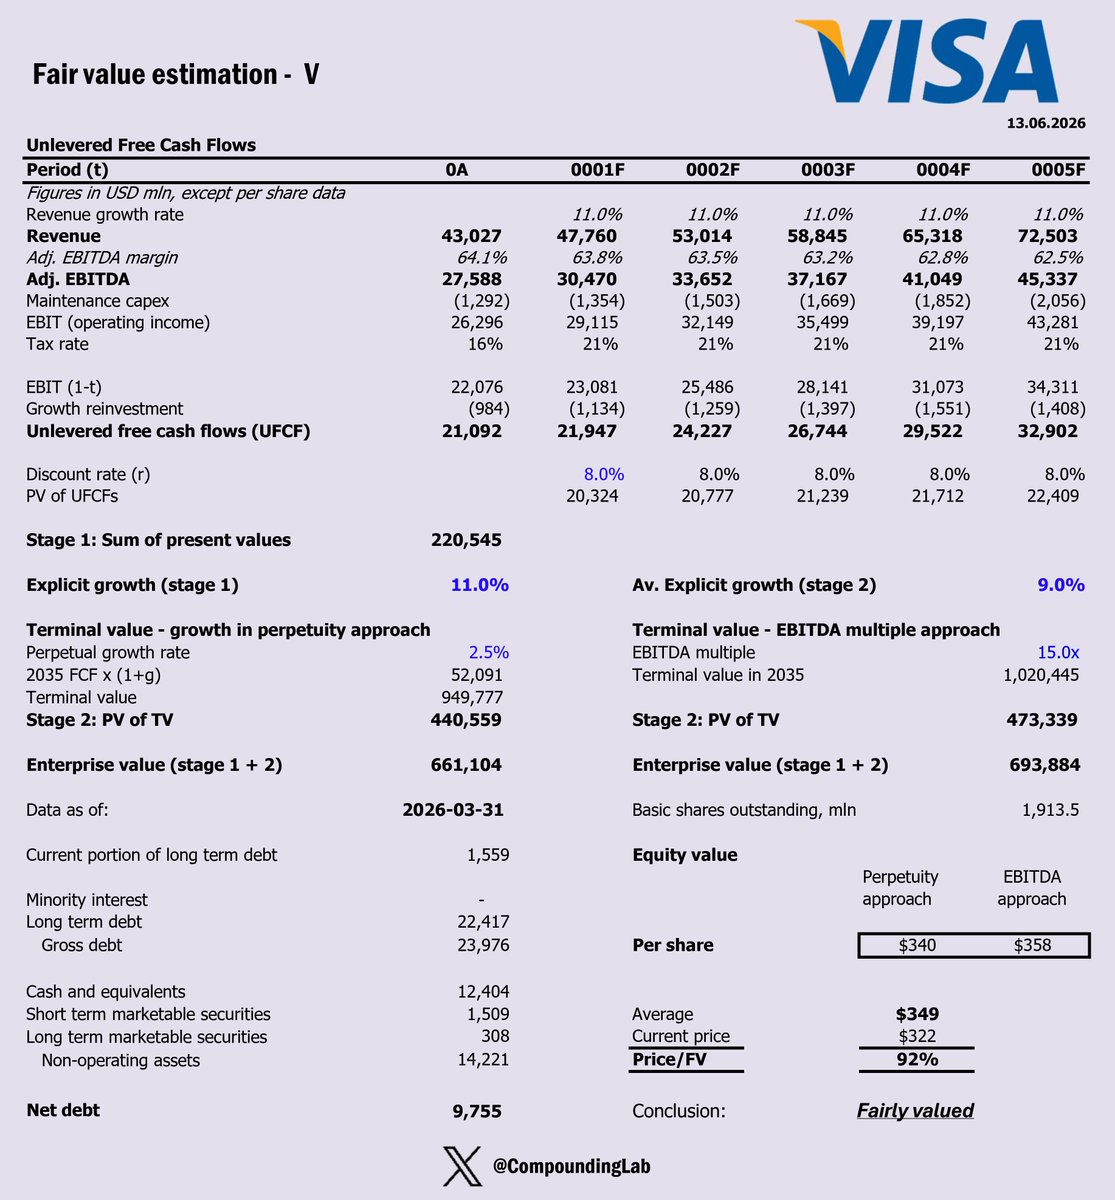
$V DCF valuation shows discount.
If you've ever tapped your card at a coffee shop, bought something online in another country, or paid for a streaming subscription, there's a very good chance Visa took a small slice of that transaction - quietly, invisibly, and almost certainly without you thinking about it. That's the business I'm writing about today.
Key assumptions:
* Explicit average 5Y/5Y growth @ 11%/9%
* Long-term growth in perpetuity @ 2.5%
* EBITDA Margin compression from 64% to 61% in Y10
WACC @ 8%
* Adj. EBITDA exit multiple of 15.0
* Tax rate 21% - in line with statutory
* The input that drives reinvestment is Sales to Capital ratio = 4.63
My base-case fair value is $349. That gives roughly 8% upside, supported by a DCF/EBITDA value of $358 and partially offset by a more conservative DCF/perpetuity valuation. I would not underwrite big multiple expansion here. The upside has to come mostly from earnings growth, cash generation, and continued buybacks.
Detailed workings are available on my Substack 👇
1
3
608
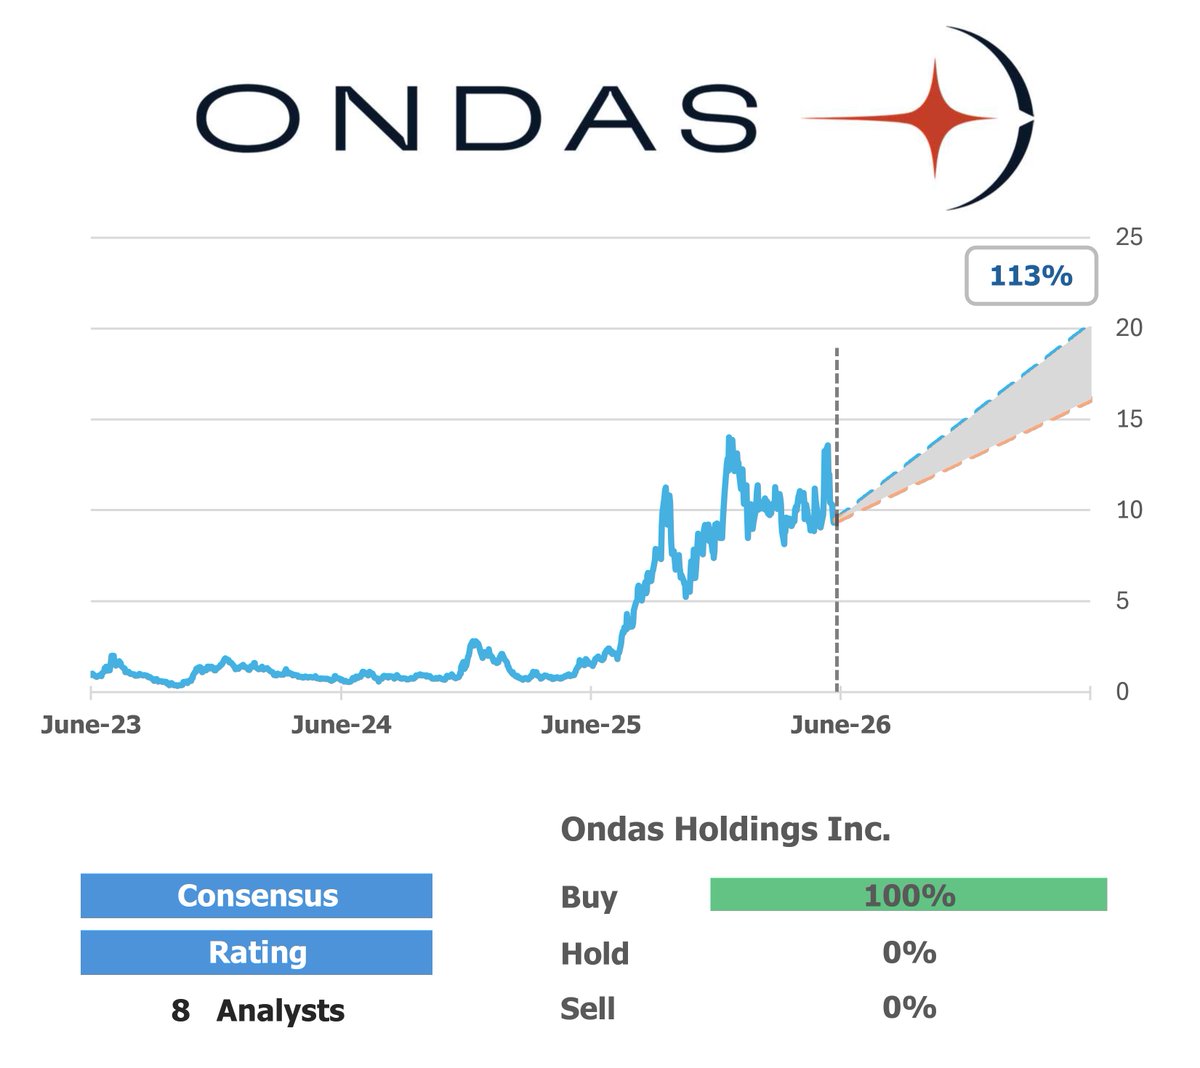
$ONDS
10Y ROIC, Average -271% 🚫
10Y Revenue, CAGR 158% ✔️
FCFF 3Y Average, mln -$32
3Y FCFF/TEV yield -1%
None Moat 🚫
Market Price $9
Fair value $19
Shares UNDERVALUED
Discount (-)/Premium ( ) -49% ✔️
307
$AIOT
10Y ROIC, Average -8% 🚫
10Y Revenue, CAGR 24% ✔️
FCFF 3Y Average, mln -$6
3Y FCFF/TEV yield -1%
Narrow Moat ✔️
Market Price $4
Fair value $10
Shares UNDERVALUED
Discount (-)/Premium ( ) -57% ✔️
135
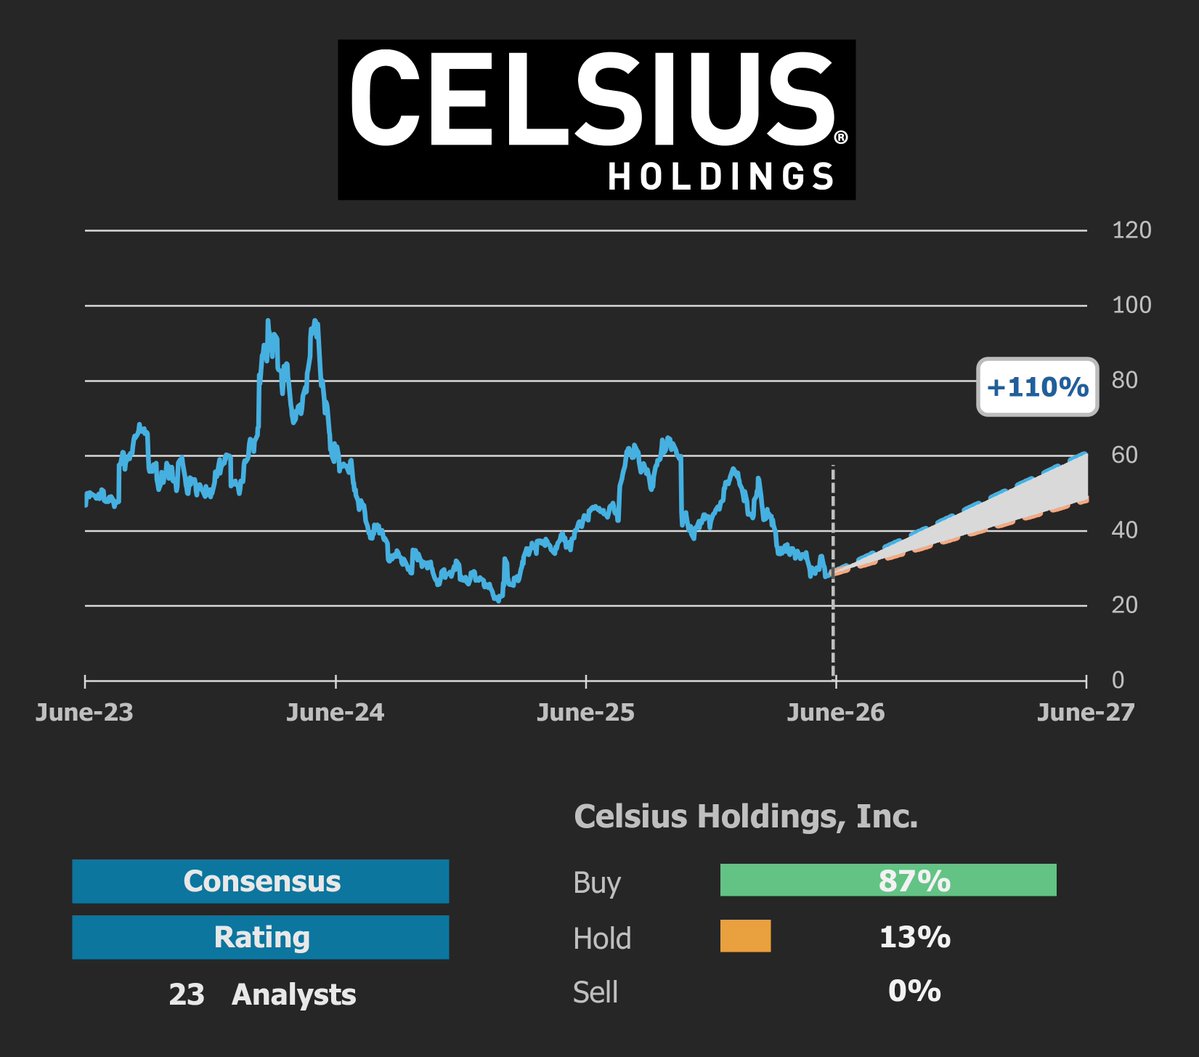
$CELH
10Y ROIC, Average -10% 🚫
10Y Revenue, CAGR 65% ✔️
FCFF 3Y Average, mln $245
3Y FCFF/TEV yield 2%
None Moat 🚫
Market Price $29
Fair value $56
Shares UNDERVALUED
Discount (-)/Premium ( ) -49% ✔️
1
308
Jun 14
I am currently working on $LMT DCF model. There seems to be an opportunity for a patient investor. Will share within next week.
1
2
450
Jun 14
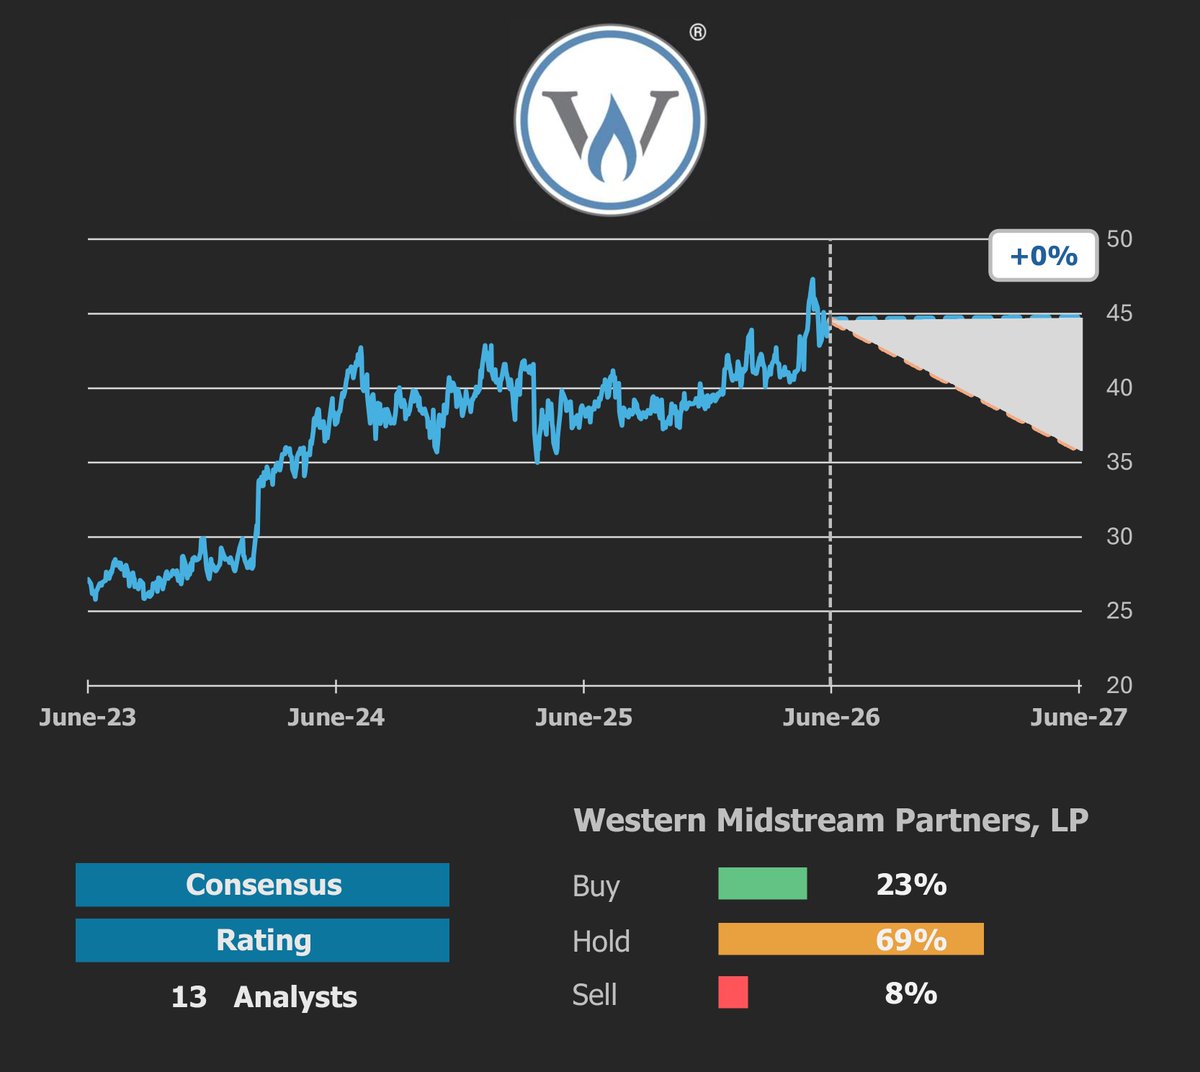
$WES
10Y ROIC, Average 11% ✔️
10Y Revenue, CAGR 9% ✔️
FCFF 3Y Average, mln $1,586
3Y FCFF/TEV yield 6%
Narrow Moat ✔️
Market Price $45
Fair value $41
Shares OVERVALUED
Discount (-)/Premium ( ) 8% 🚫
114
Jun 14
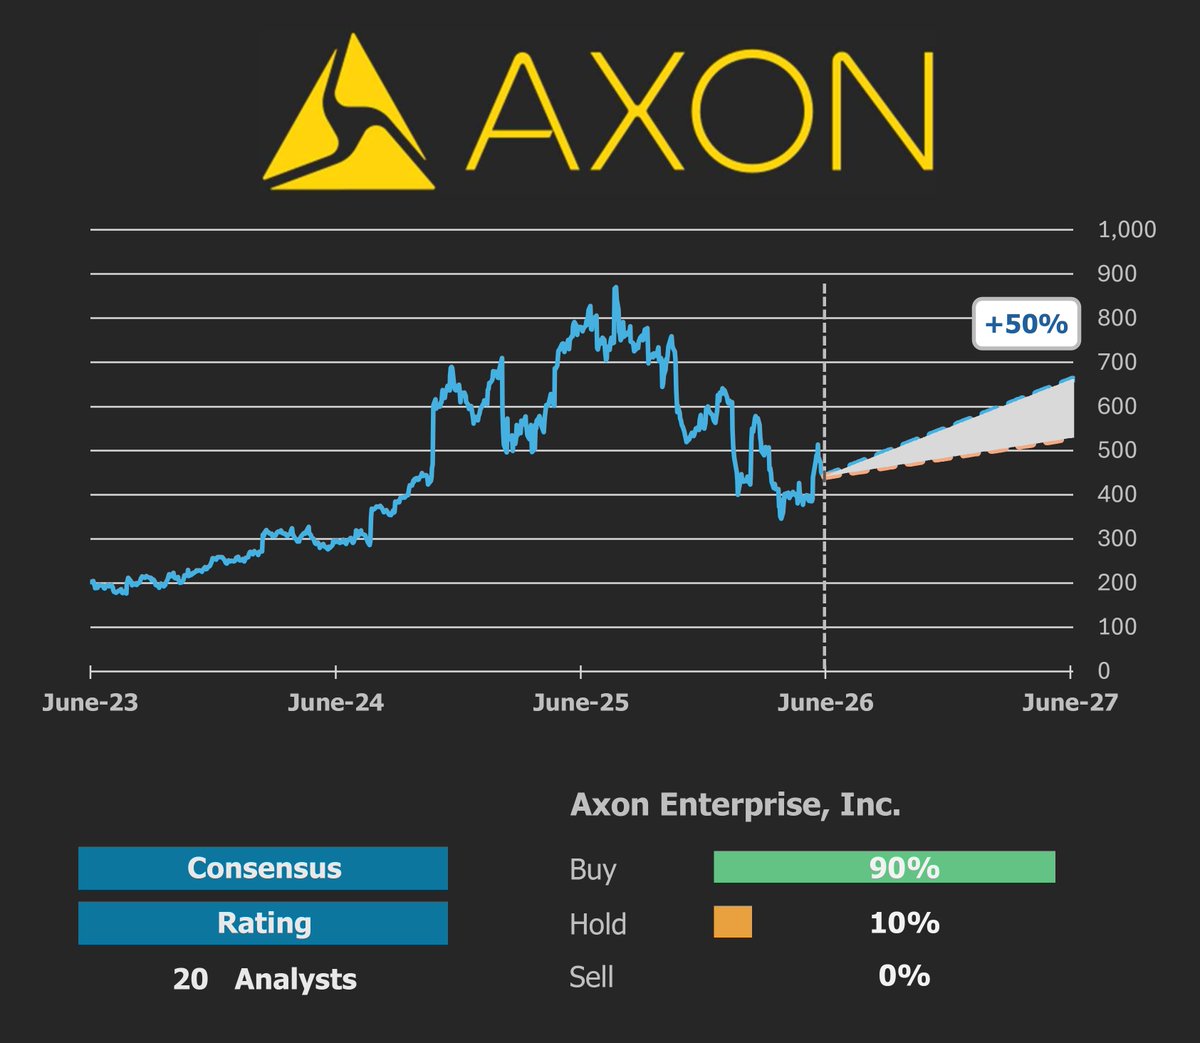
$AXON
10Y ROIC, Average 2% 🚫
10Y Revenue, CAGR 30% ✔️
FCFF 3Y Average, mln $214
3Y FCFF/TEV yield 0%
Narrow Moat ✔️
Market Price $442
Fair value $613
Shares UNDERVALUED
Discount (-)/Premium ( ) -28% ✔️
273
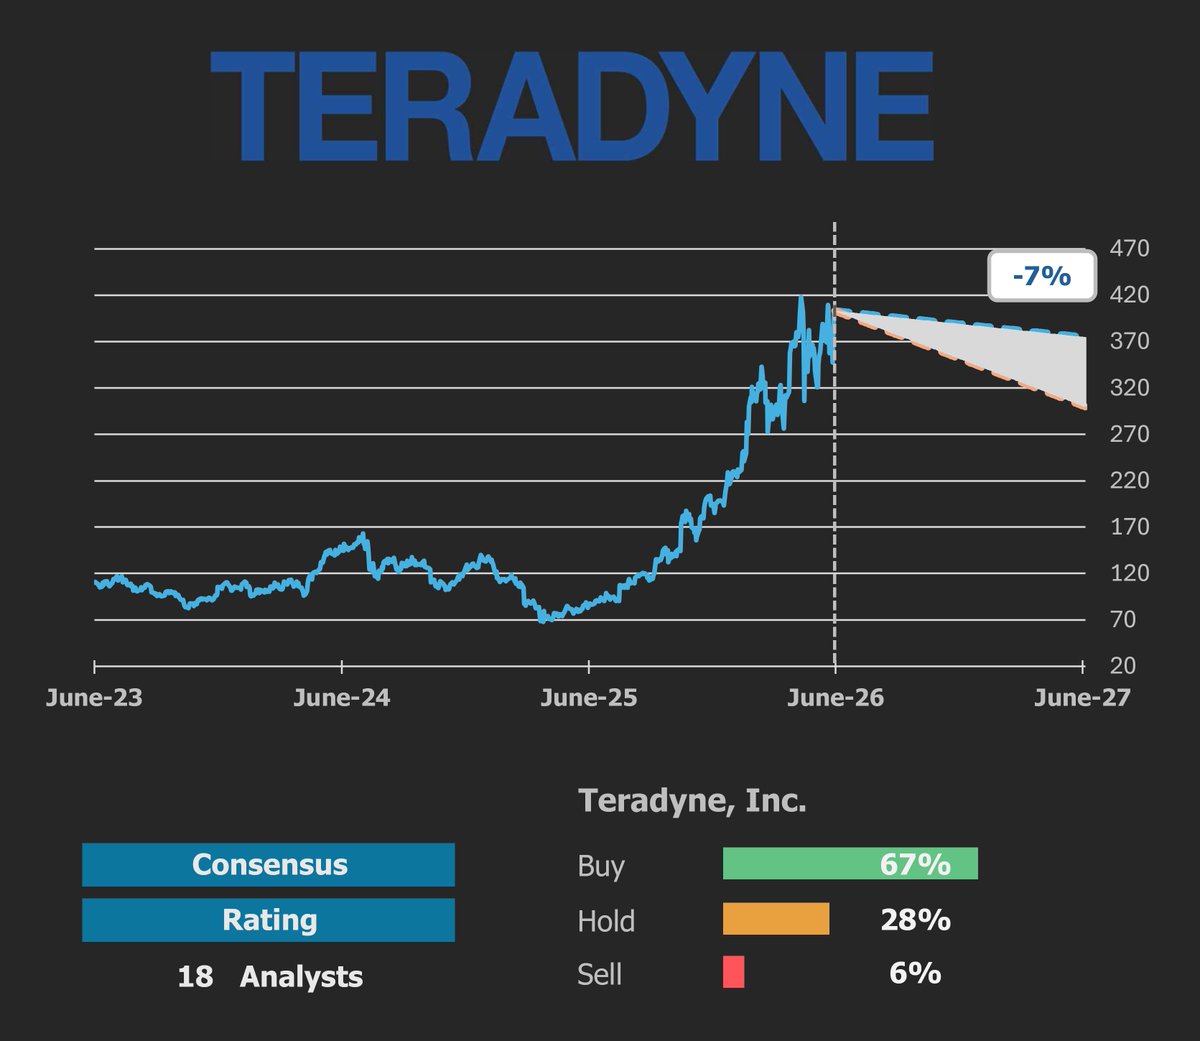
Jun 13
$TER
10Y ROIC, Average 19% ✔️
10Y Revenue, CAGR 7% ✔️
FCFF 3Y Average, mln $455
FCFF/TEV 3Y yield 2%
Wide Moat ✔️
Market Price $403
Fair value $347
Shares OVERVALUED
Discount (-)/Premium ( ) 16% 🚫
265
Jun 13
$SGI
10Y ROIC, Average 102% ✔️
10Y Revenue, CAGR 26% ✔️
FCFF 3Y Average, mln $707
FCFF/TEV 3Y yield 3%
Narrow Moat ✔️
Market Price $72
Fair value $90
Shares UNDERVALUED
Discount (-)/Premium ( ) -20% ✔️
120
Jun 13
$V DCF valuation shows discount.
If you've ever tapped your card at a coffee shop, bought something online in another country, or paid for a streaming subscription, there's a very good chance Visa took a small slice of that transaction - quietly, invisibly, and almost certainly without you thinking about it. That's the business I'm writing about today.
Key assumptions:
* Explicit average 5Y/5Y growth @ 11%/9%
* Long-term growth in perpetuity @ 2.5%
* EBITDA Margin compression from 64% to 61% in Y10
WACC @ 8%
* Adj. EBITDA exit multiple of 15.0
* Tax rate 21% - in line with statutory
* The input that drives reinvestment is Sales to Capital ratio = 4.63
My base-case fair value is $349. That gives roughly 8% upside, supported by a DCF/EBITDA value of $358 and partially offset by a more conservative DCF/perpetuity valuation. I would not underwrite big multiple expansion here. The upside has to come mostly from earnings growth, cash generation, and continued buybacks.
Detailed workings are available on my Substack 👇
1
3
608
Jun 13
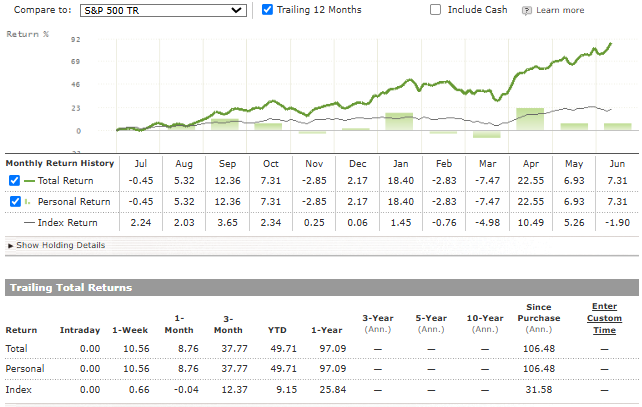
Everyone says there is no way to automate alpha-portfolio construction with screeners.
In the meantime, below is annualized performance of my portfolio created in April 2025, using CL magic formula 👇
CL magic formula 106%
$SPY 32%
Luck? Possibly.
We are going to find out soon. But the longer it continues to outperform, the less luck there is.
157
$AMH
10Y ROIC, Average 6% 🚫
10Y Revenue, CAGR 11% ✔️
FCFF 3Y Average, mln $968
FCFF/TEV 3Y yield 5%
None Moat 🚫
Market Price $33
Fair value $33
Shares FAIRLY VALUED
Discount (-)/Premium ( ) 2% ⏸
163
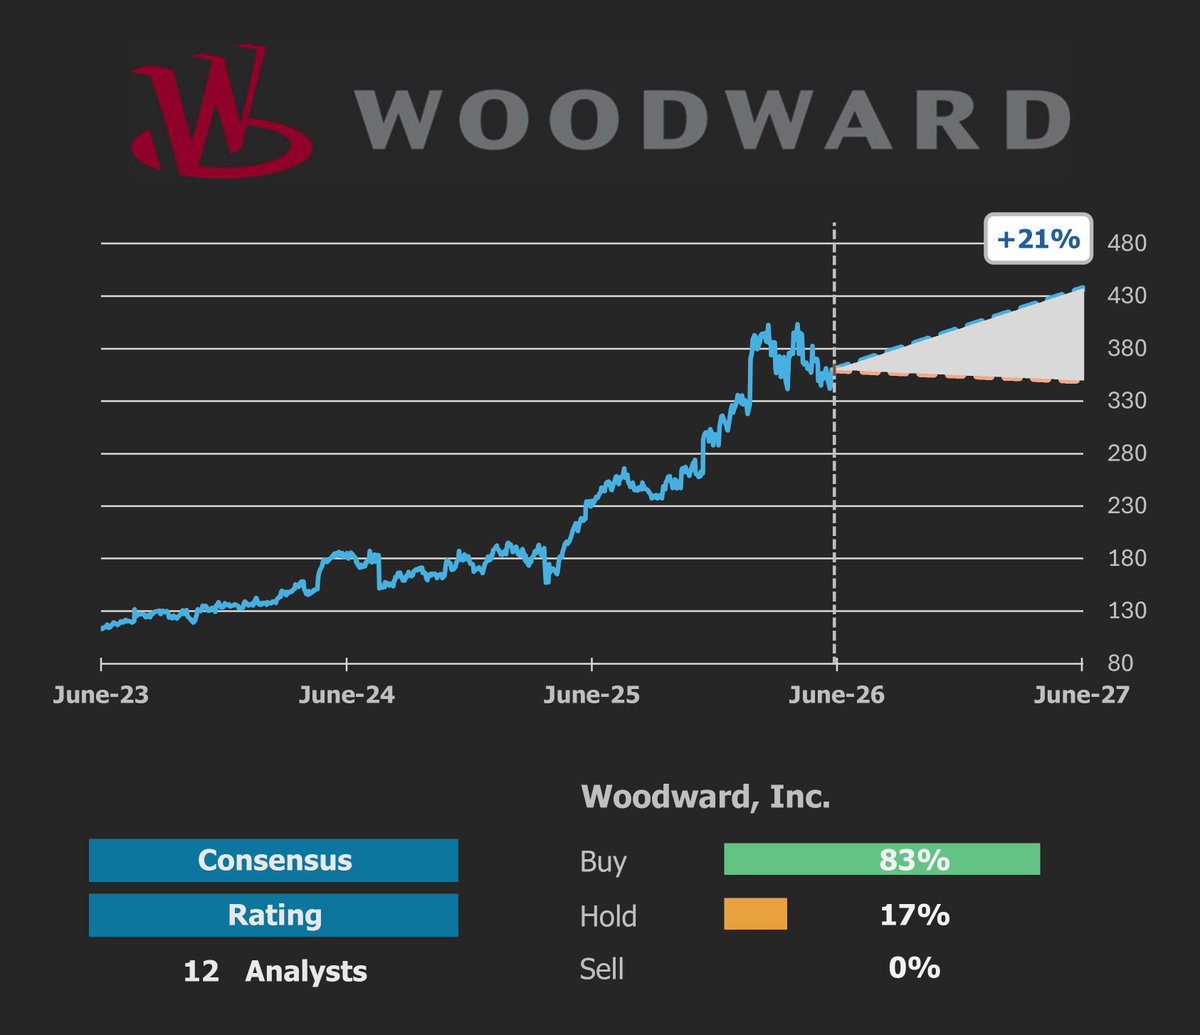
$WWD
10Y ROIC, Average 8% 🚫
10Y Revenue, CAGR 6% ✔️
FCFF 3Y Average, mln $352
FCFF/TEV 3Y yield 2%
Wide Moat ✔️
Market Price $360
Fair value $405
Shares UNDERVALUED
Discount (-)/Premium ( ) -11% ✔️
189
$BBY
10Y ROIC, Average 20% ✔️
10Y Revenue, CAGR 1% 🚫
FCFF 3Y Average, mln $1,158
FCFF/TEV 3Y yield 7%
None Moat 🚫
Market Price $74
Fair value $73
Shares FAIRLY VALUED
Discount (-)/Premium ( ) 2% ⏸
243
Looking at hindsight, in April 2025 I made a huge mistake by not making this portfolio my main one.
I made my homework and at least now I know that this formula works. I am going to deploy full capital into top 10 stocks selected with this formula, but under certain conditions.
That condition is market drawdown >20%.
I don't think we will have to wait long for this.
Stay tuned, I will share everything online.

Still remember my Growth Wide Moat portfolio I created in April 2025, subs?
Absolutely crashing the index.
The only regret about this portfolio is that it was a demo account.
301
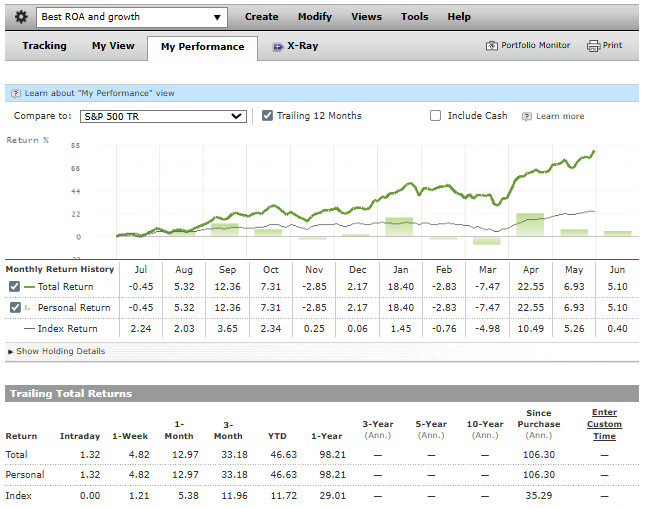
𝗣𝗼𝗿𝘁𝗳𝗼𝗹𝗶𝗼 𝘂𝗽𝗱𝗮𝘁𝗲 - 𝗠𝗮𝘆 𝟮𝟬𝟮𝟲
CL April 4.37%
SP500 April 5.26%
CL YTD 3.2%
SP500 YTD 11.3%
𝗧𝗿𝗮𝗻𝘀𝗮𝗰𝘁𝗶𝗼𝗻𝘀
In May, I made a few additions, shifting capital from low-volatility positions to growth stocks with the potential to outperform the index. The AI expansion is ongoing and sustainable, and I want to be part of it. This strategy may increase the volatility of my portfolio, but I see it as an opportunity, not a flaw. My portfolio is stress-tested monthly to ensure any drawdowns remain limited. I also hold significant capital in bonds and low-beta ETFs, ready to be deployed during a meaningful market decline, typically aiming for around 20%.
➖ To satisfy reallocation of capital, EVO, NVO, BIL were partially disposed and EEMV was fully disposed.
➕ Added RZLV (Generative AI / AI Software), SYM (AI Warehouse/Logistics within Robotics & Automation industry), JOBY (eVTOL / urban air mobility), EOSE (Energy storage / battery manufacturing), ASPI (isotopes/nuclear supply chain), Also added BTDR, CLSK, MARA. These 3 Data centers/BTC Miners standout as transitioning to AI/HPC with a hyperscaler deal expected in 2026. They now constitute 10% allocation. Once deal is announced, I expect shares to skyrocket. Diversification between different miners is key in portfolio construction. Market is pricing each of those separately based on 10% probability of a hyperscaler deal. But when combined, this probability rises exponentially.
➕ Added IONQ. My quantum computing bet.
𝗦𝘁𝗿𝗲𝘀𝘀 𝘁𝗲𝘀𝘁
If SP500 collapses by 50%, our portfolio is expected to drop by 27%.
𝗛𝗼𝗹𝗱𝗶𝗻𝗴𝘀 𝗮𝘀 𝗼𝗳 𝟬𝟭/𝟬𝟲/𝟮𝟬𝟮𝟲:
PRAB 12%
BIL 9%
SHY 7%
FTSL 4%
CLSK 4%
BKLN 4%
BTDR 4%
IEI 3%
ADBE 3%
USMV 3%
PNDORA 3%
LQD 3%
SPHD 3%
PYPL 3%
VGT 3%
EVO 3%
NVO 3%
MARA 2%
EOSE 2%
MBIN 2%
WKL 2%
EGBN 2%
Cash 2%
Other 17%
𝗕𝗿𝗲𝗮𝗸𝗱𝗼𝘄𝗻 𝗯𝘆 𝘀𝗲𝗰𝘁𝗼𝗿/𝗮𝘀𝘀𝗲𝘁 𝗰𝗹𝗮𝘀𝘀
Cash and equivalents – 30%
Bonds ETF – 14%
Consumer Cyclical – 10%
Financials – 14%
Technology – 13%
Low volatility ETF – 7%
Industrials – 6%
Healthcare – 4%
Communication Services – 1%
Basic Materials – 1%
CL.
310
Still remember my Growth Wide Moat portfolio I created in April 2025, subs?
Absolutely crashing the index.
The only regret about this portfolio is that it was a demo account.
509
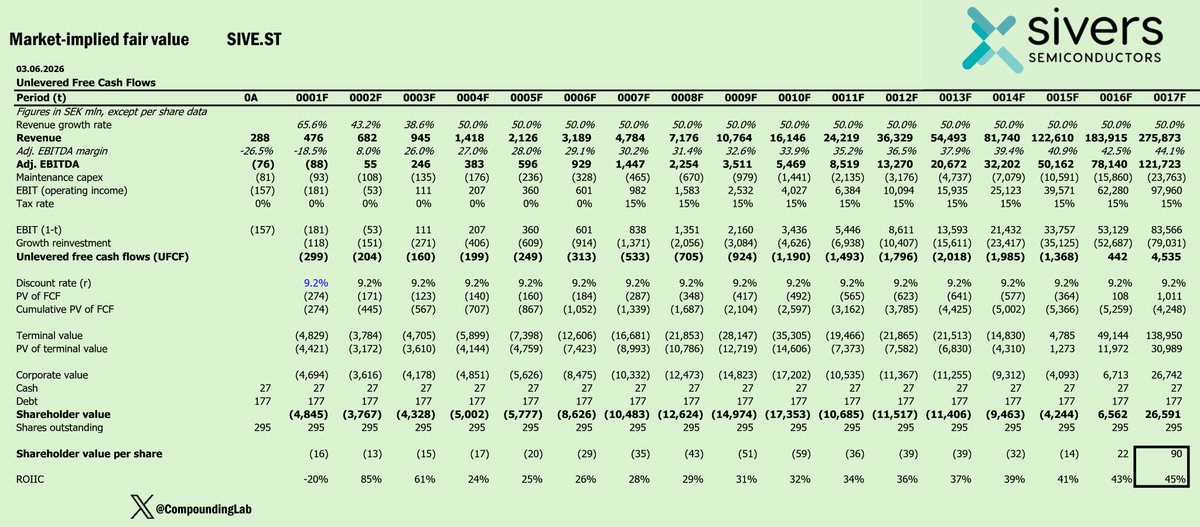
Market-implied intrinsic value for Sivers Semiconductors AB.
After 20x in just one year, it’s worth examining what expectations are currently embedded into $SIVE stock price.
To do that, I use Mauboussin’s market-implied CAP framework from his recent research paper “Competitive advantage period”.
Key expectations:
* For the first few years of explicit revenue forecast, I am using analyst consensus adjusted for mid-point since company already reported 1 quarter 2026. Afterward, I factor 50% until the end of the explicit period.
* I then calculate the terminal value assuming ROIC equals Cost of Capital after the end of the explicit period, i.e. any growth will not create value.
* Gradual EBITDA Margin expansion from current negative values to mid-double-digit in Year 17.
* WACC @ 9.2%.
* Tax rate 15% - in line with OECD’s Pillar 2 “Global Minimum Tax”
* The input that drives reinvestment is Sales to Capital ratio = 1.75.
At current price, market not only assumes very high returns on incremental capital going forward, but also a meaningful improvement in ROIC on existing capital.
This exercise is not investment advice, but rather an illustration of the key expectations infrastructure embedded into stock price.
You are required to do further financial and strategic analysis to assess whether those expectations are too low, too high, or about right.
714