
Joined December 2009
- Tweets 2,270
- Following 1
- Followers 2,693
- Likes 24
657 Photos and videos


14 Jun 2023
Cultivating a creative community with Tina Roth-Eisenberg of Creative Mornings: ow.ly/y8aH50ONFab
156
8 Jun 2023
Introducing Microsoft Fabric: Data analytics for the era of AI, integrating technologies like Azure Data Factory, Azure Synapse Analytics, and Power BI into a single unified product ow.ly/QEwz50OGm7T
145
7 Jun 2023
27 (Secrets) on How To Create An Awesome Viral Infographic in 2023 - great content and tips, but not a great infographic (sadly) coolinfographics.com/blog/20…
106
7 Jun 2023
Chart Reader: Accessible Visualization Experiences Designed with Screen Reader Users: ow.ly/Gg3c50OGm3a
97
1 Jun 2023
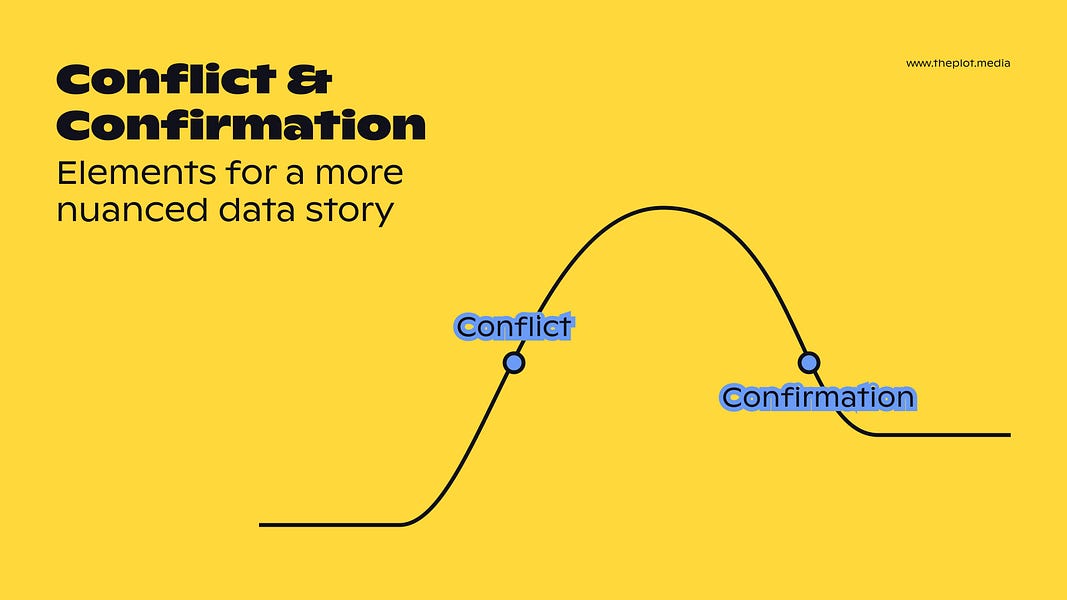
Finding the Right Elements For an Award-Winning Dashboard: nightingaledvs.com/elements-…
61
31 May 2023
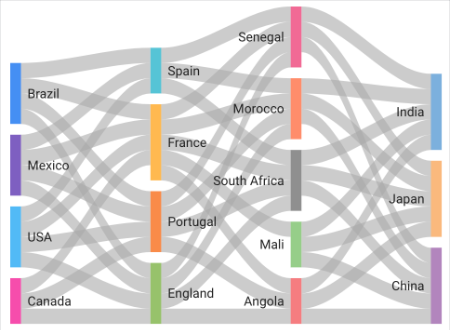
Check out the new page for the Open Climate Data project from Creative Commons which launched in Spring 2023, to facilitate the opening and sharing of climate datasets and data models available across the globe. ow.ly/EWhS50OAmHw
74
25 May 2023
How to maximize your marketing content and reach every audience you want: ow.ly/EaIe50Ov2Xf
58
22 May 2023
New paper from Robert Kosara: Notebooks for Data Analysis and Visualization ow.ly/qCwm50OsXyK
44
17 May 2023
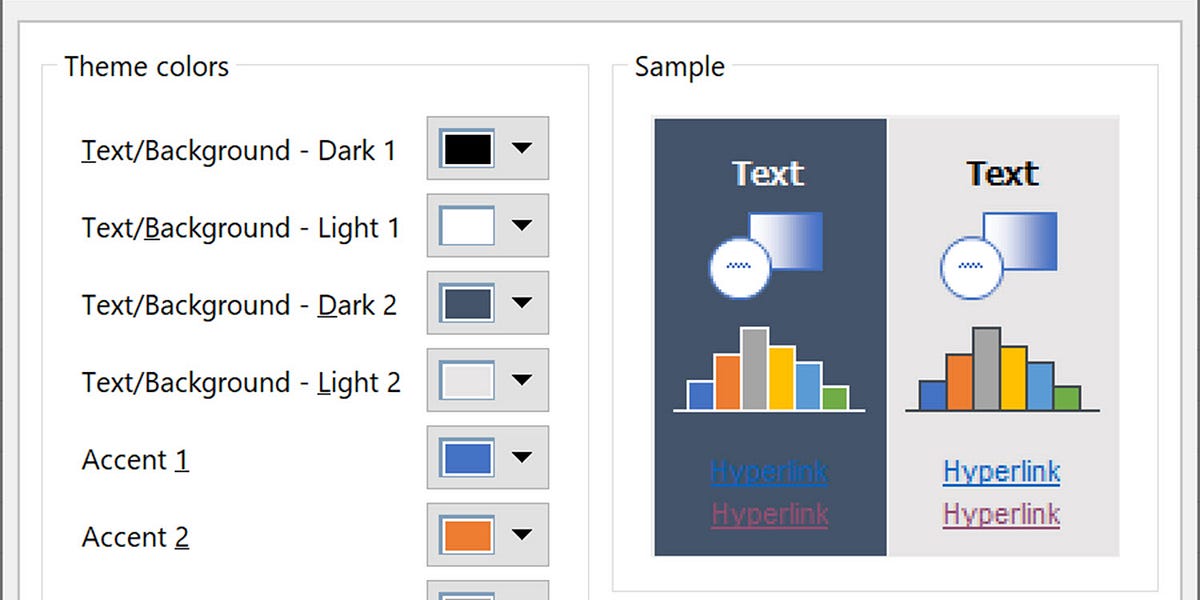
Why are six colors common in color palettes for data visualization? by Jon Schwabish ow.ly/vnvP50Ol35V
46
15 May 2023
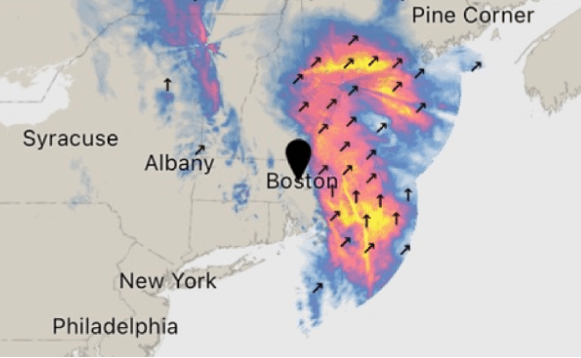
A Eulogy for Dark Sky, a Data Visualization Masterpiece (Dark Sky was my favorite weather app!) ow.ly/OKCY50Ol343
2
81
12 May 2023
Chart Reader is a web-based accessibility engine that generates charts that integrate with screen readers. ow.ly/yxM950Ol32V
50
3 May 2023
The reason Fernando is using Altair for most of his visualization in Python: ow.ly/XNWb50O7iMF
65
1 May 2023
The Data Visualization Society State of the Industry data for 2023 is out, The State of the Industry Survey Challenge has started to visualize the results. Submissions are due May 14 ow.ly/7jC250NVUtR
103