
Joined January 2018
- Tweets 2,592
- Following 441
- Followers 9,312
- Likes 641
1,892 Photos and videos


Pinned Tweet

29 May 2025
Well, look at that. The EC AIFS weather forecast is now in CropProphet.
The AIFS has emerged as the leading AI-based wx forecast model tracked by commodity traders.
Advance your weather forecast info: bit.ly/TryCropProphet
2
3
26
8,909
Jun 12
Register for our upcoming webinar, where we will discuss these types of analytical insights that give grain traders an objective edge: bit.ly/June2026_CP_Webinar
Jun 12

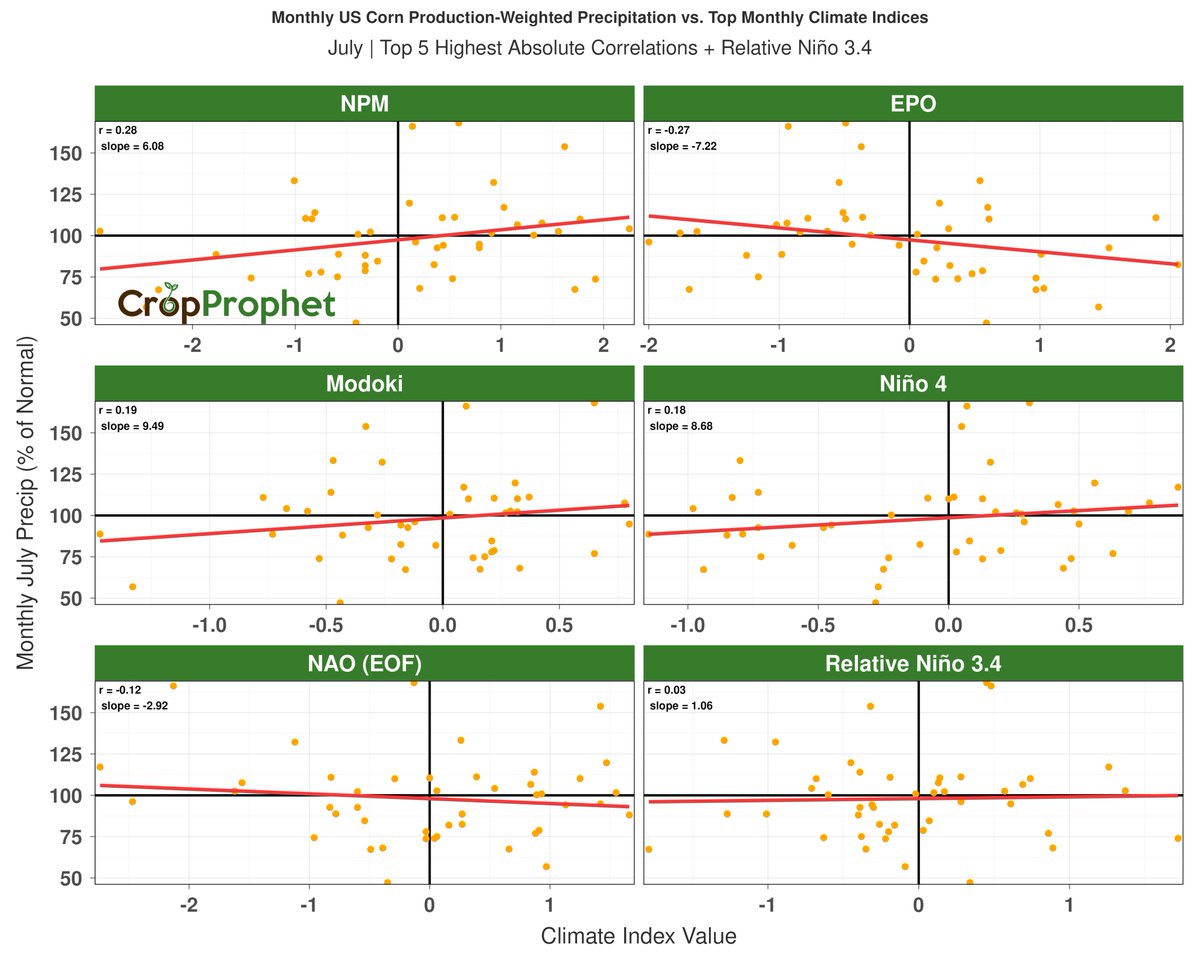
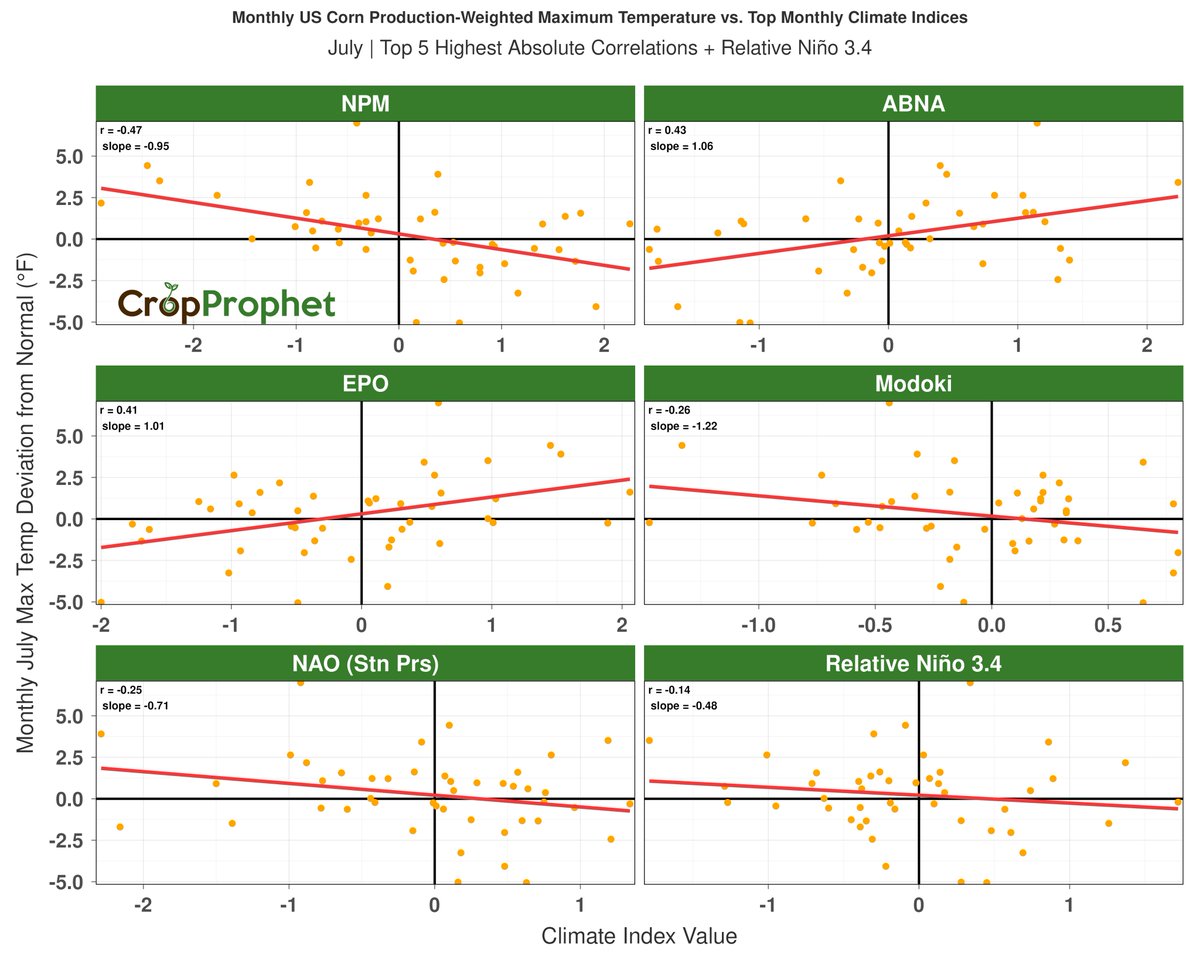
El Niño conditions are officially underway, according to the CPC.
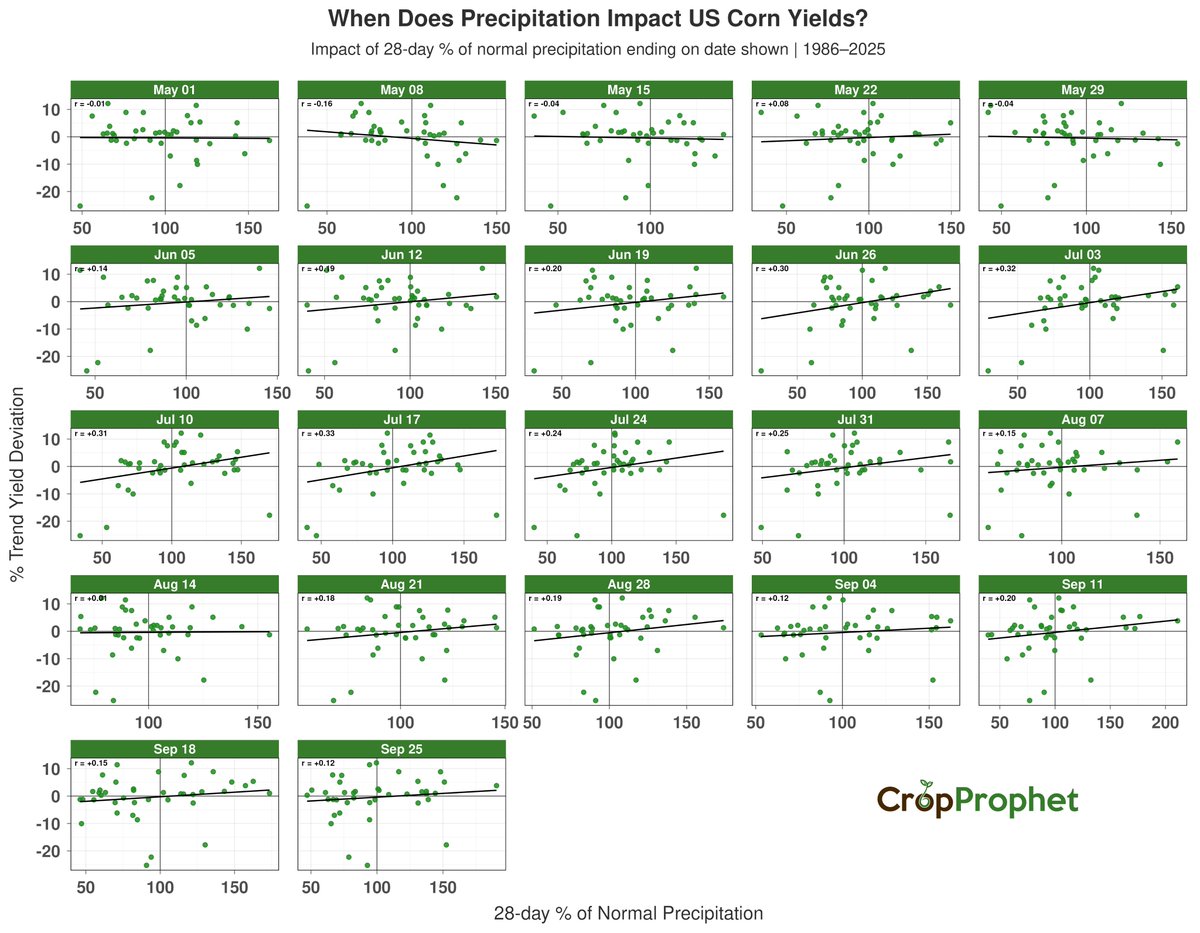
What does Relative Niño 3.4 indicate about US Corn Belt precipitation, maximum temperatures, and minimum temperatures during July in El Niño years?
Based on this analysis, Relative Niño 3.4 shows a limited July relationship with corn production-weighted precipitation, Tmax, and Tmin. The correlations are weak across all three variables, particularly compared to other climate indices.
For July, indices such as NPM (North Pacific Mode) and ABNA (Asian-Bering-North American), among others, show stronger relationships with Corn Belt precipitation and temperature variability than Relative Niño 3.4.
For grain traders, the data support evaluating multiple climate drivers when assessing Corn Belt weather risk, rather than relying on market attention around El Niño alone.
#OOTT #AgWx #AgWeather #ElNino #ElNiño
1
3
847
Jun 12
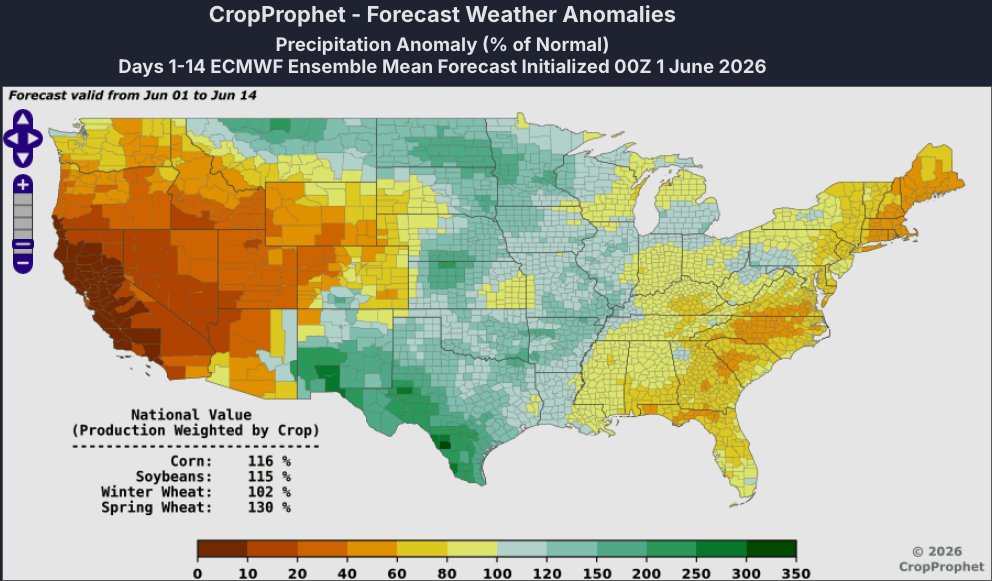
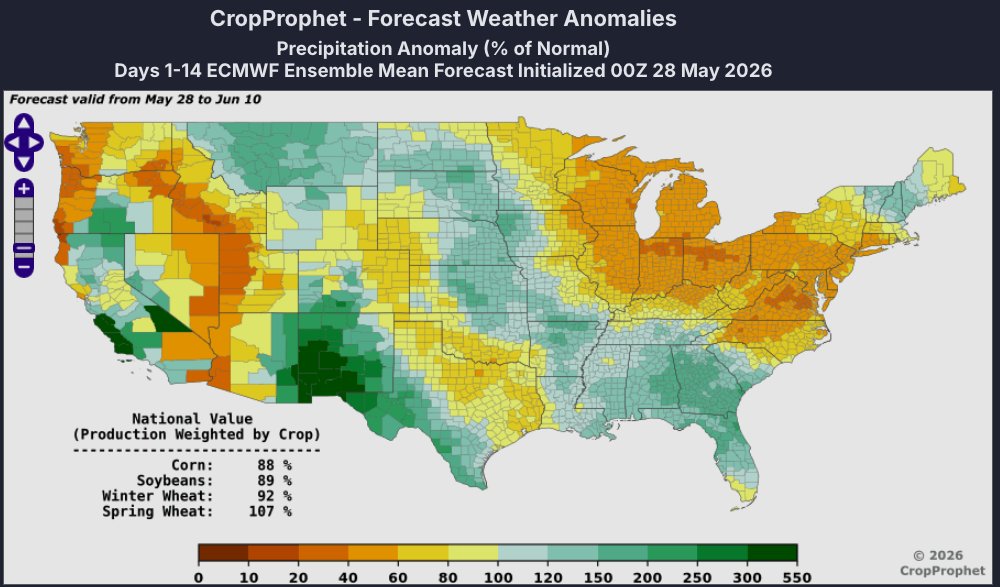
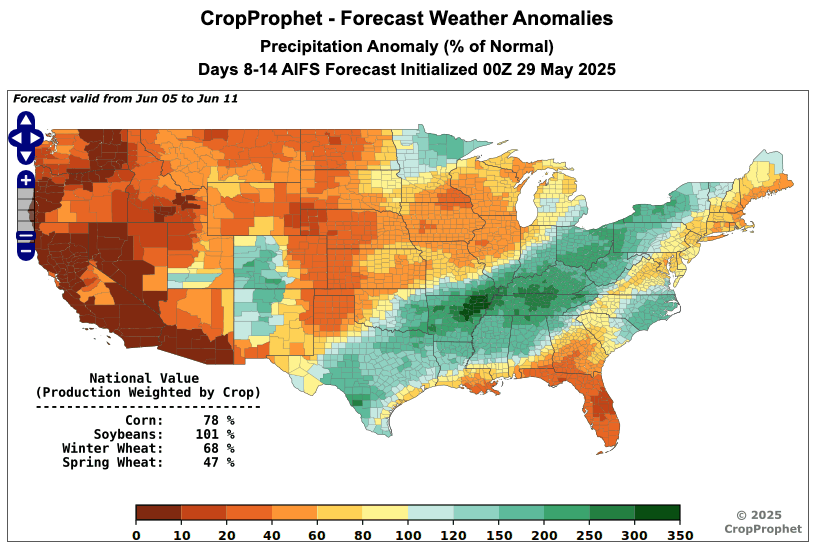
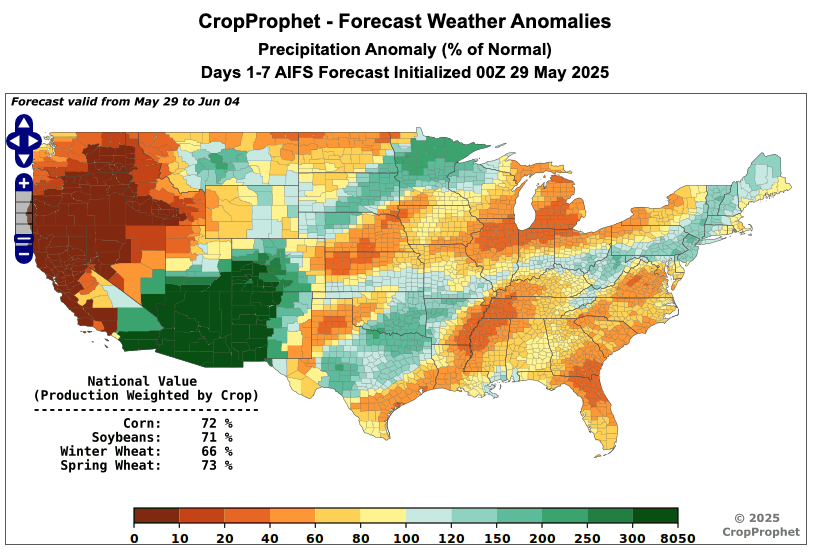
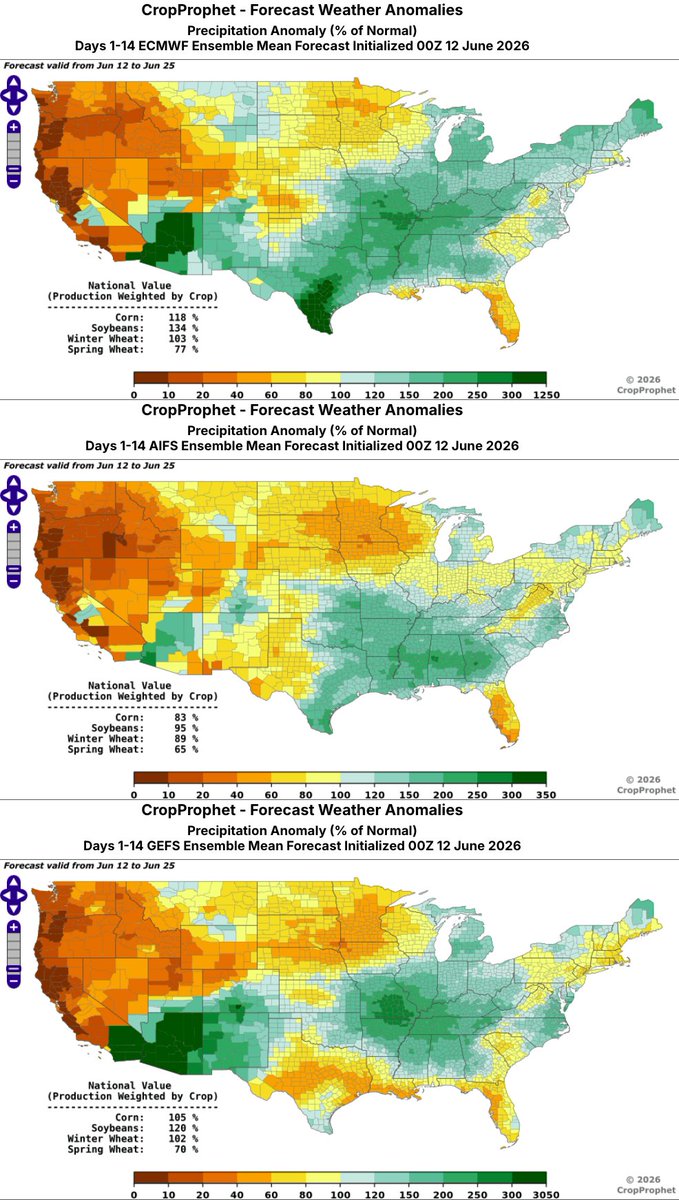
Over the past 60 days, precipitation has been below normal across portions of the western Corn Belt.
The latest 00z ECMWF, AIFS-ENS, and GEFS weather forecasts show continued below-normal precipitation across portions of the western Corn Belt during the next 14 days.
This weather pattern is worth monitoring as the calendar approaches July and the corn pollination window.
Use CropProphet to analyze weather risk with objective, data-driven insights: bit.ly/TryCropProphetTwitter
#OOTT #AgWX #AgWeather #Weather #Corn
1
2
8
975
Jun 12
Use CropProphet to analyze weather risk with objective, data-driven insights: bit.ly/TryCropProphetTwitter
1
2
360
Jun 12
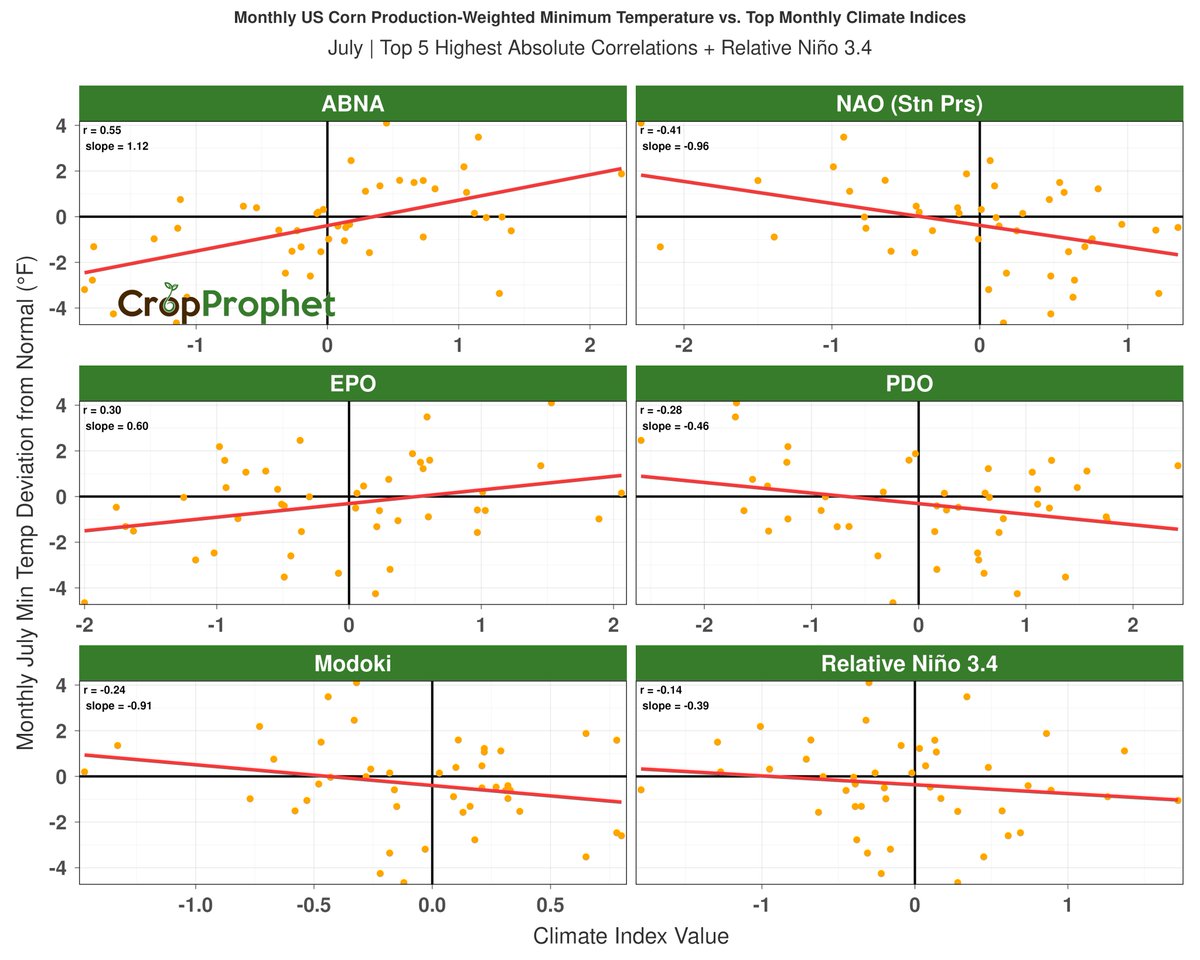
El Niño conditions are officially underway, according to the CPC.
What does Relative Niño 3.4 indicate about US Corn Belt precipitation, maximum temperatures, and minimum temperatures during July in El Niño years?
Based on this analysis, Relative Niño 3.4 shows a limited July relationship with corn production-weighted precipitation, Tmax, and Tmin. The correlations are weak across all three variables, particularly compared to other climate indices.
For July, indices such as NPM (North Pacific Mode) and ABNA (Asian-Bering-North American), among others, show stronger relationships with Corn Belt precipitation and temperature variability than Relative Niño 3.4.
For grain traders, the data support evaluating multiple climate drivers when assessing Corn Belt weather risk, rather than relying on market attention around El Niño alone.
#OOTT #AgWx #AgWeather #ElNino #ElNiño
1
1
9
1,770
Jun 12
Use CropProphet to analyze weather risk with objective, data-driven insights: bit.ly/TryCropProphetTwitter
1
2
371
Jun 11
Make sure to register and reserve your spot for the upcoming webinar: bit.ly/June2026_CP_Webinar
Jun 10
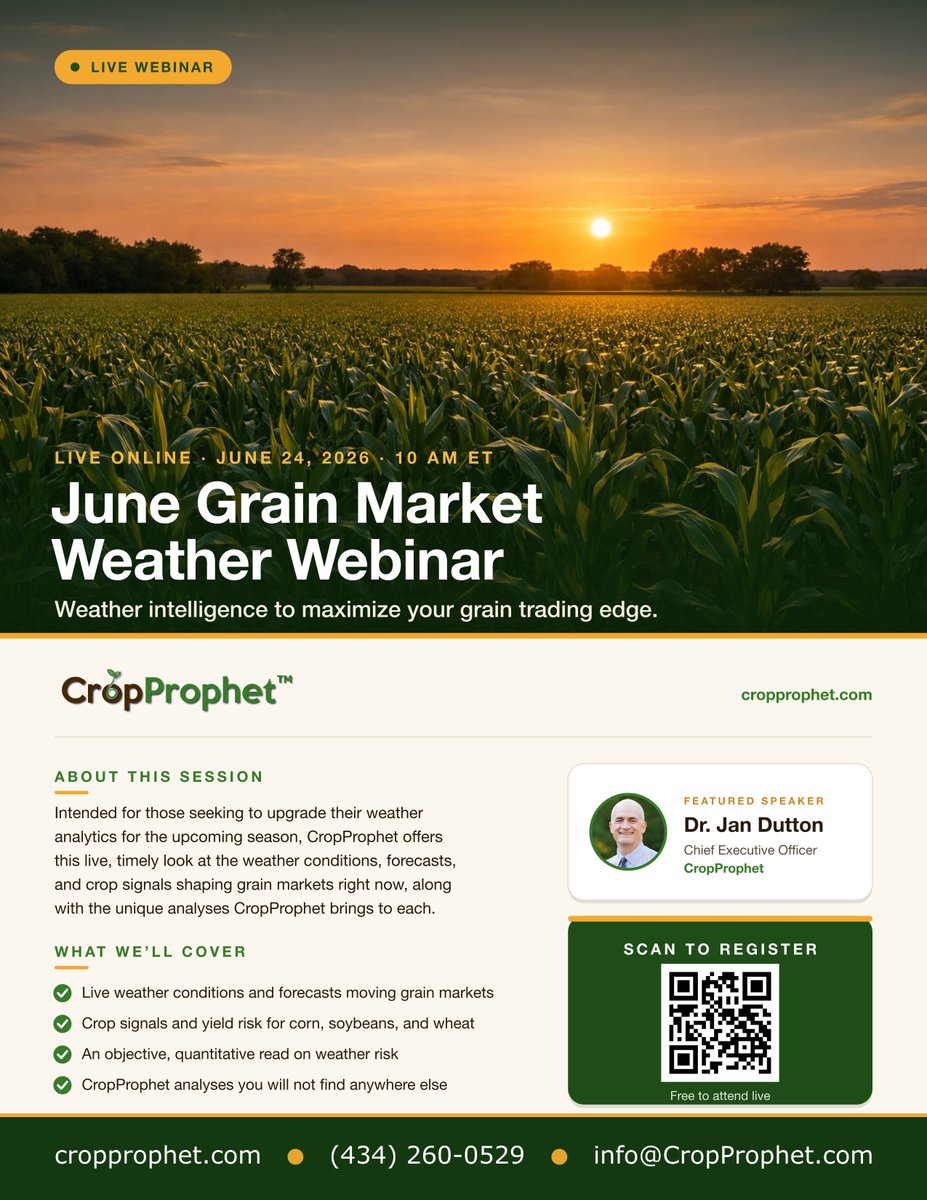
Two weeks from today, CropProphet will host the June 2026 Grain Market Weather Webinar, led by CEO Dr. Jan Dutton.
This live session will focus on the weather conditions, forecasts, and crop signals shaping grain markets, including early July temperature and precipitation weather forecasts across key #corn, #soybeans, and #wheat regions.
June 24, 2026
10:00 AM ET
👉 Register here: bit.ly/June2026_CP_Webinar
#AgWx #AgWeather #GrainMarkets #WeatherRisk #USDA #OOTT
1
2
713
Jun 10
Jun 10
Two weeks from today, CropProphet will host the June 2026 Grain Market Weather Webinar, led by CEO Dr. Jan Dutton.
This live session will focus on the weather conditions, forecasts, and crop signals shaping grain markets, including early July temperature and precipitation weather forecasts across key #corn, #soybeans, and #wheat regions.
June 24, 2026
10:00 AM ET
👉 Register here: bit.ly/June2026_CP_Webinar
#AgWx #AgWeather #GrainMarkets #WeatherRisk #USDA #OOTT
1
4
3,045
Jun 10
Two weeks from today, CropProphet will host the June 2026 Grain Market Weather Webinar, led by CEO Dr. Jan Dutton.
This live session will focus on the weather conditions, forecasts, and crop signals shaping grain markets, including early July temperature and precipitation weather forecasts across key #corn, #soybeans, and #wheat regions.
June 24, 2026
10:00 AM ET
👉 Register here: bit.ly/June2026_CP_Webinar
#AgWx #AgWeather #GrainMarkets #WeatherRisk #USDA #OOTT
1
1
4
4,212
Jun 10
Jun 10
Severe weather risk is becoming an important watchpoint for U.S. corn-growing regions as the crop emerges and heads toward silking.
This animation previews our upcoming severe weather map capability, which allows users to overlay hail and wind reports with U.S. corn and soybean production areas.
Yesterday hail and wind impacted large portions of the western Corn Belt, as shown in the animation.
How are you tracking severe weather risk across key growing regions this season?
#OOTT #AgWx #AgWeather #Corn #Weather
4
1,078
Jun 10
Severe weather risk is becoming an important watchpoint for U.S. corn-growing regions as the crop emerges and heads toward silking.
This animation previews our upcoming severe weather map capability, which allows users to overlay hail and wind reports with U.S. corn and soybean production areas.
Yesterday hail and wind impacted large portions of the western Corn Belt, as shown in the animation.
How are you tracking severe weather risk across key growing regions this season?
#OOTT #AgWx #AgWeather #Corn #Weather
1
1
3
1,855
Jun 8
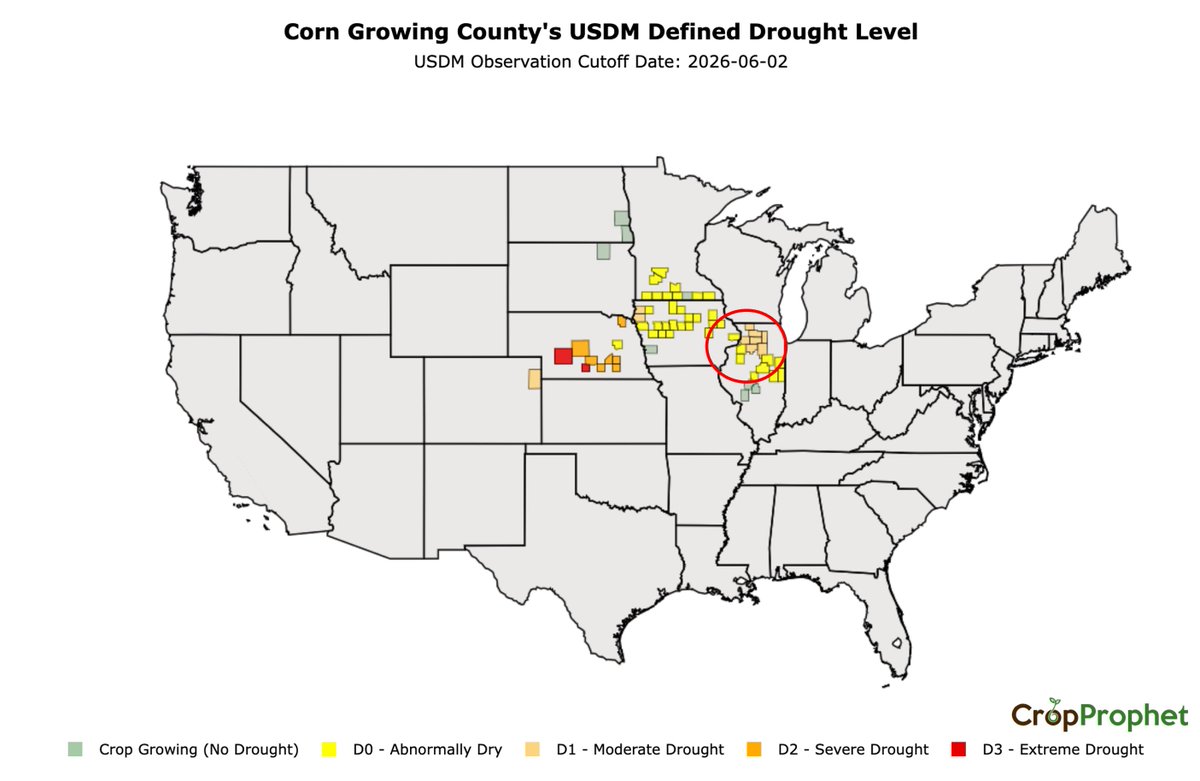
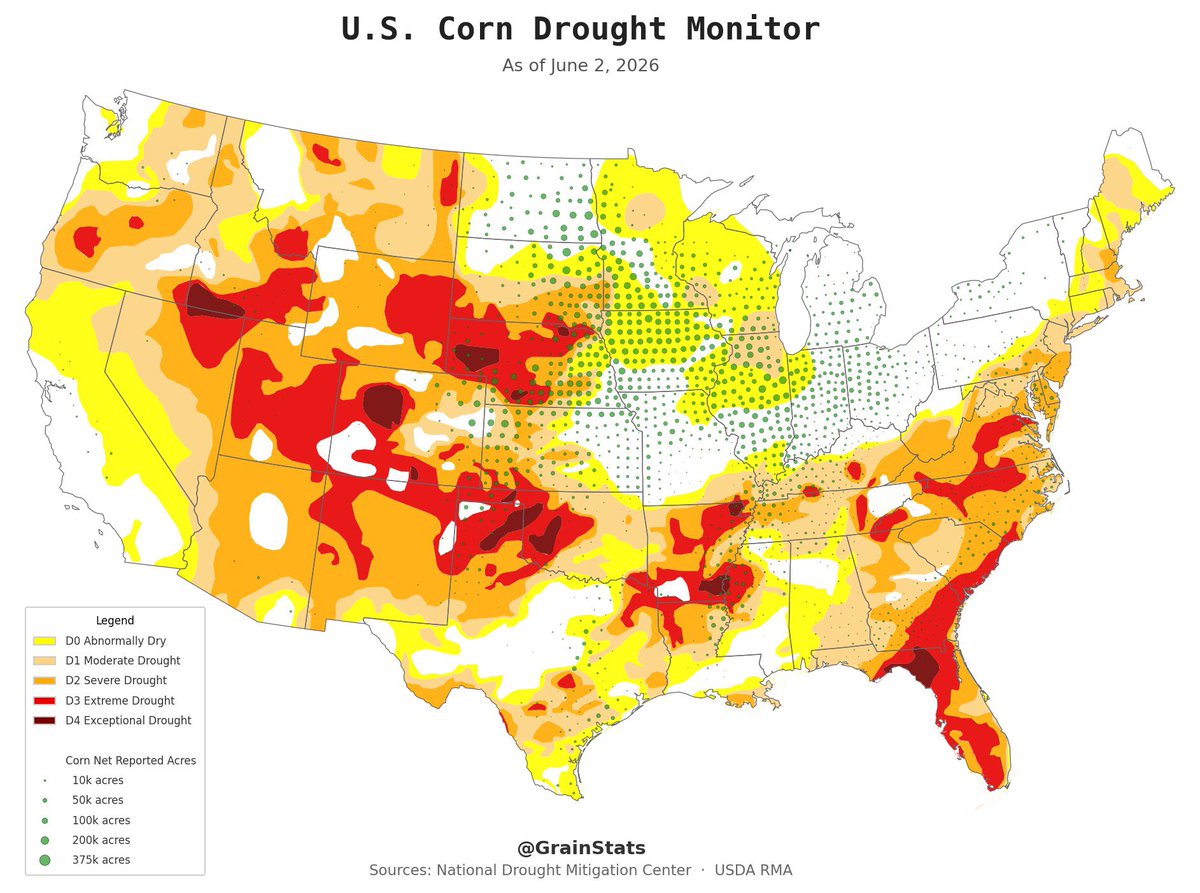
A soon-to-be-released CropProphet tool identifies the USDM-defined drought category for corn-growing counties within the top 20% of U.S. corn production.
Northern Illinois contains several of these high-production corn counties, with many currently classified as D2, Severe Drought, based on the latest USDM observation cutoff date shown in the graphic.
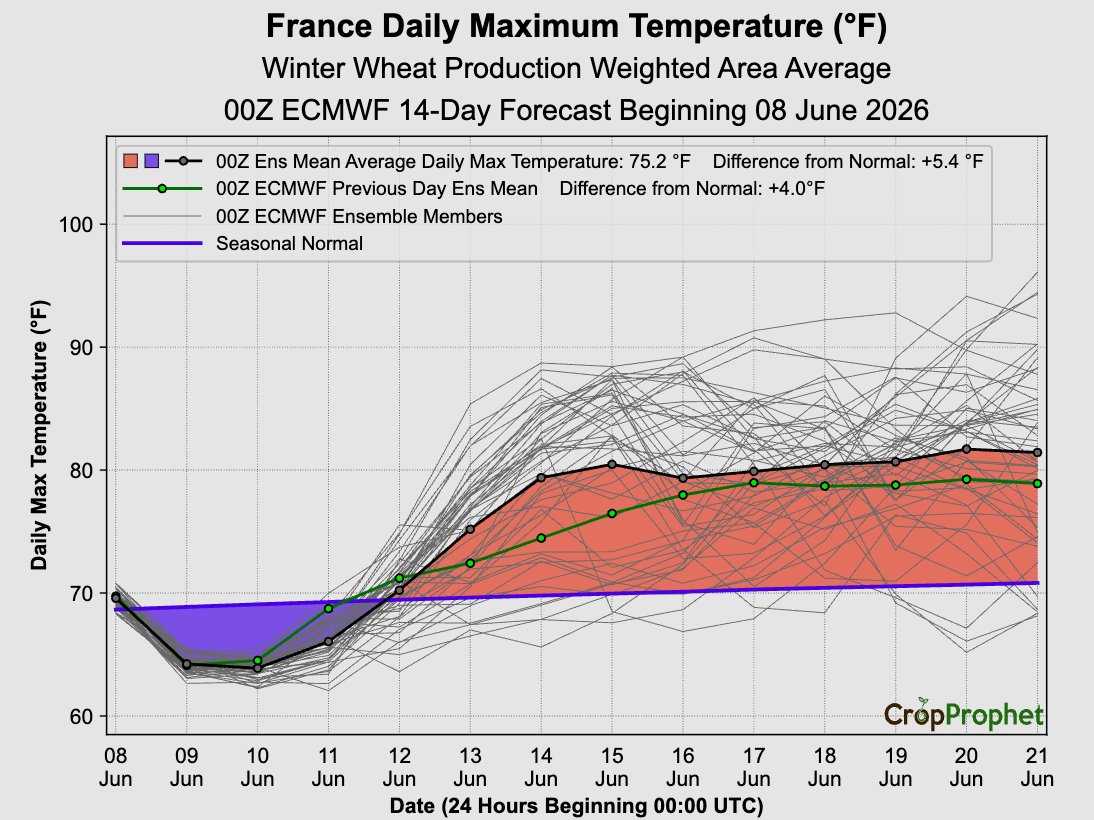
Today's 00Z ECMWF 14-day Illinois corn production-weighted precipitation forecast shows a surplus relative to seasonal normal, with the largest daily total forecast being today. As a result, the overall 14-day forecast outcome will be strongly influenced by how much precipitation occurs today.
#OOTT #AgWx #AgWeather #Corn

1
2
3
1,134
Jun 5
CropProphet is preparing to release a new crop progress view for customers.
These graphics show Ohio corn planting progress for the current year in red, compared with the full historical distribution of crop progress.
The first graphic shows percent planted progress relative to the full-history climatology.
The second graphic shows percent planted progress adjusted using the past 15-year climatology, while still comparing the current year within the full historical distribution.
For the current year, Ohio corn planting progress is below the climatological median. Over the past several reporting weeks, the deviation has declined indicating that planting progress has fallen farther behind the climatological median.
#OOTT #AgWx #AgWeather #CropProphet

1
1
3
773
CropProphet retweeted

Jun 5
Corn Prices Drop AGAIN - Is a Summer Rally Still Possible?? youtu.be/T5zNhVu-QEQ?si=TFTQ… via @YouTube @chief321 @kenziej89 @AgMarket_Net @CropProphet
3
13
3,954
Jun 4
Check out our soon-to-be-released USDM graphic, which will be available in the CropProphet Enterprise interface.
This GIF shows corn-growing counties by U.S. Drought Monitor-defined drought level.
The animation filters counties by corn production share, starting with all corn-producing counties and narrowing in 10% increments to the top 10% of corn-producing counties.
Try CropProphet: bit.ly/TryCropProphet
#OOTT #AgWx #AgWeather #USDM

2
7
1,465
Jun 3
Check out our YouTube video that dives deeper into this: youtu.be/M_Rr_T0PmZ4
Jun 3
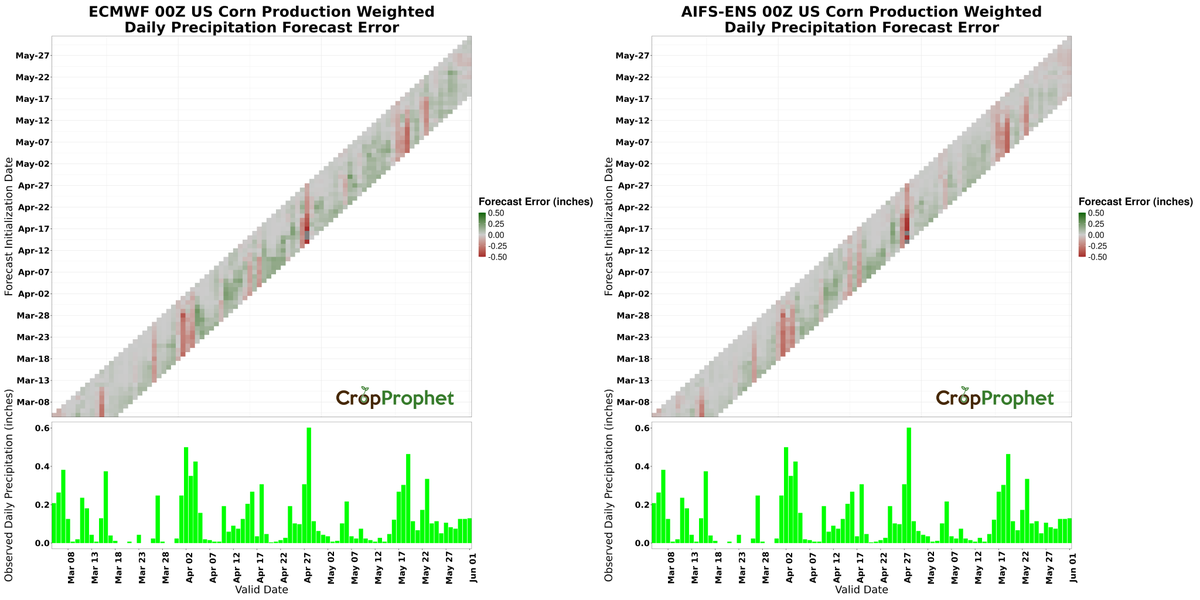
Using the Point-in-Time Weather Forecast API, we built a forecast-error waterfall. Each row is a forecast initialization date over the last 90 days, each column its valid date, colored by forecast error (forecast minus observed). Here we compare ECMWF and AIFS-ENS 00Z for US corn production-weighted daily precipitation.
Two patterns stand out:
1.On big observed rain events (the tall bars below), both ECMWF and AIFS-ENS under-forecast the total. The red streaks run vertically across all lead times.
2. In dry stretches, both lean slightly the other way and over-forecast, meaning they are not dry enough.
#OOTT #AgWx #AgWeather #Corn #ECMWF #AIFS
1
3
1,442
Jun 3
Using the Point-in-Time Weather Forecast API, we built a forecast-error waterfall. Each row is a forecast initialization date over the last 90 days, each column its valid date, colored by forecast error (forecast minus observed). Here we compare ECMWF and AIFS-ENS 00Z for US corn production-weighted daily precipitation.
Two patterns stand out:
1.On big observed rain events (the tall bars below), both ECMWF and AIFS-ENS under-forecast the total. The red streaks run vertically across all lead times.
2. In dry stretches, both lean slightly the other way and over-forecast, meaning they are not dry enough.
#OOTT #AgWx #AgWeather #Corn #ECMWF #AIFS
1
1
4
2,272